HR Workforce diversity dashboard Excel Template and Google Sheets
The Workforce Diversity Dashboard Excel Template is a powerful HR Template designed to help organizations analyze and monitor workforce diversity across the organization. This Digital Dashboard enables Human Resource teams to track employee demographics such as gender, age group, department representation, and diversity trends, helping organizations build a more inclusive workplace.
As a comprehensive HR Dashboard, the template transforms workforce data into clear visual insights that support strategic decision-making. The Workforce Dashboard allows HR managers to evaluate diversity distribution across departments, leadership levels, and job roles. This helps organizations identify diversity gaps and implement initiatives to improve representation.
The template also functions as a practical Workforce Template for monitoring workforce composition and supporting diversity policies. With easy-to-read charts and summaries, the Diversity Template provides valuable insights into the overall HR Workforce structure.
Overall, this dashboard helps organizations strengthen diversity and inclusion strategies while improving workforce reporting and human resource planning.
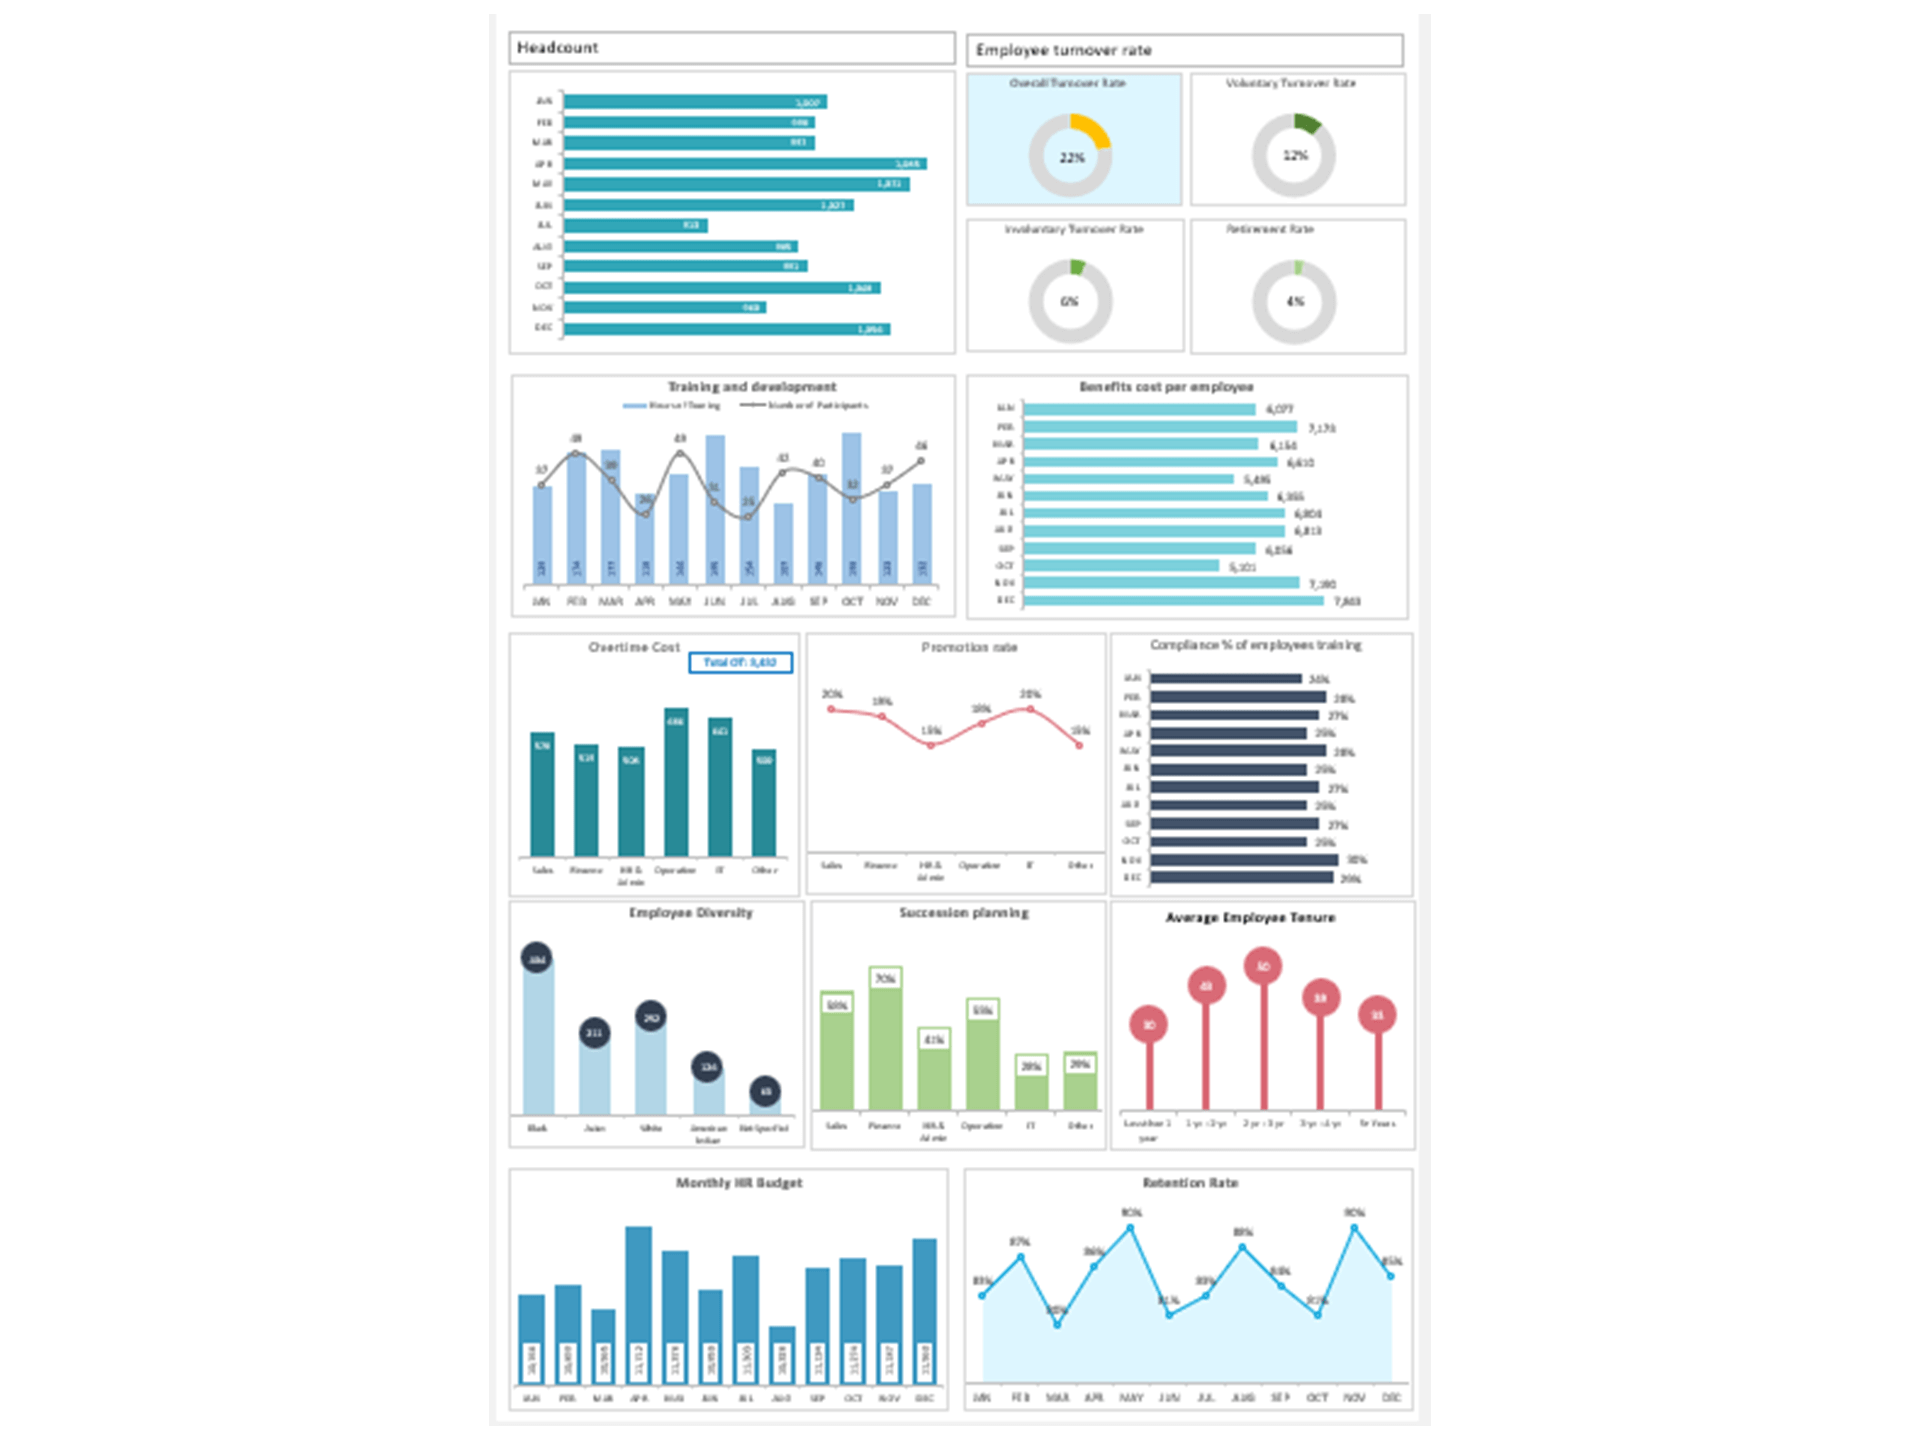
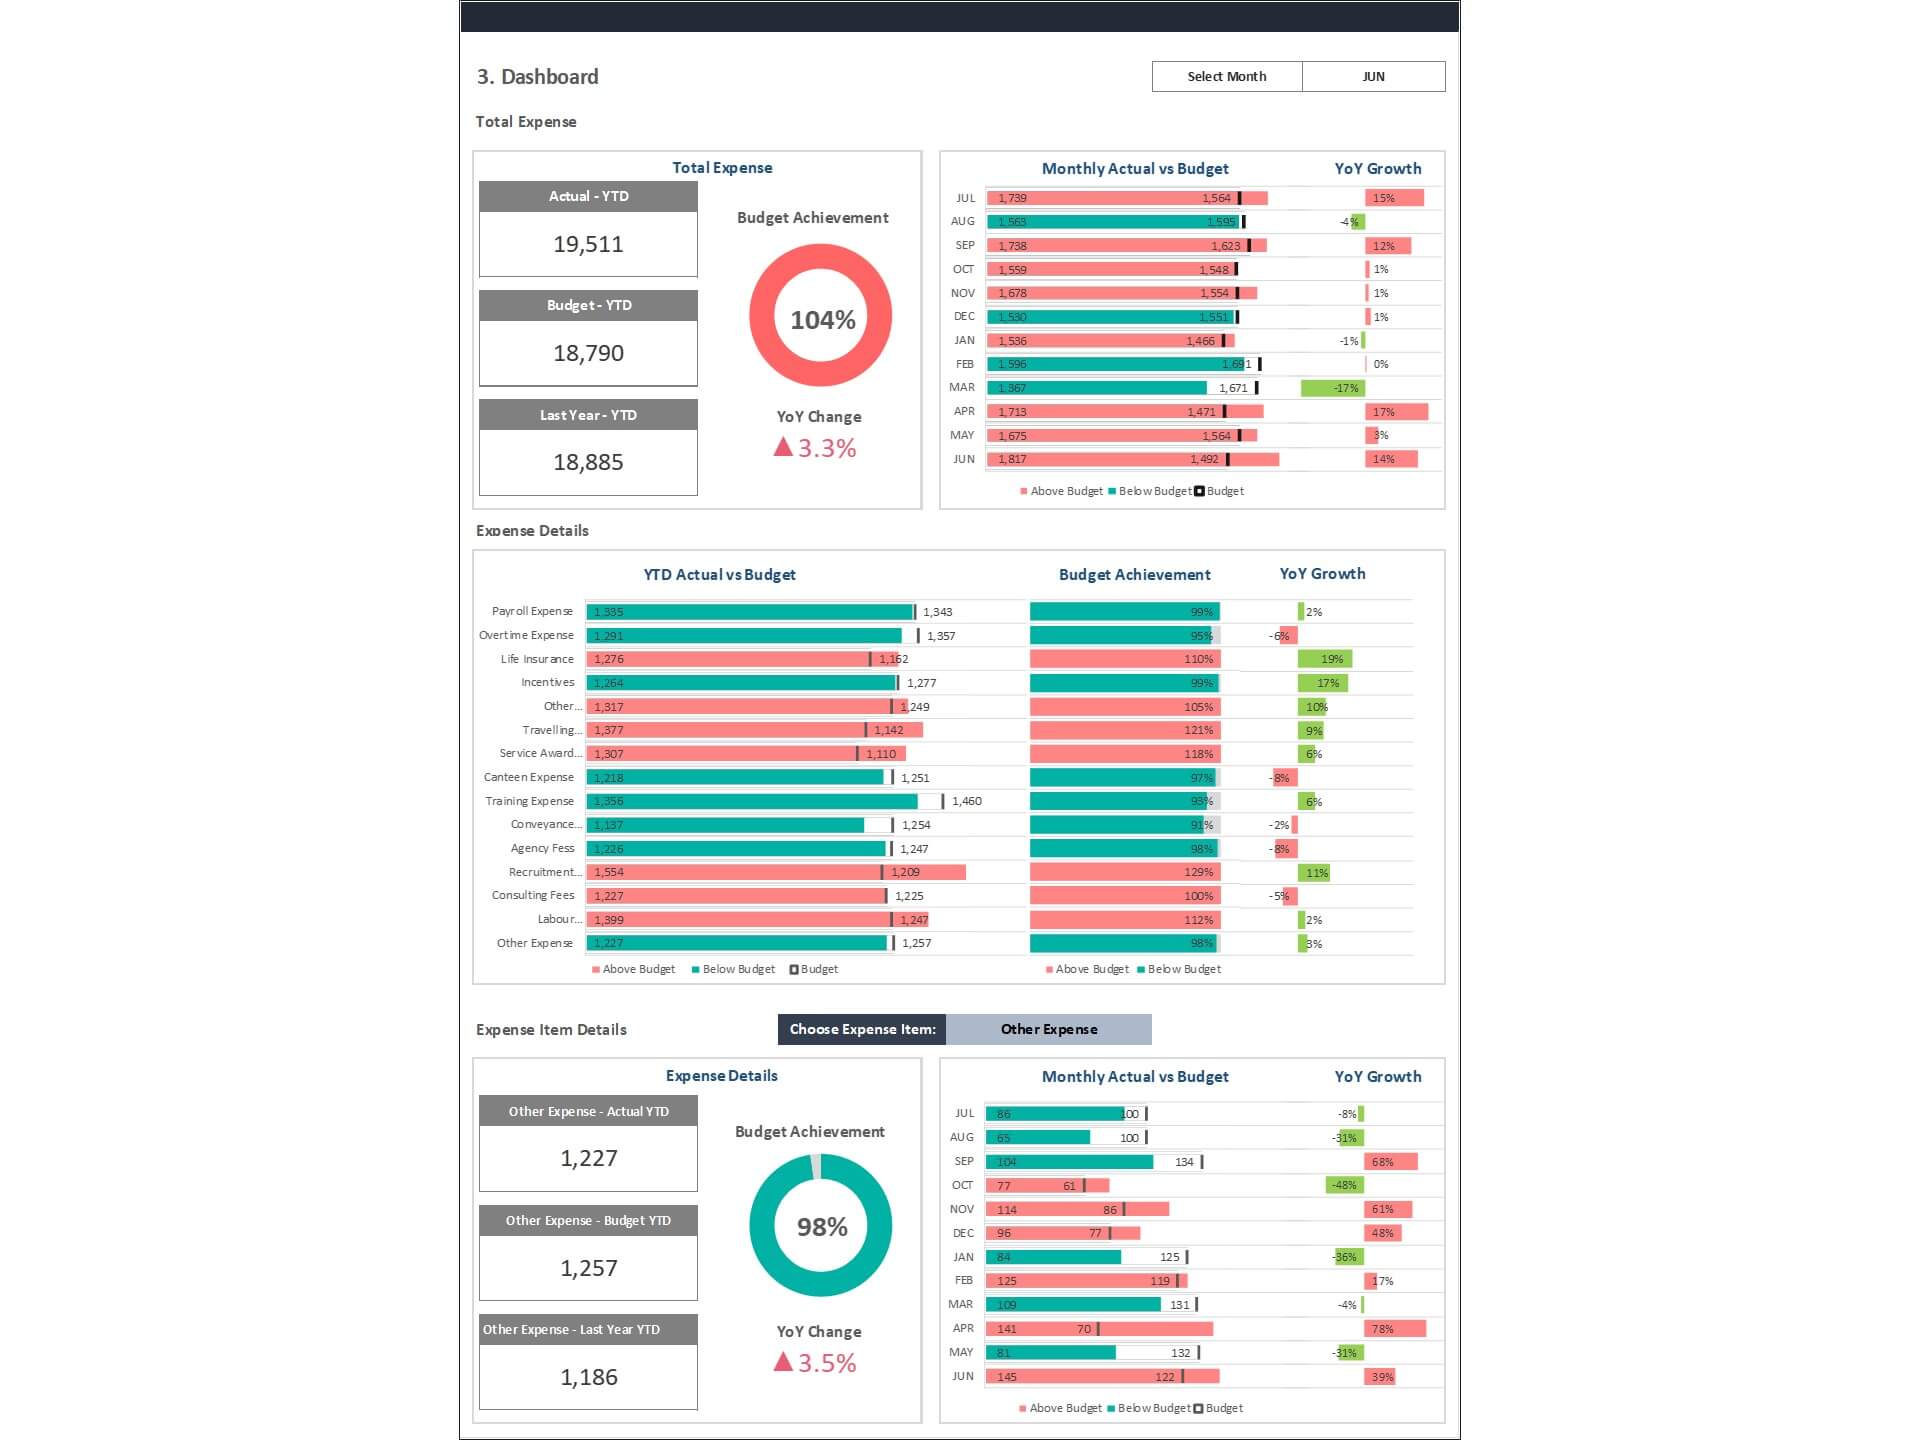
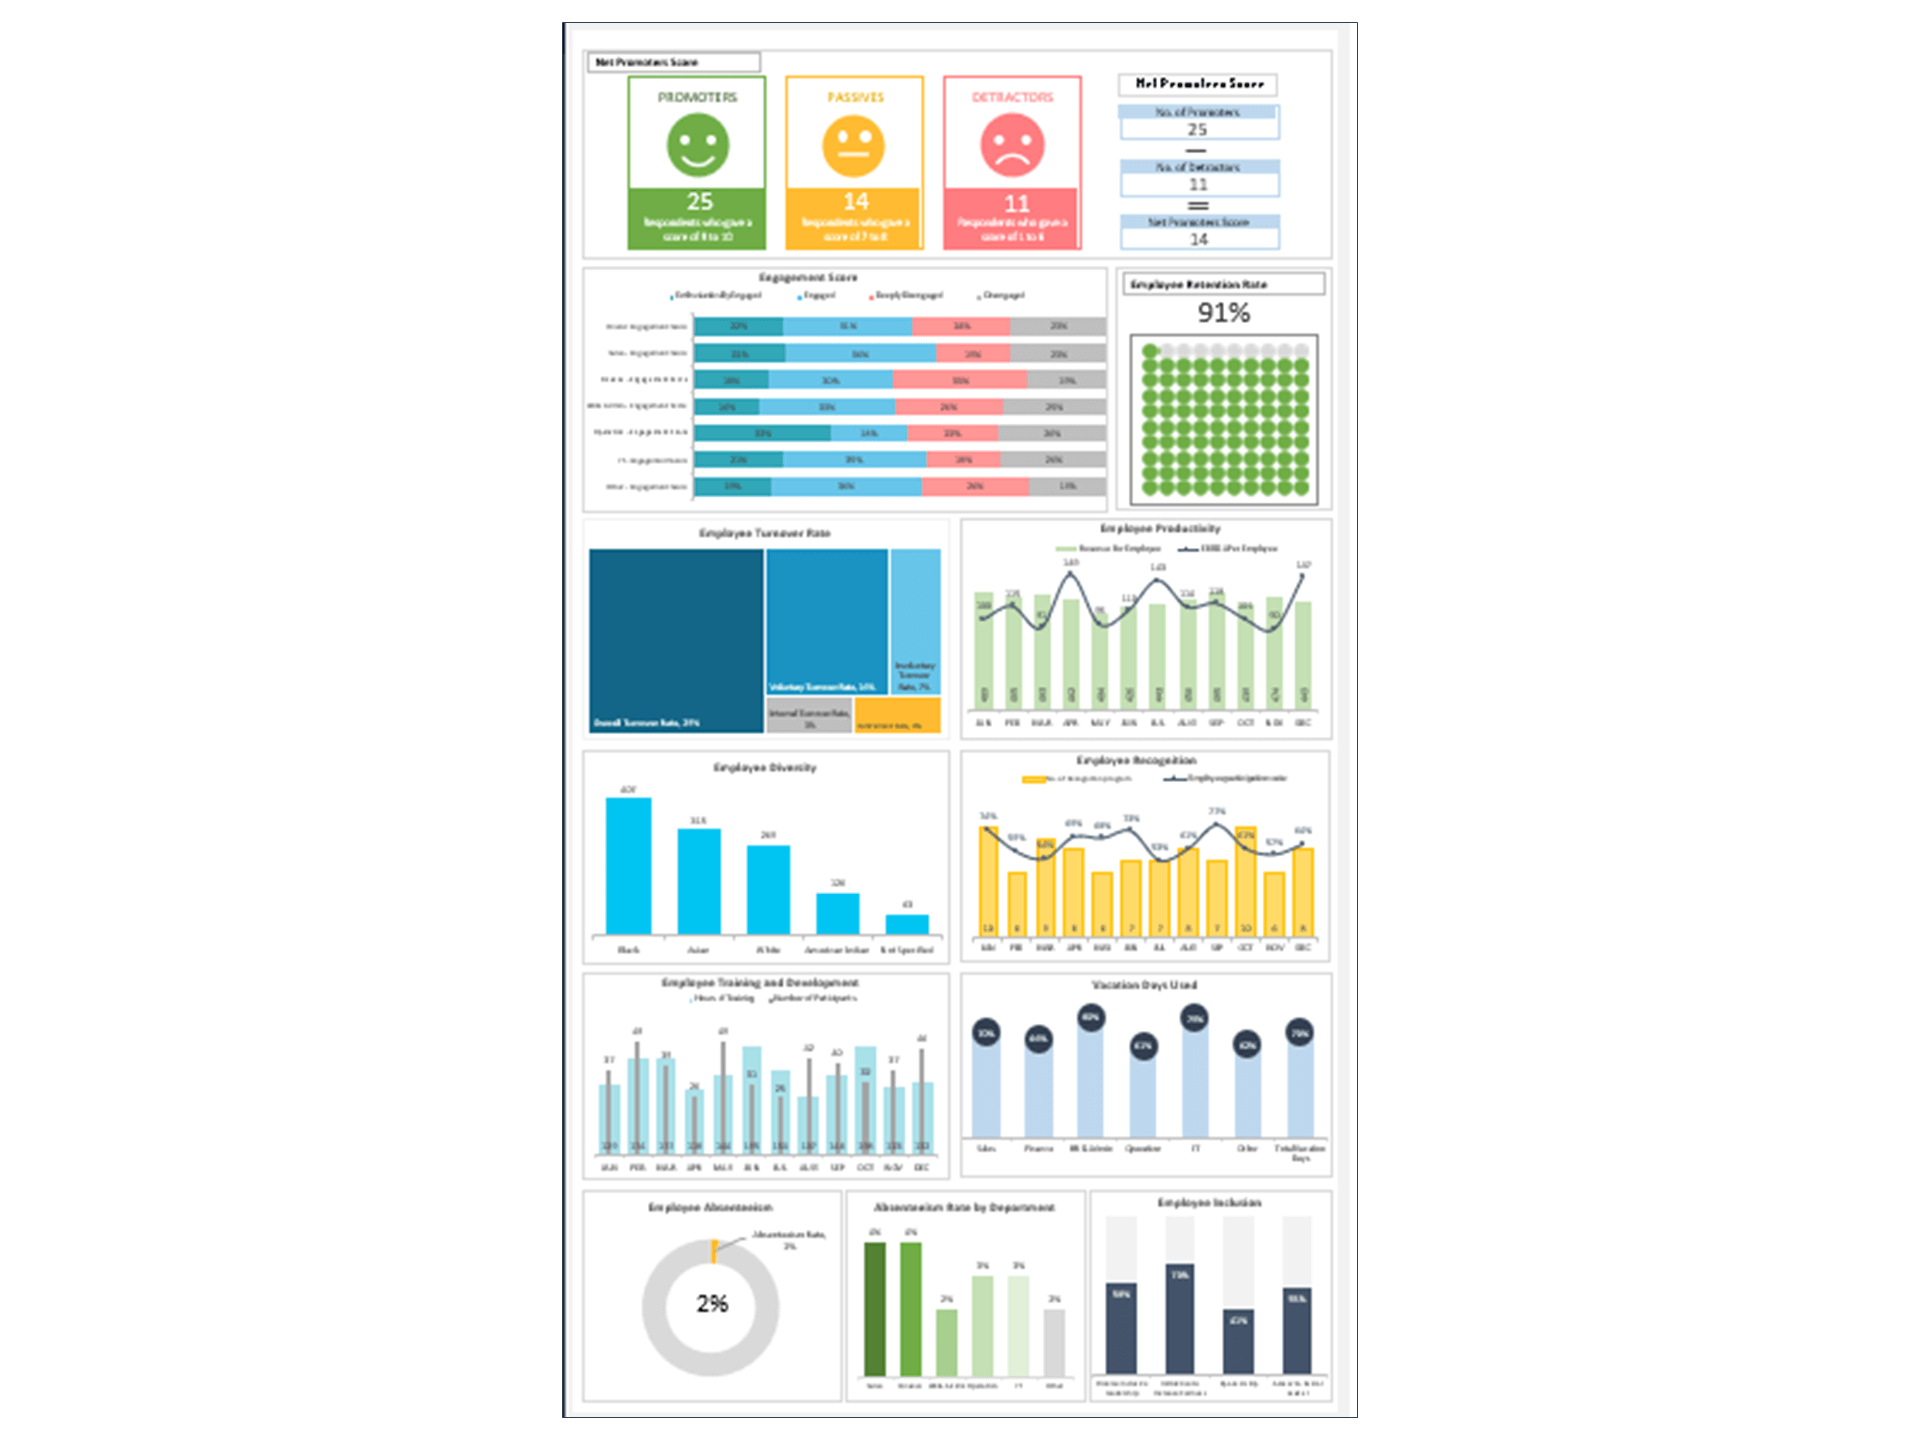
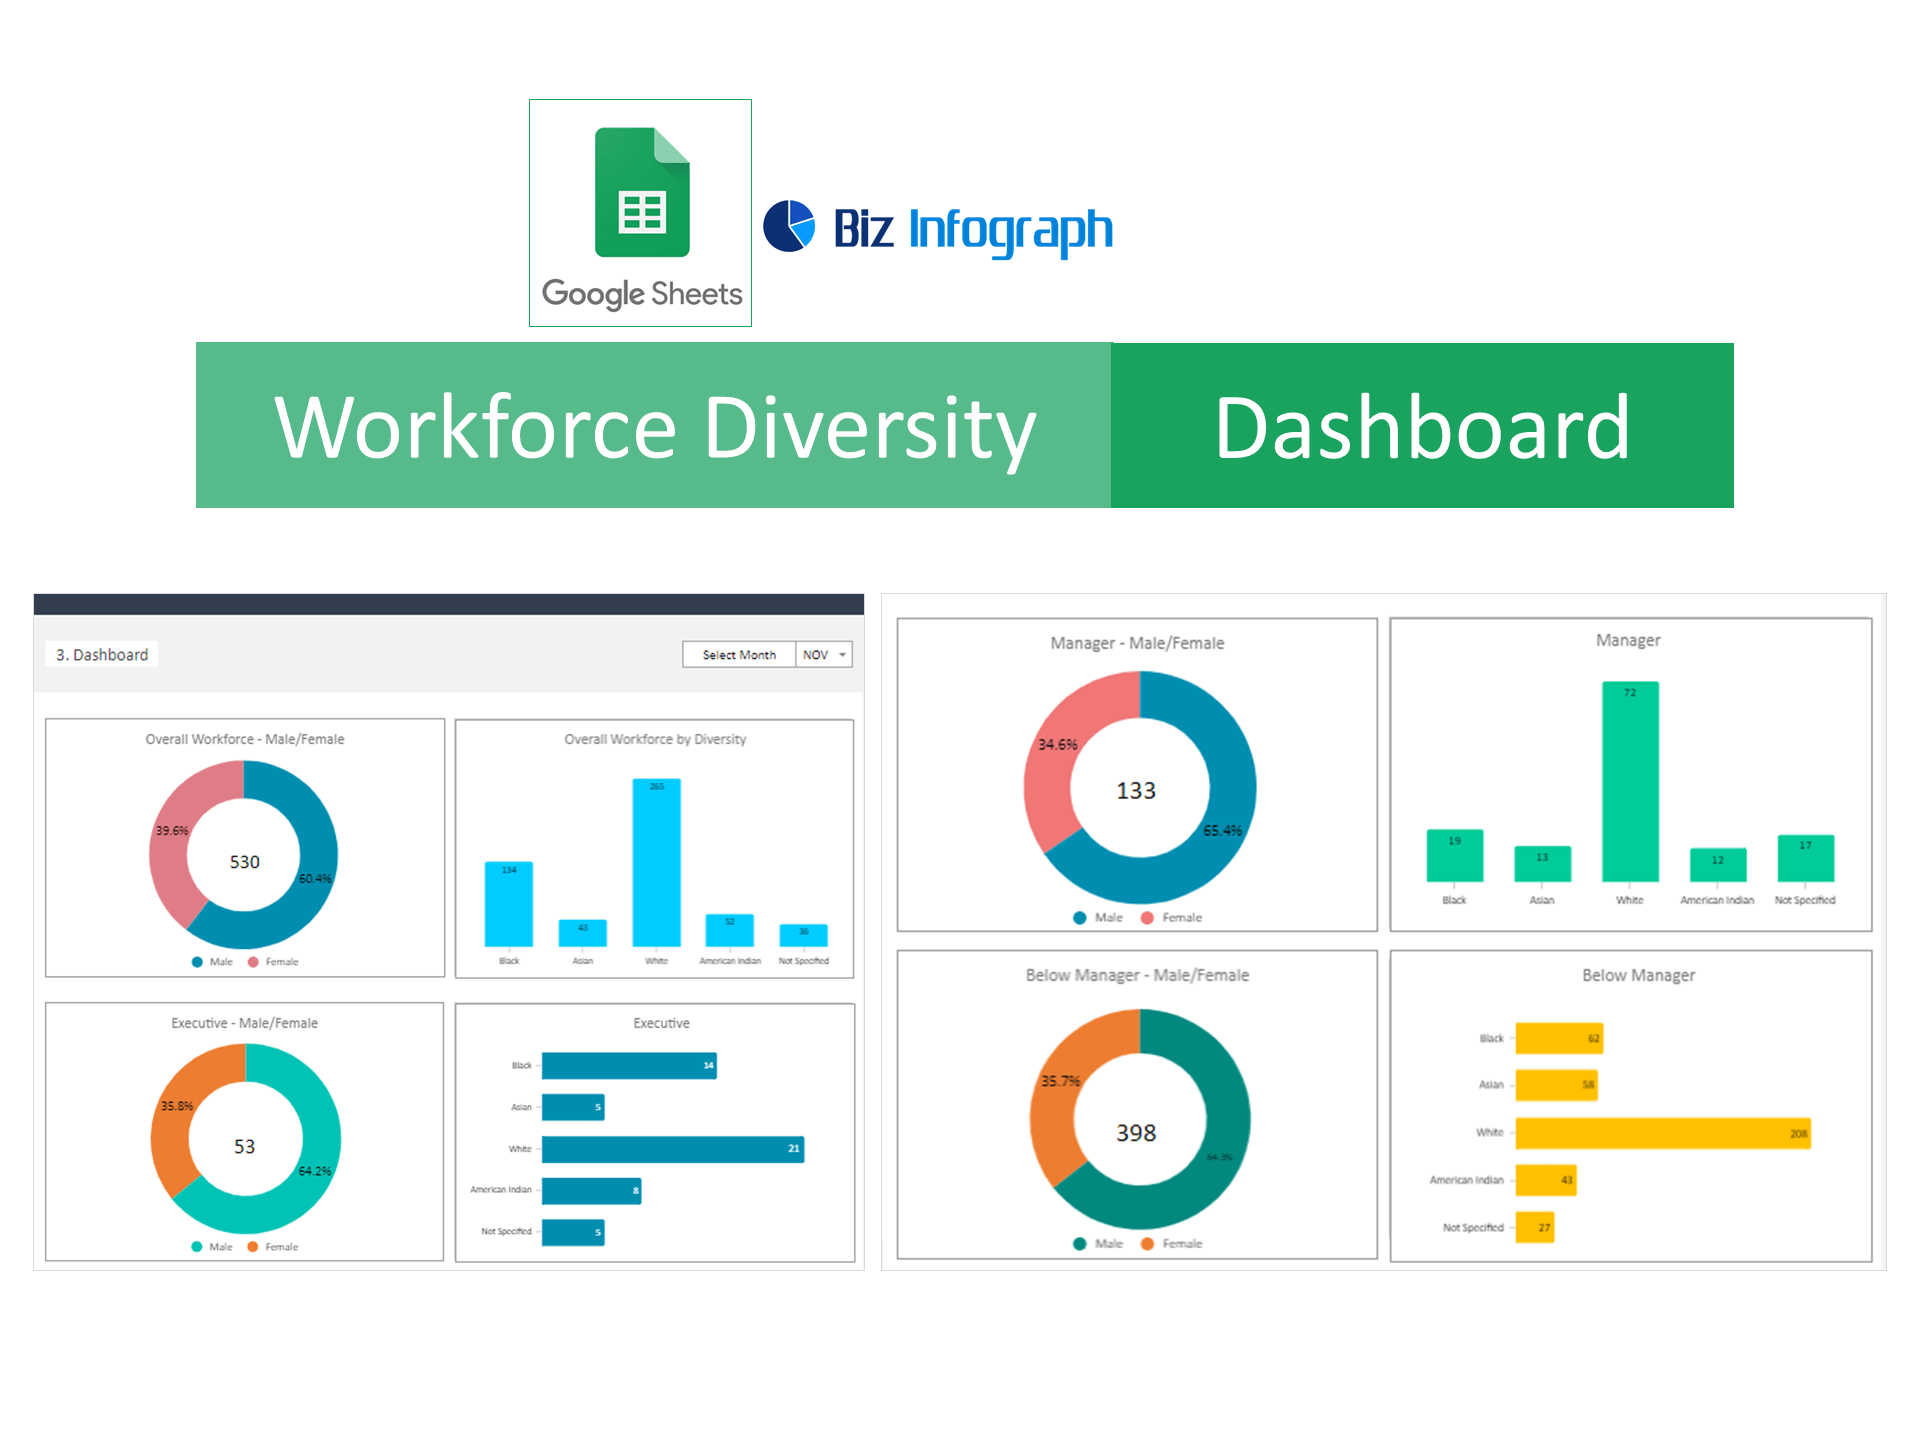
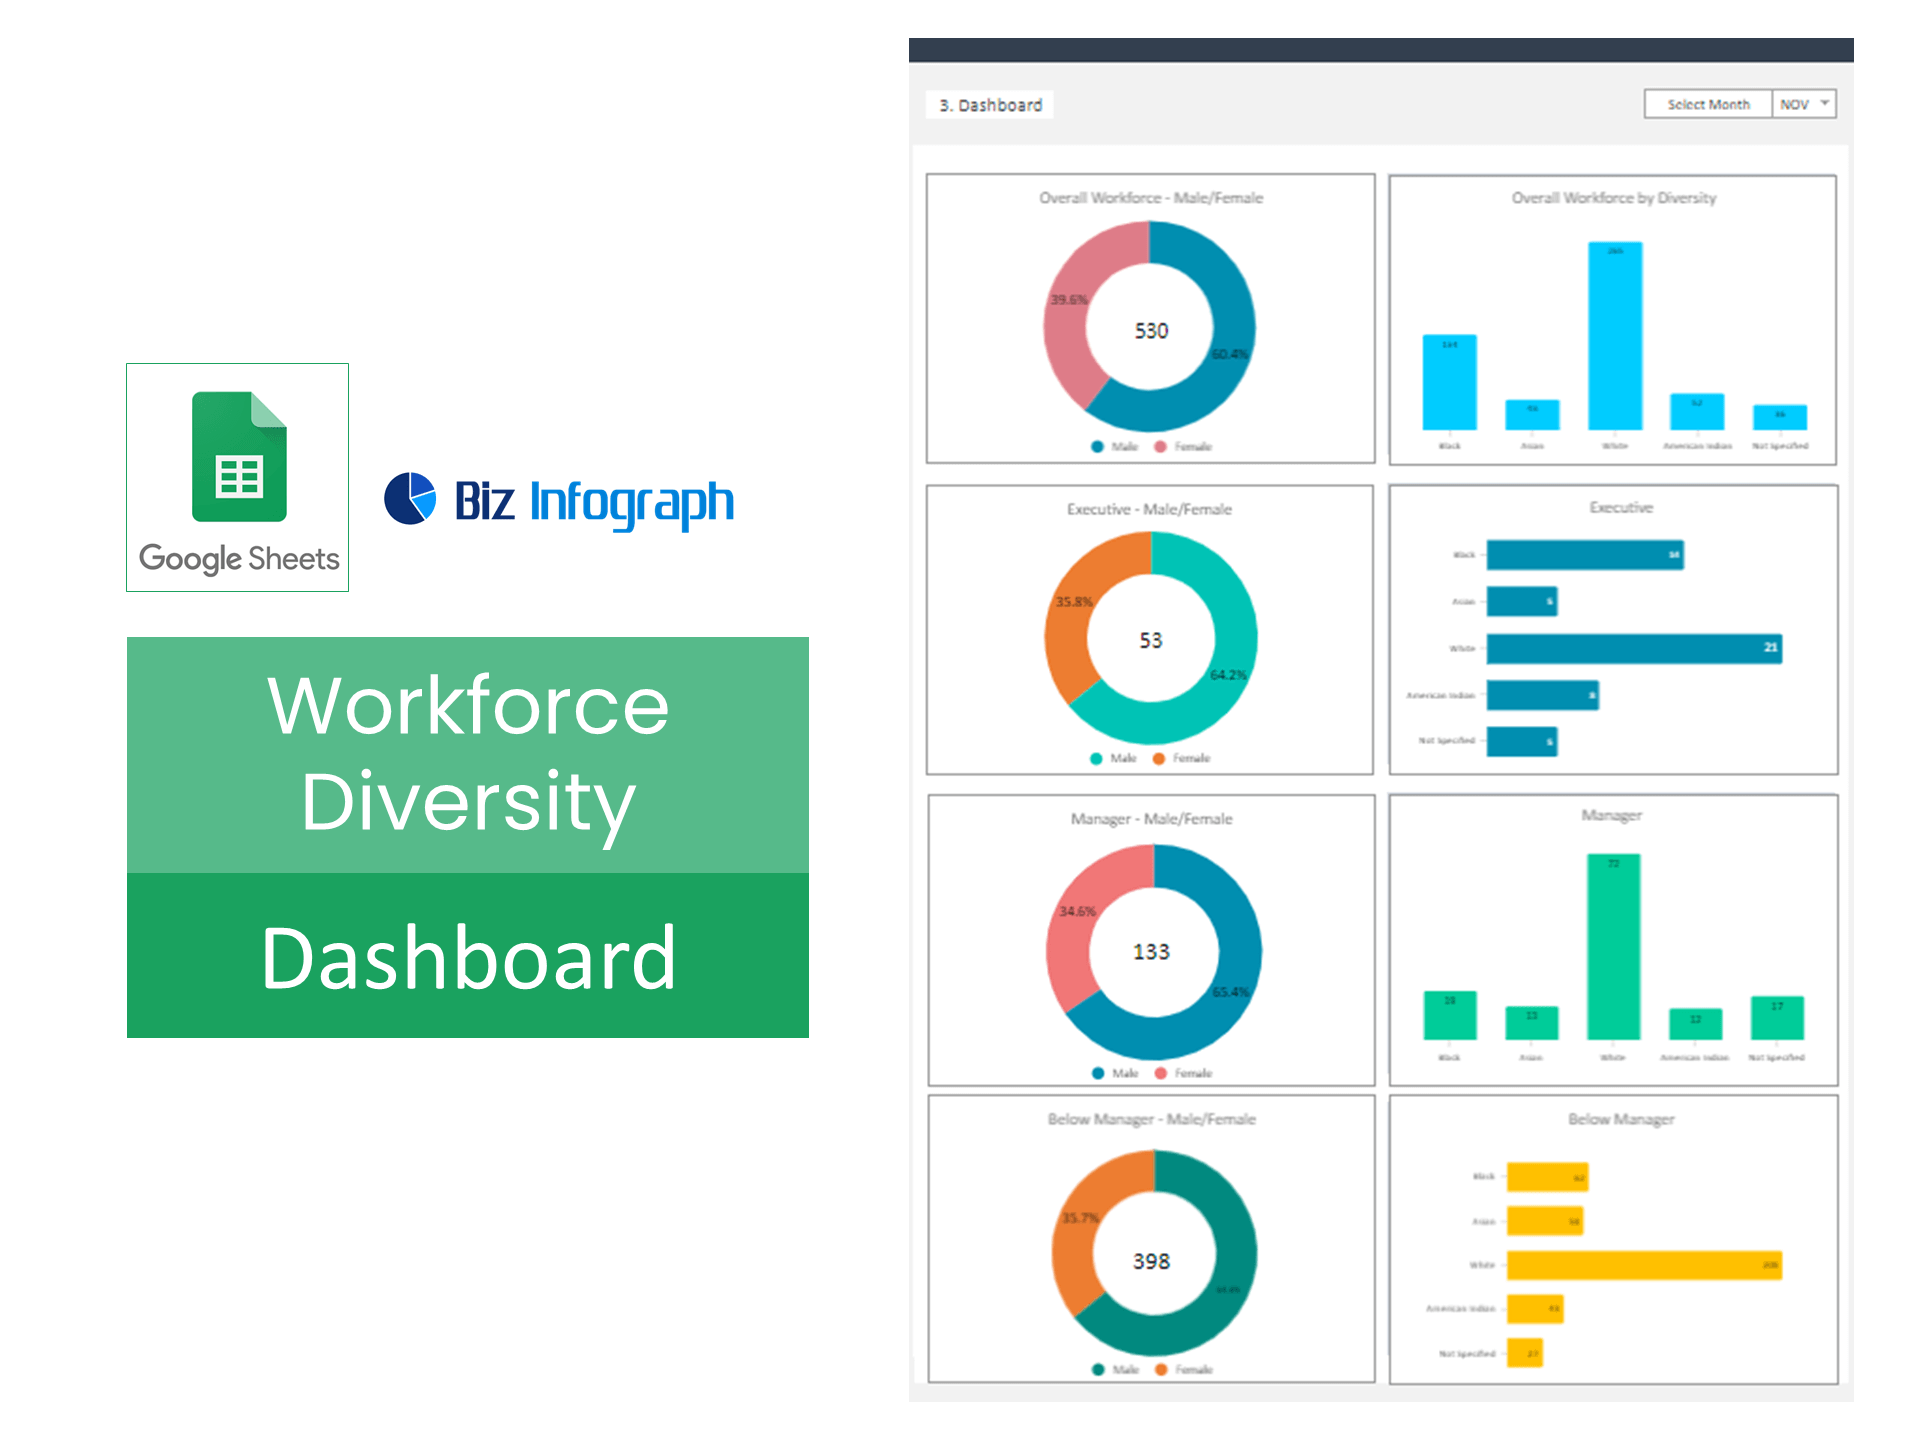
A typical dashboard includes the following components
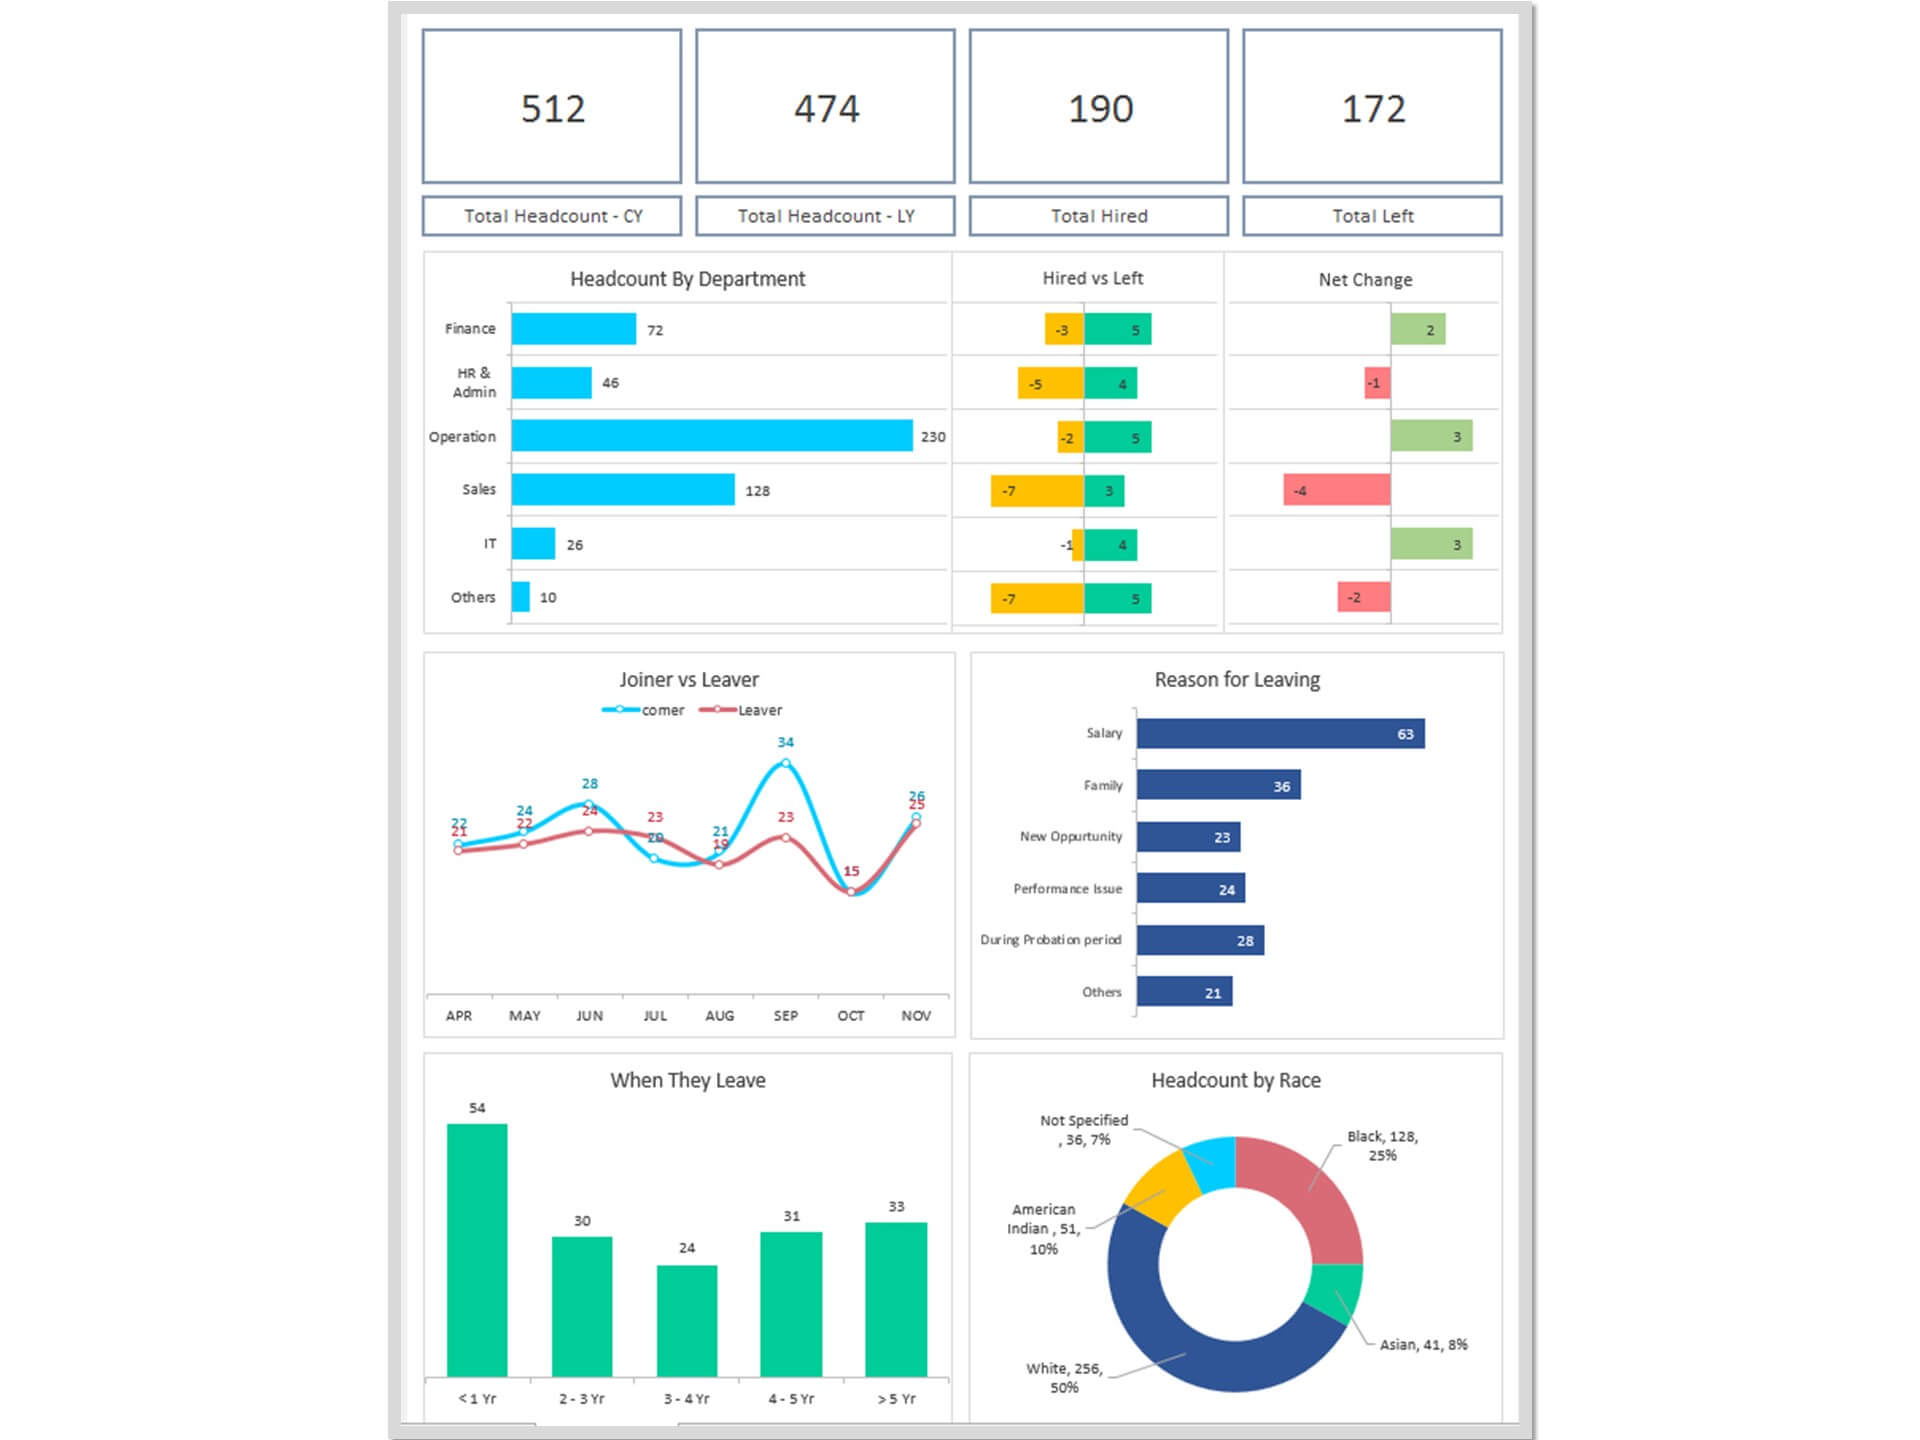
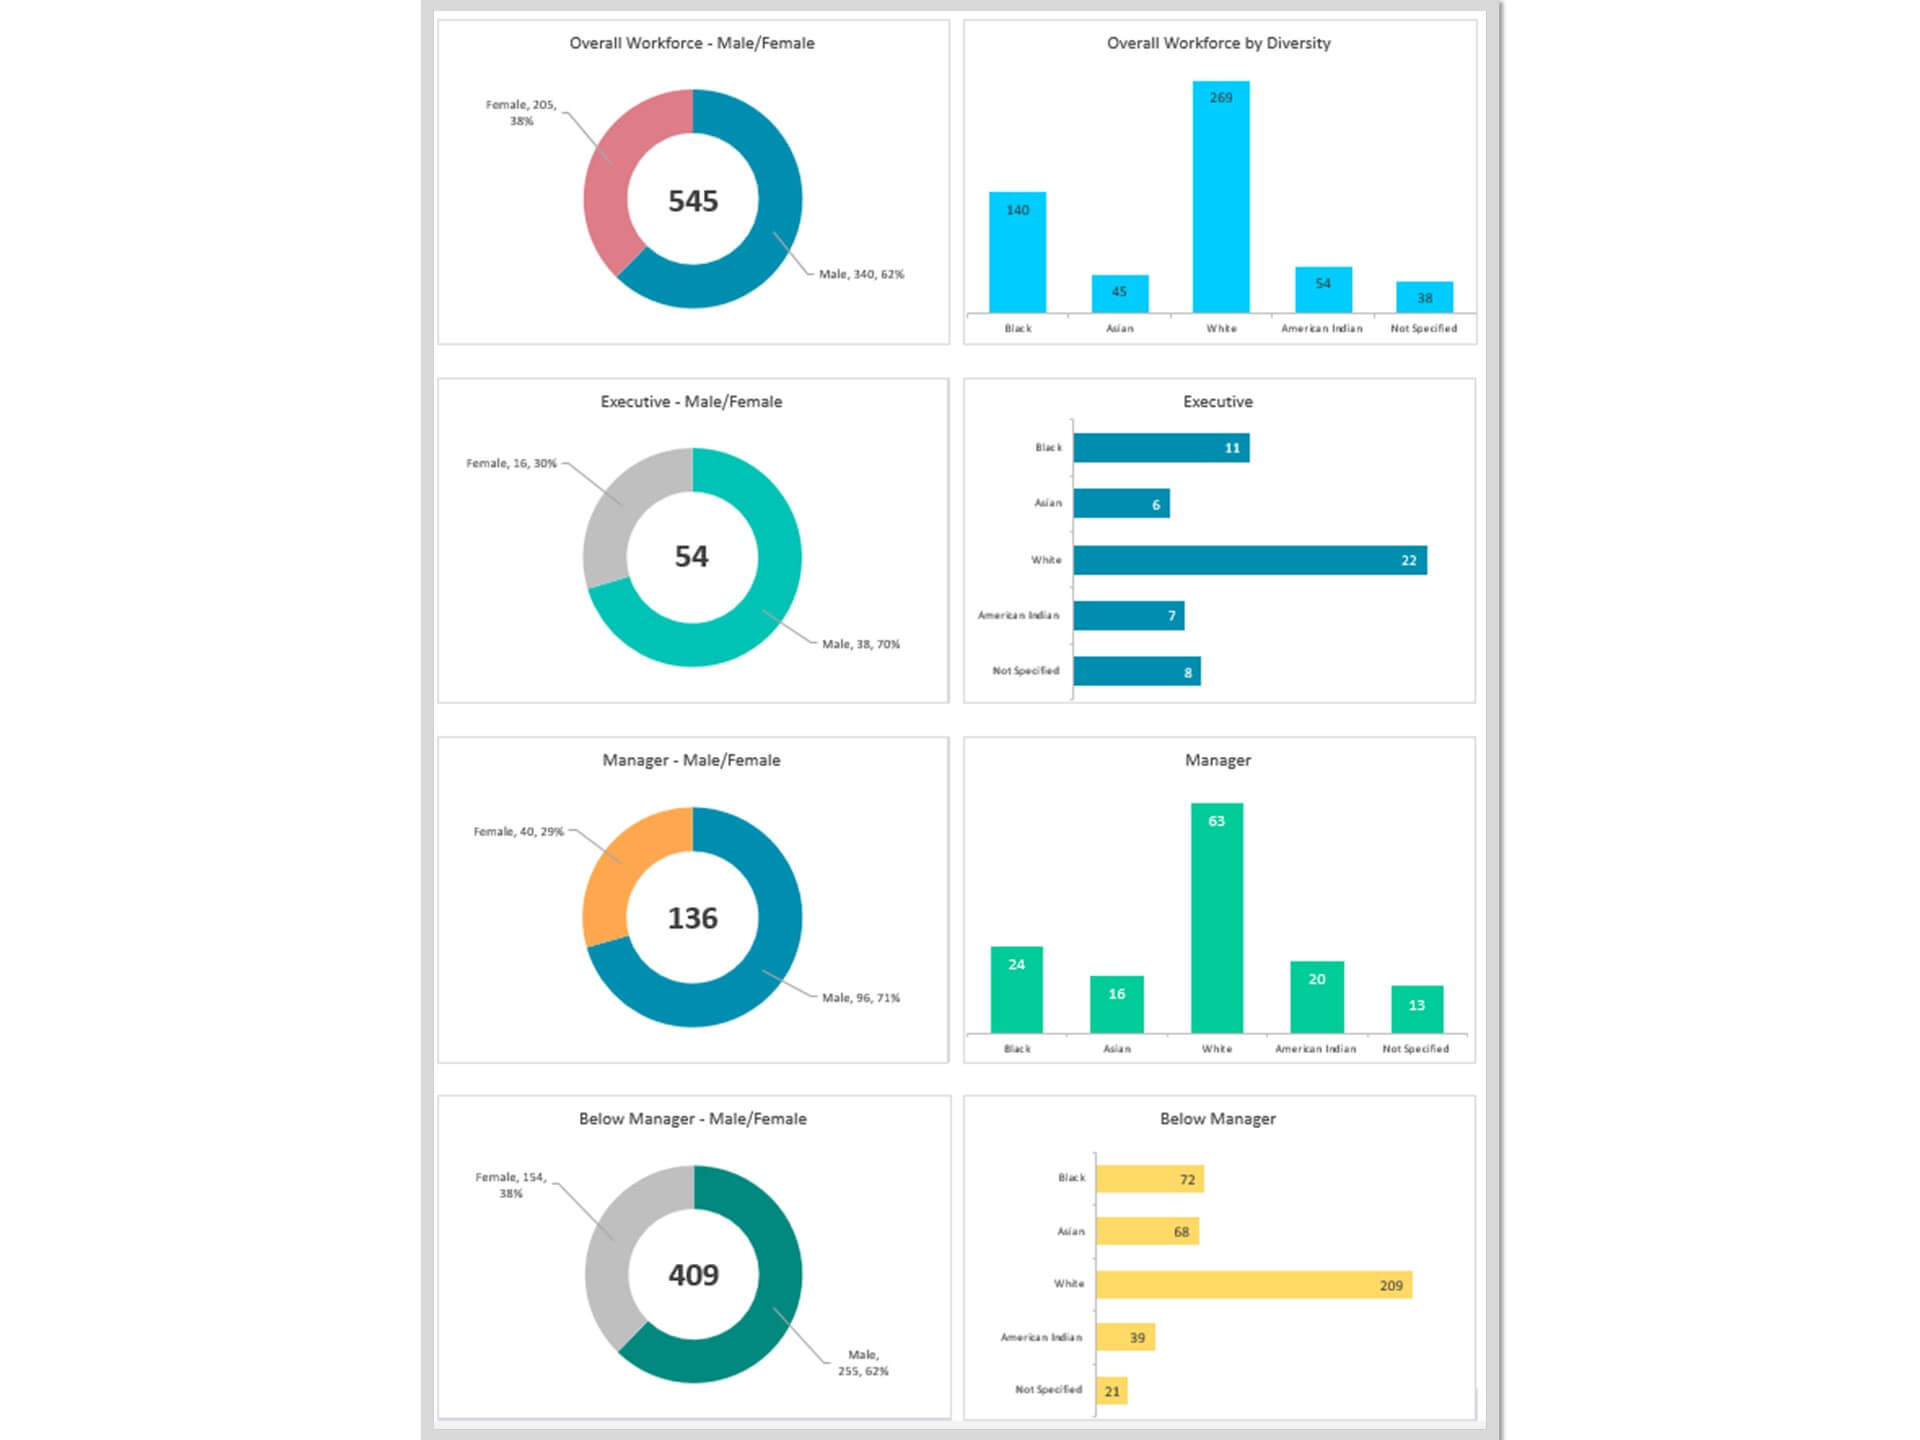
- Overall workforce composition by race, ethnicity, and gender
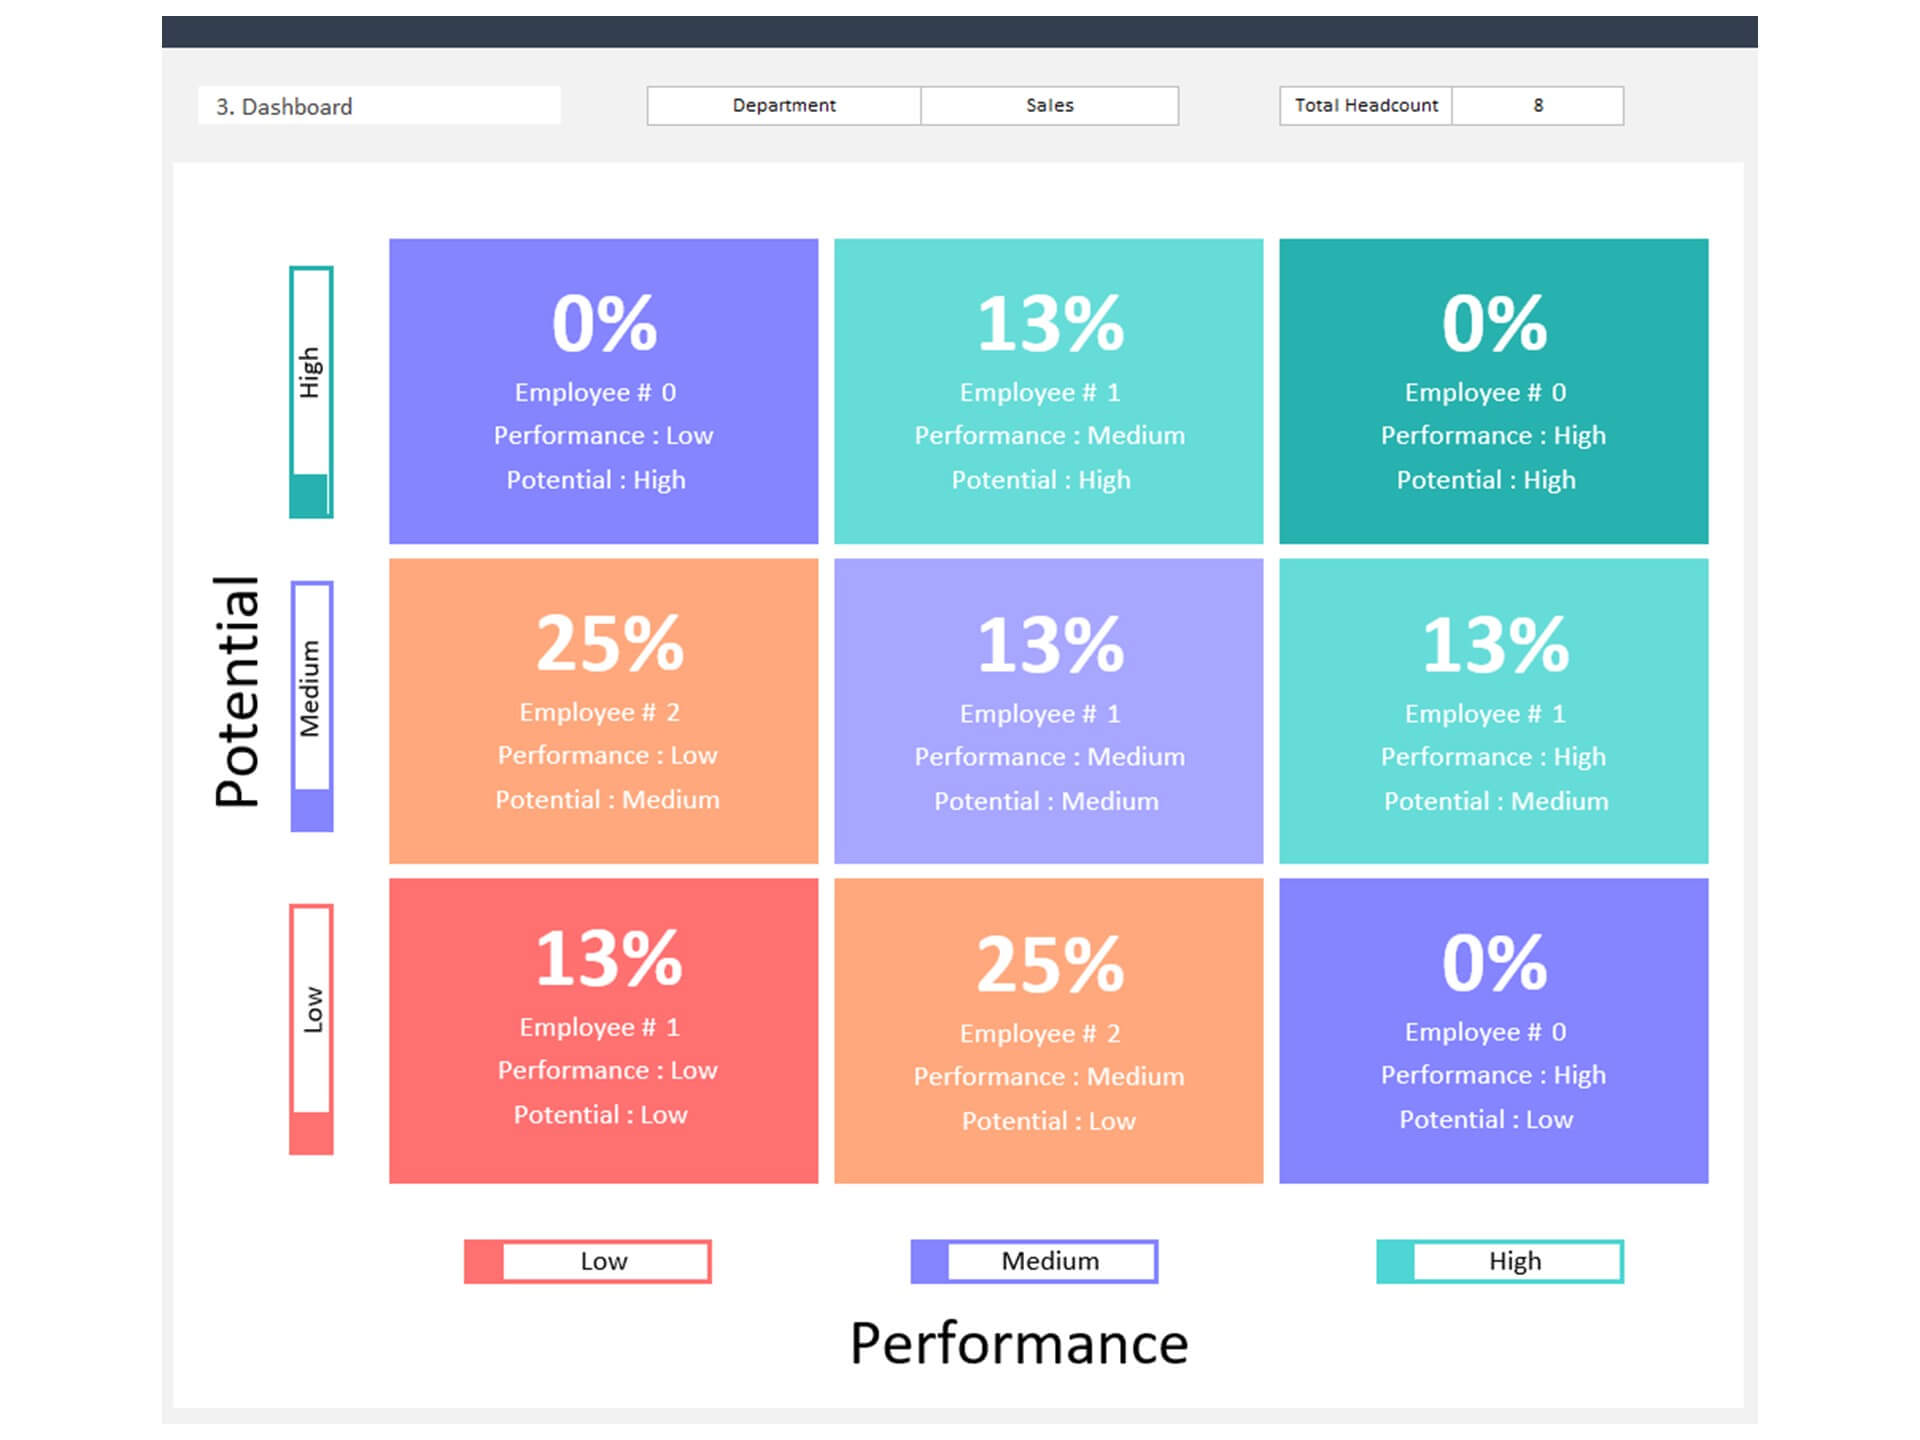
- Representation of diverse groups in key roles and leadership positions
- Employee engagement levels across diverse groups
How to create a workforce diversity dashboard
In order to be successful in the workforce, businesses must maintain a diverse pool of employees. This is especially important for human resources managers, as they need to be able to draw on a variety of skills and experiences in order to best serve their employees. A workforce diversity dashboard can be an effective tool for tracking progress and ensuring that companies are making strides towards achieving a more inclusive environment.
The benefits of using a workforce diversity dashboard
A workforce diversity dashboard is an important tool for organizations to measure their progress in achieving diversity and inclusion goals. When used correctly, a diversity dashboard can help organizations identify areas where they need to focus their efforts, as well as track the progress of their diversity and inclusion initiatives over time. By monitoring key metrics, such as employee engagement, representation within different groups, and recruitment and retention rates, organizations can get a better understanding of how well they are doing when it comes to creating a diverse and inclusive workplace. Few more benefits are:
- Increased understanding of workforce demographics
- Improved communication and collaboration among employees
- Fostered creativity and innovation
- Greater employee satisfaction and engagement
- Higher organizational performance and productivity
- Improved decision-making
Key Features
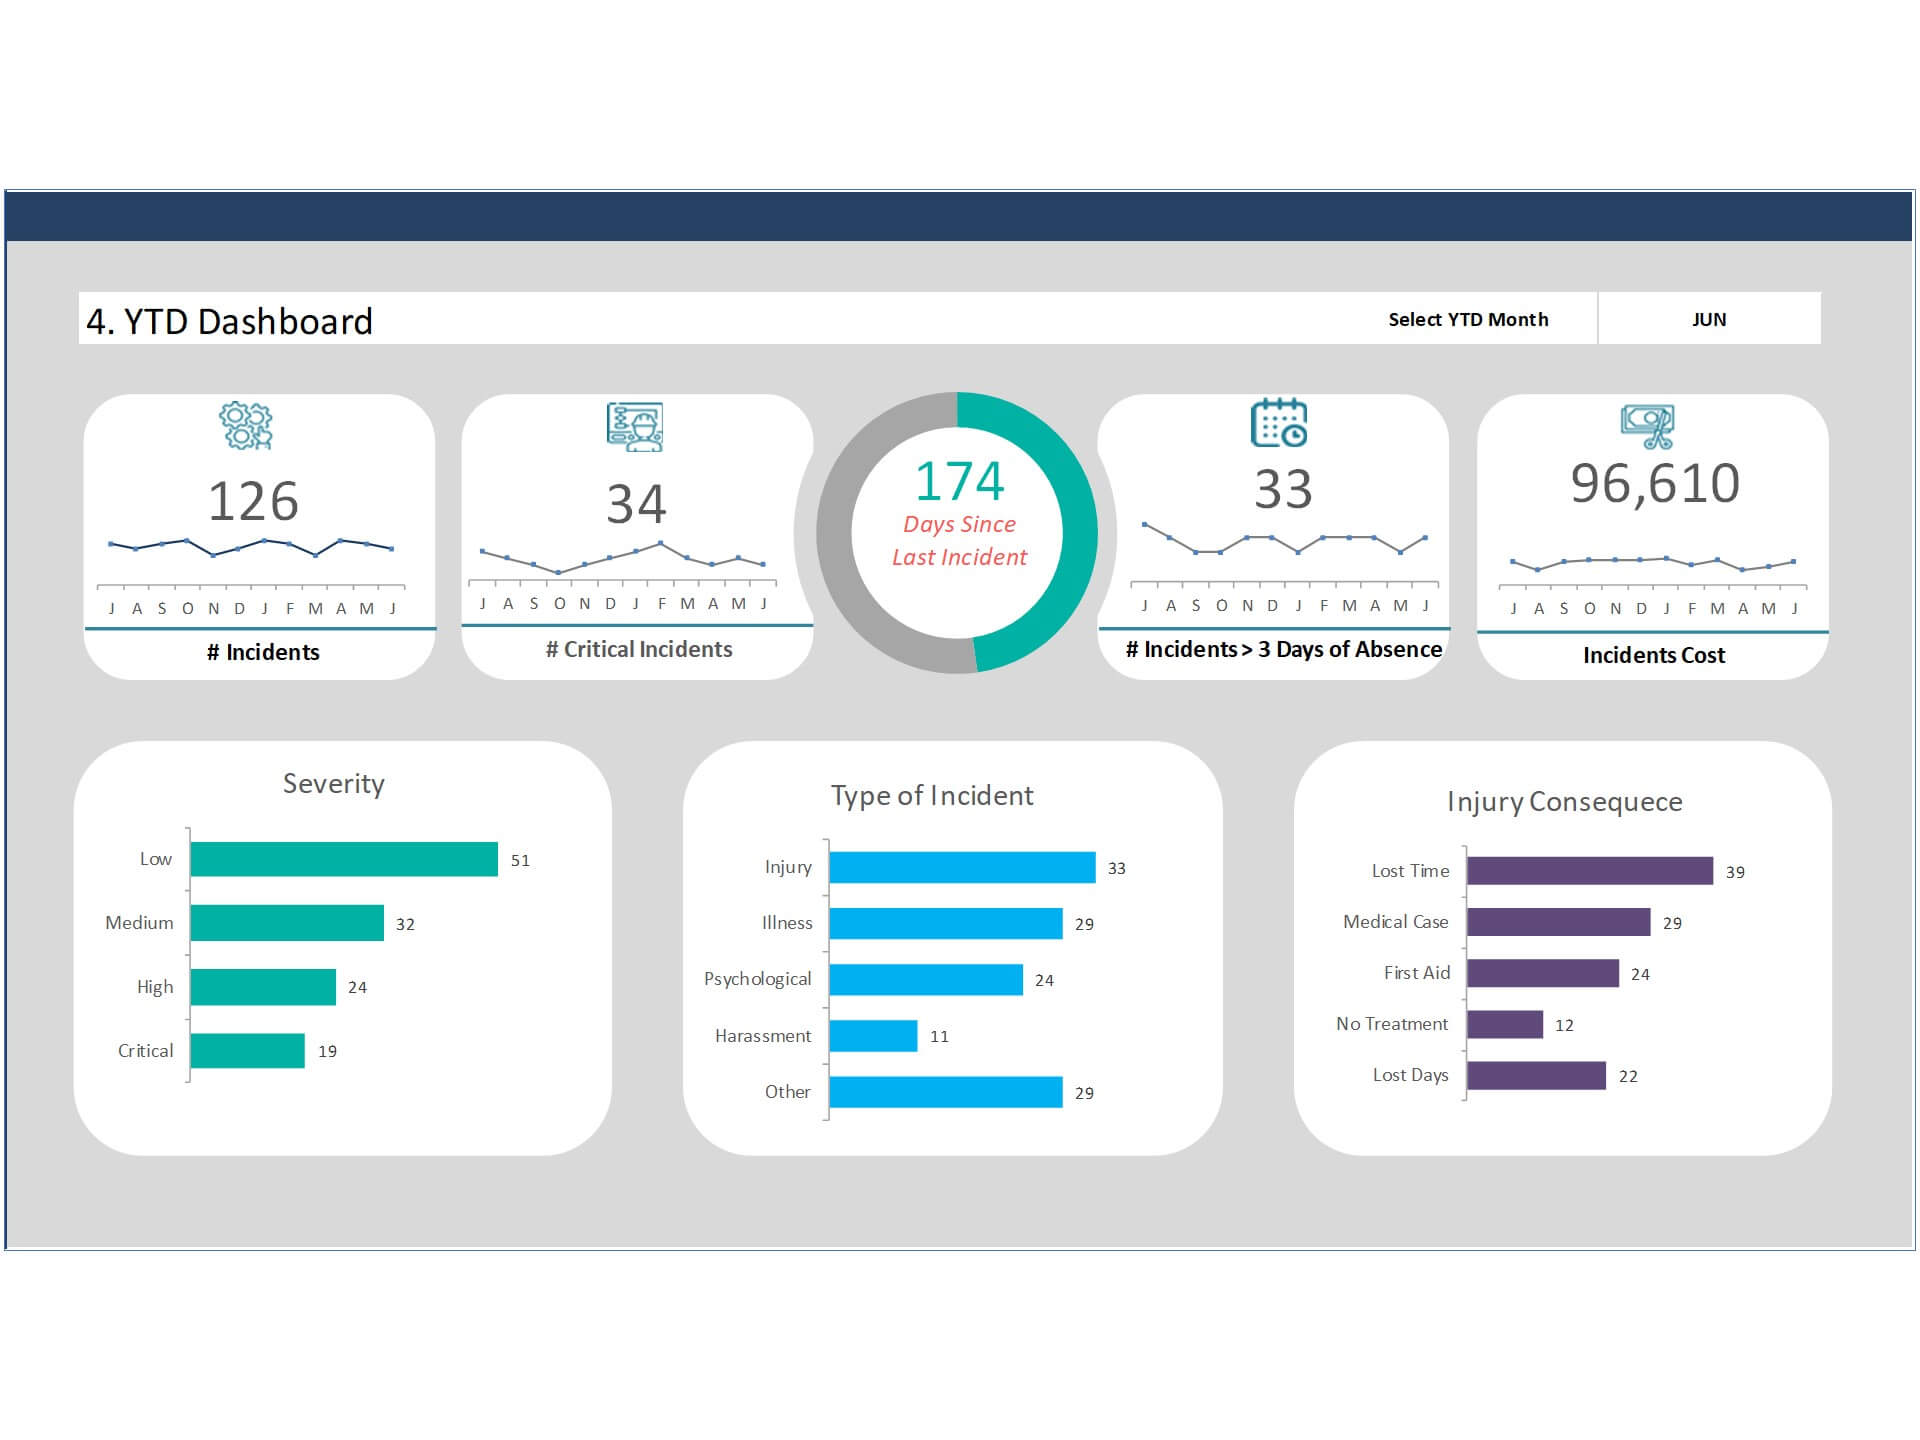
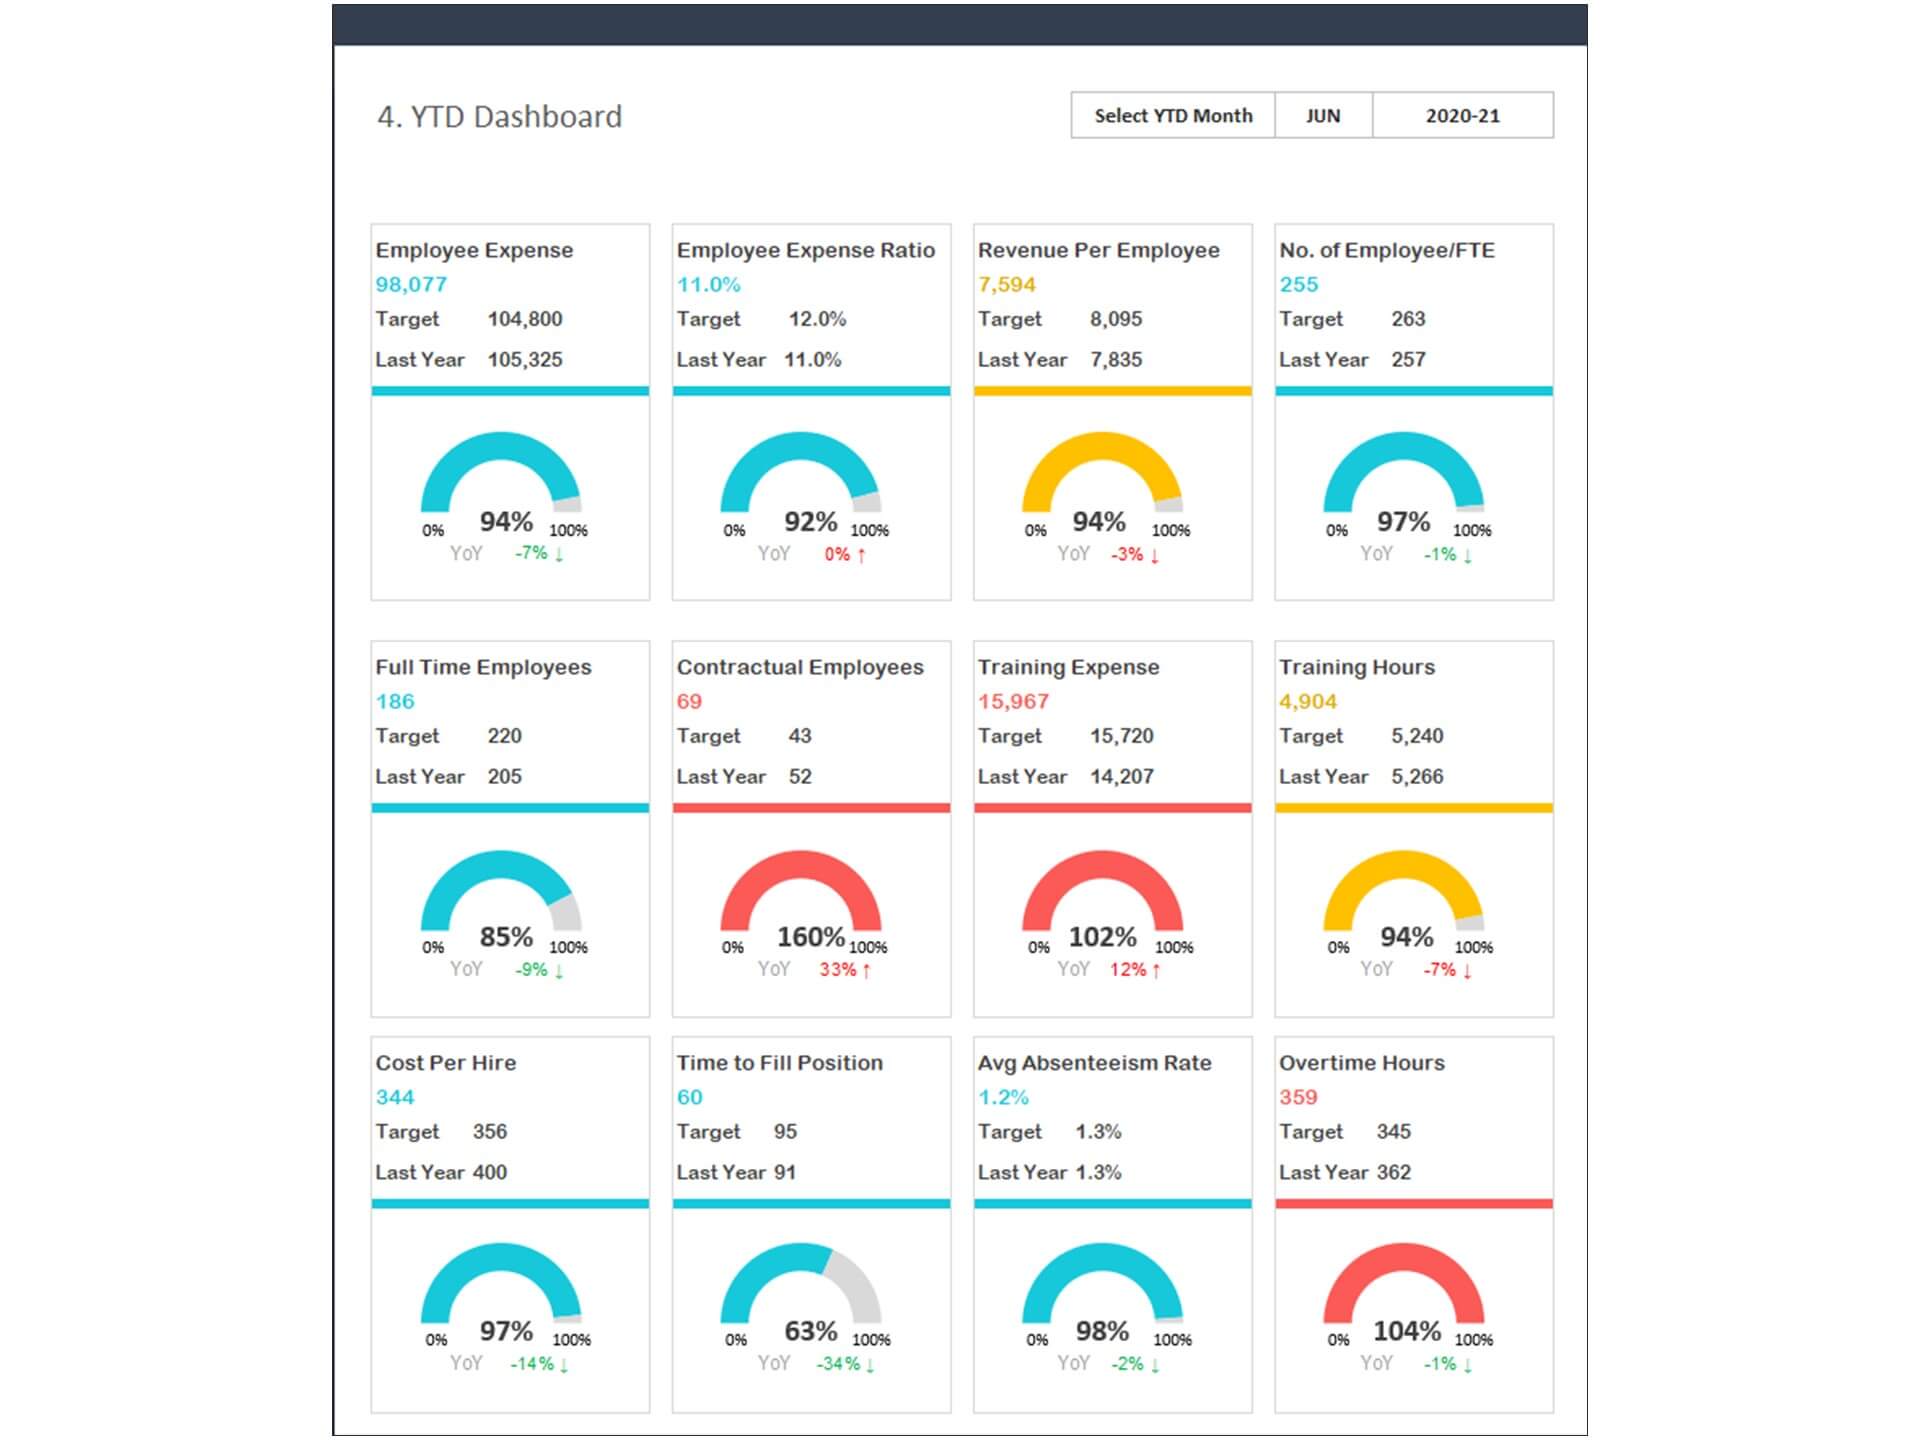
- Monitor HR Diversity indicators progress monthly
- Provide actionable insights
- Fully editable, easy to use, template with sample data
- Eye-catching design and customizable
- Change the sample data with your data
- Spreadsheets ready for printing without Biz Infograph logo
- Consolidate key business performance indicators in one dashboard
- No monthly fees
- Immediate download
- No VBA, no Macro
- No installation necessary
- Professionally designed
What is included in this dashboard template?
- Ready dashboard just plug your data and start using. The dashboard will be ready instantly.
- A guide to unlocking all the elements in the dashboard
Professional Support:
- Video tutorial guide on how to navigate and use each Dashboard Template
- Professional service to customize dashboard template in excel as per business need
- Help and support in post-purchase
- Payment secured by Stripe and PayPal (no PayPal account needed)
A brief guide to using the dashboard template:
- Open the dashboard template
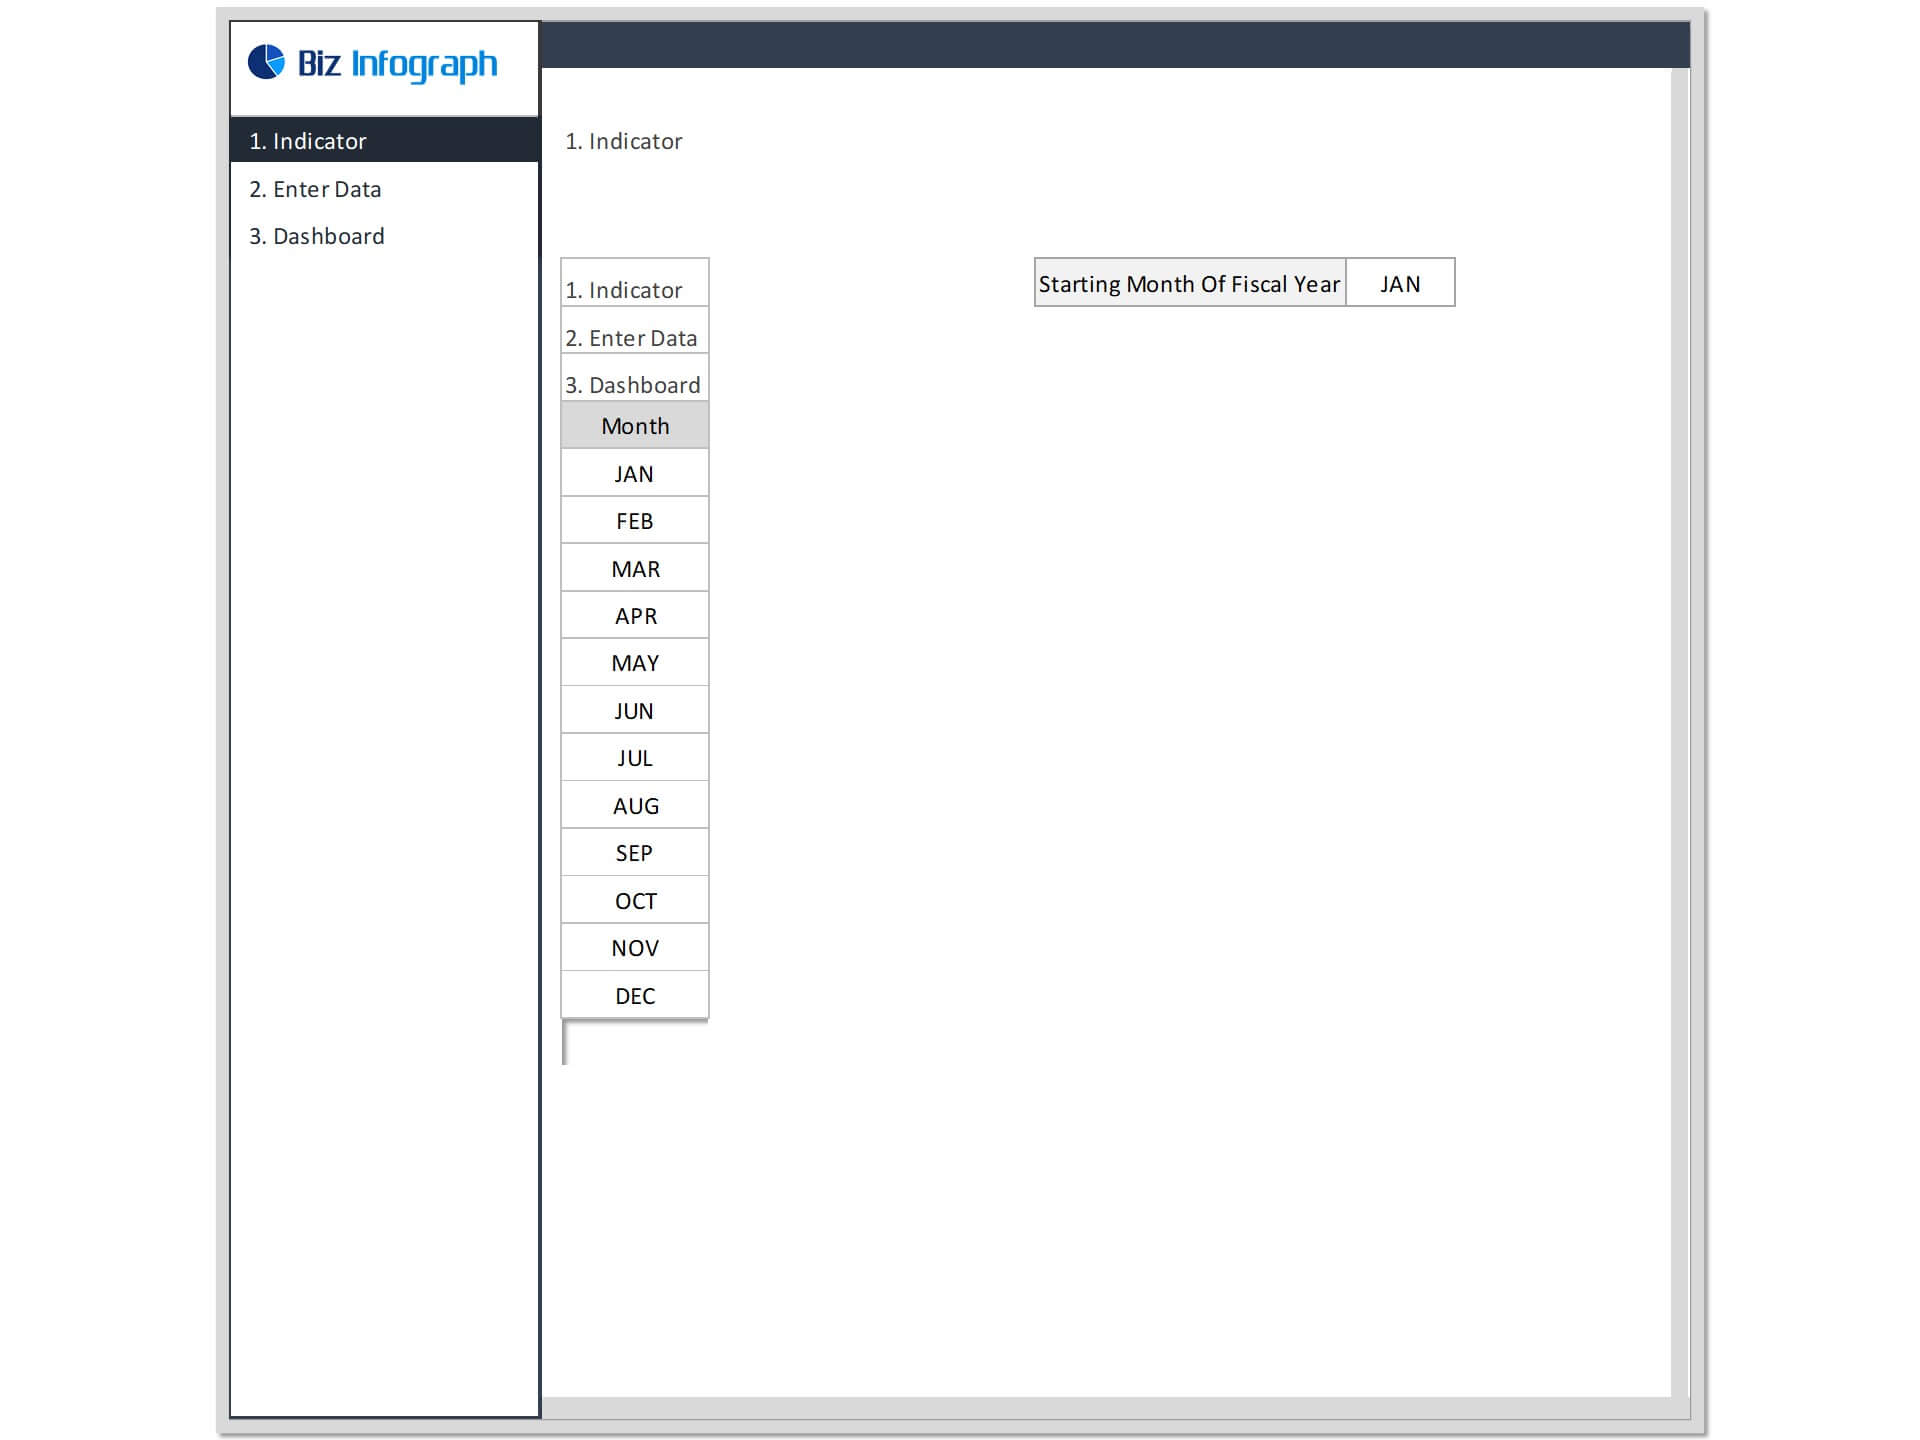
- Go to ‘Indicators’ menu – choose the start month of the fiscal year (i.e. Jan, Feb, Jul, etc.)
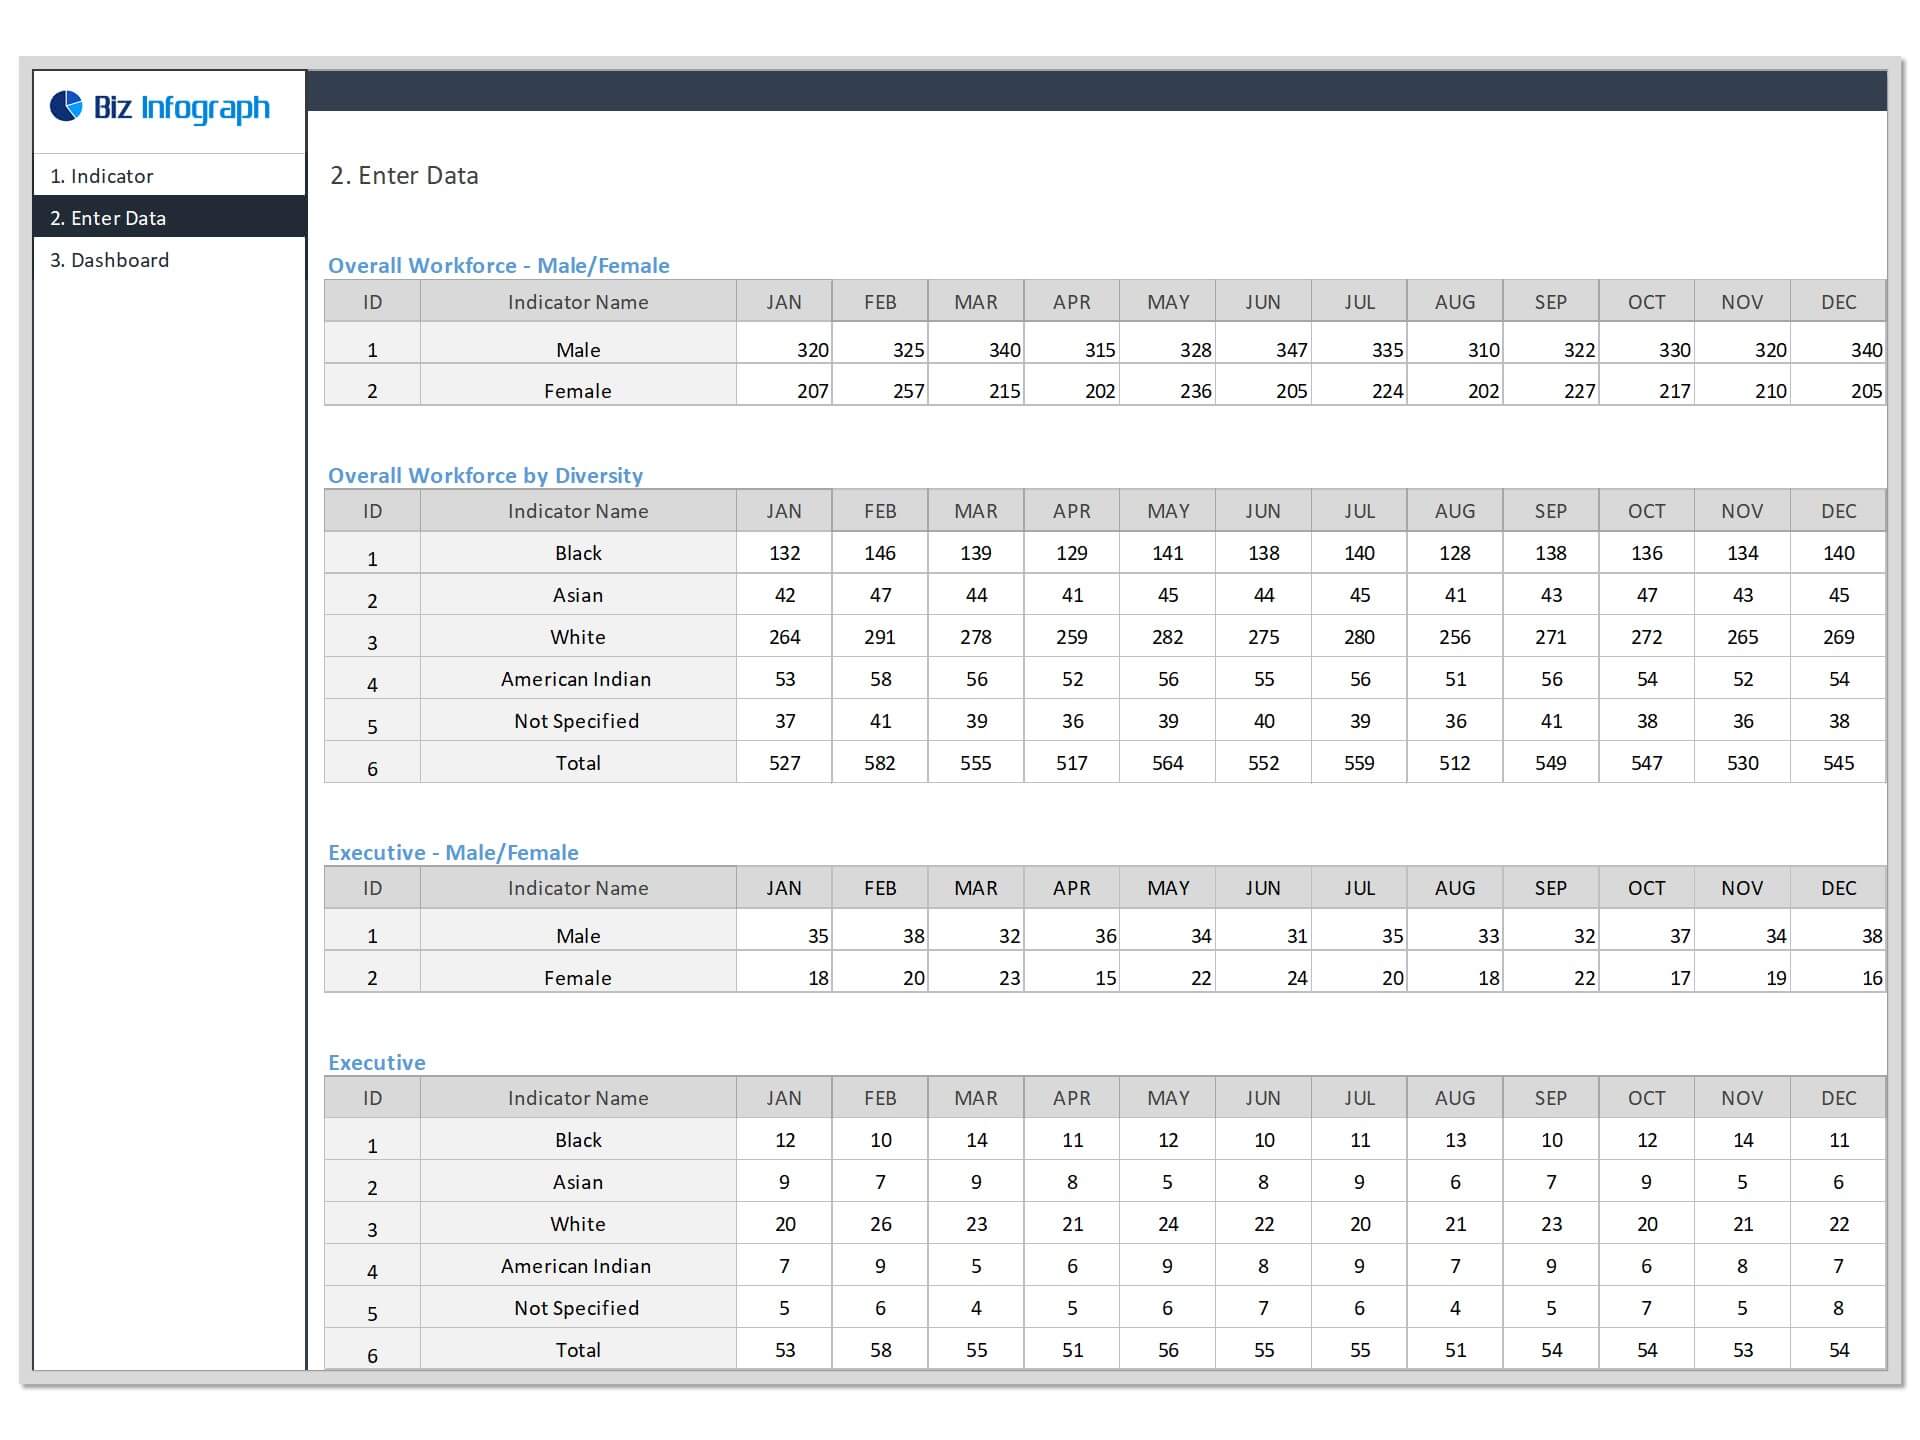
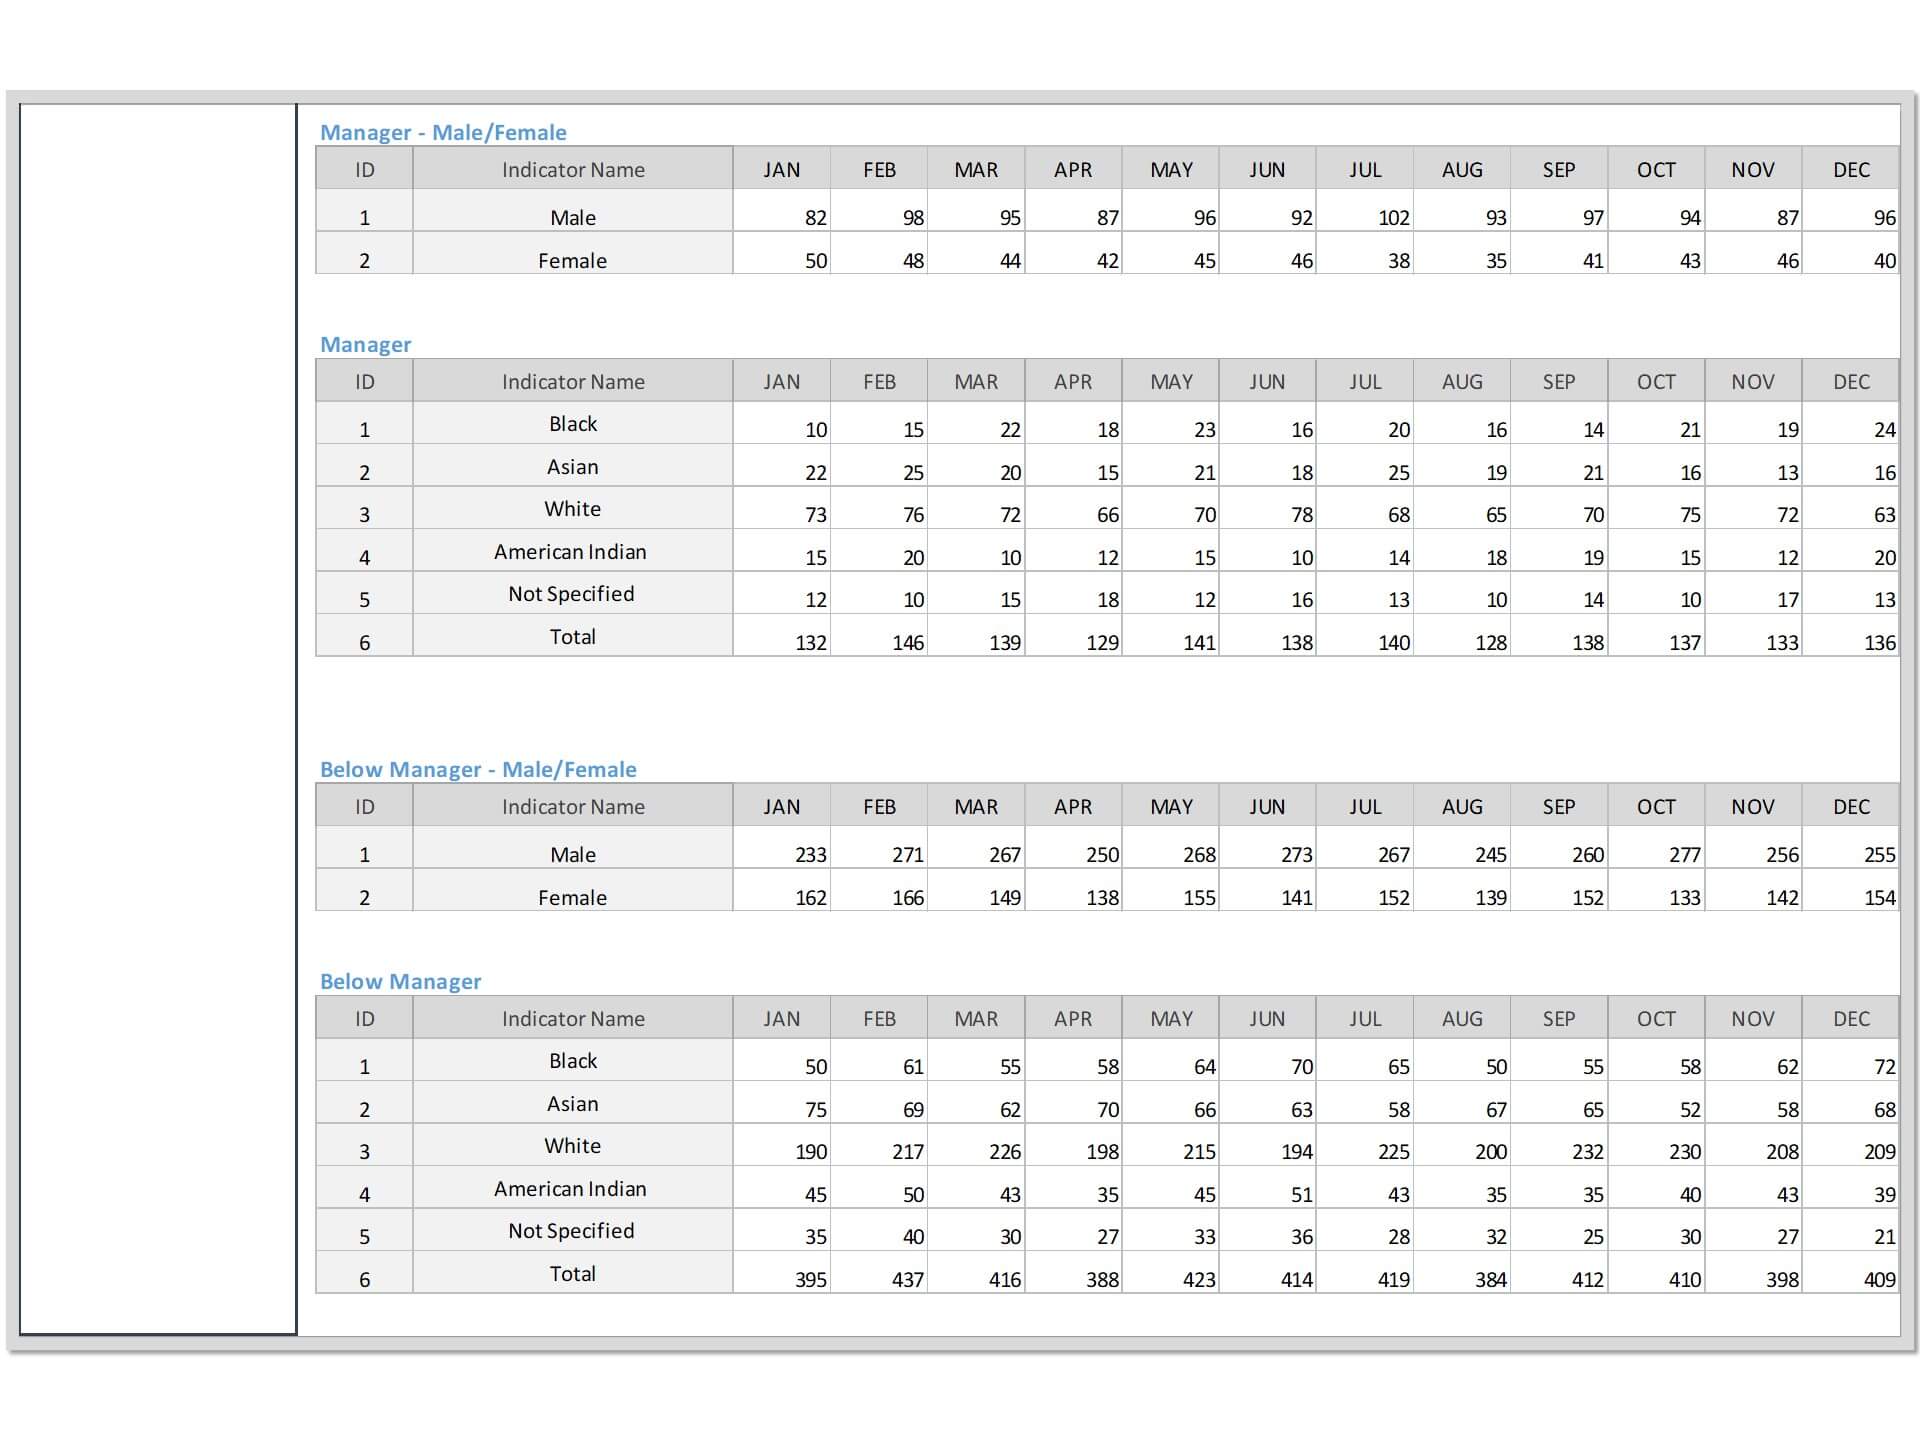
- Go to the ‘Enter Data’ menu – remove the sample data and give your actual data in the respective cells. Formula cells are locked, and you cannot edit it without a password.
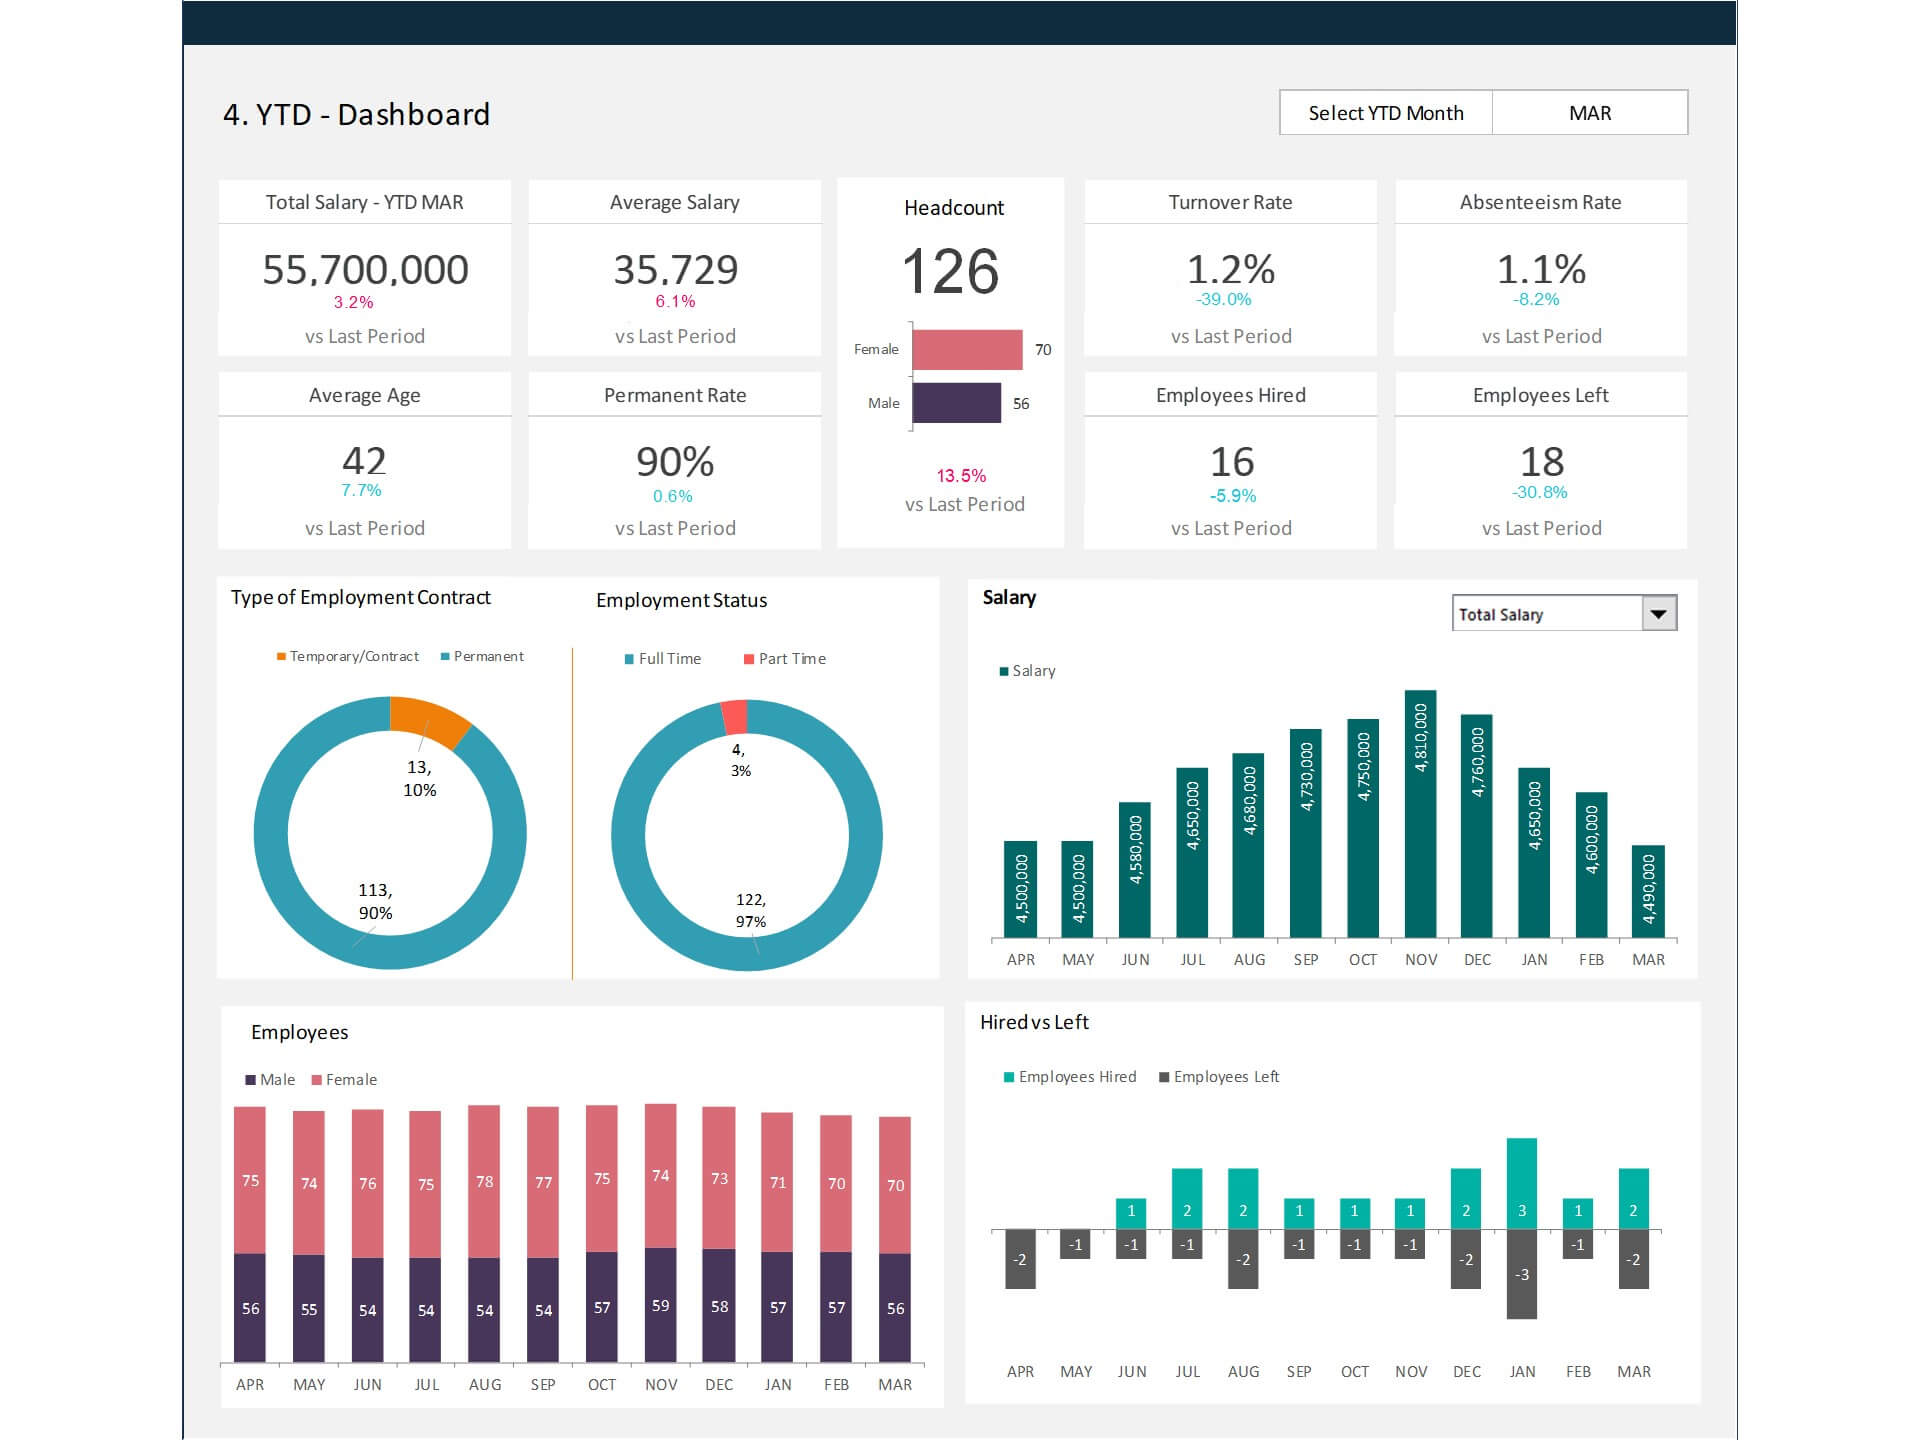
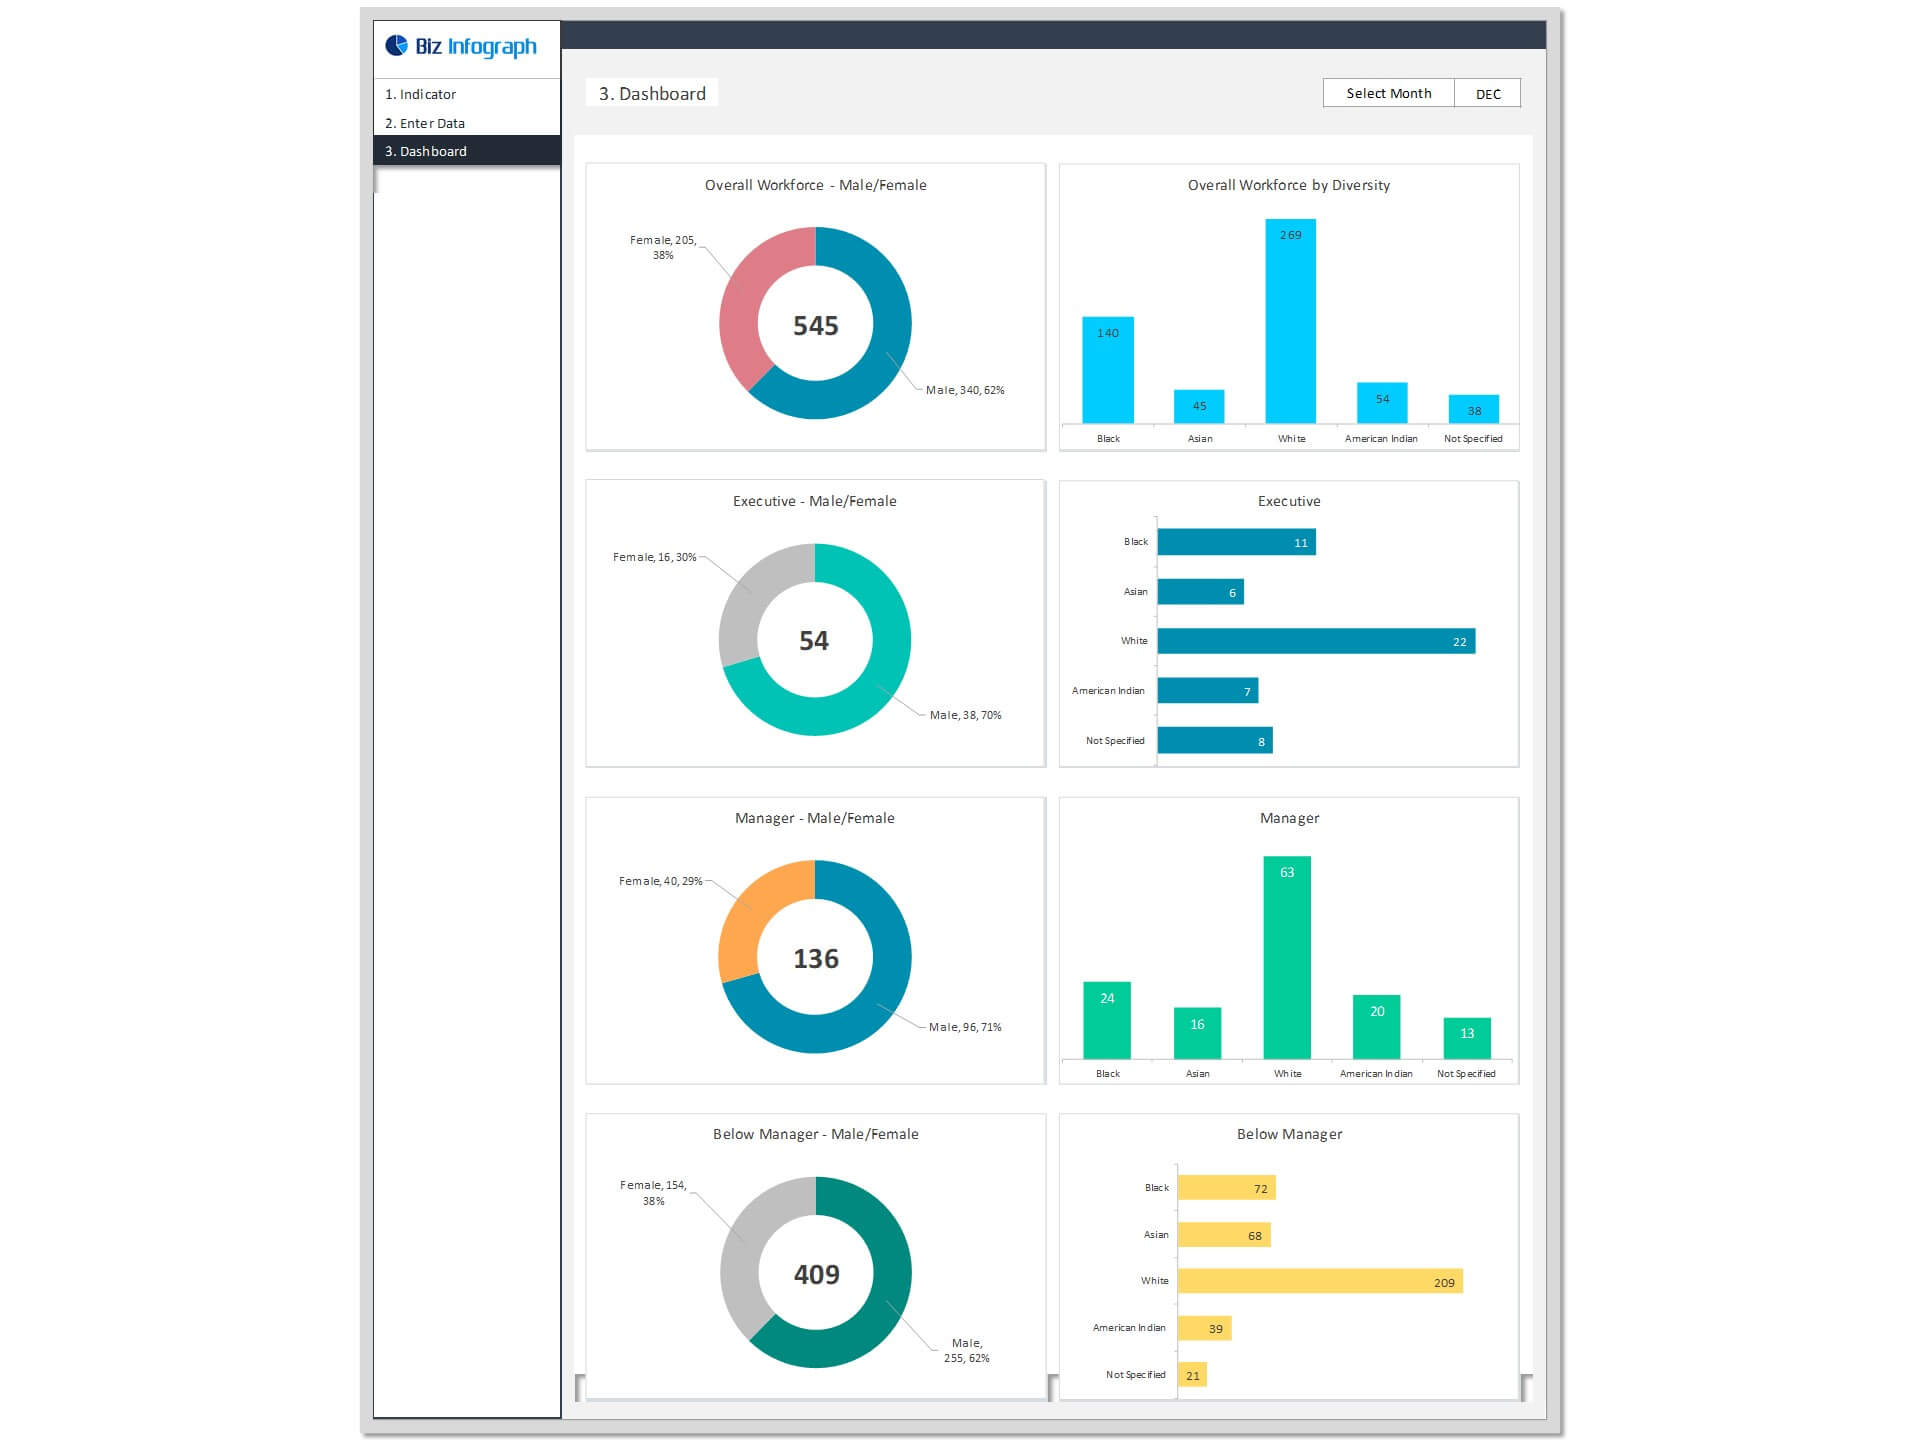
- Go to ‘Dashboard’ menu - select month name from the drop-down to see the year-to-date picture of performance indicators
- Each page is ready for printing – just press CTRL+P
You may also be interested in:
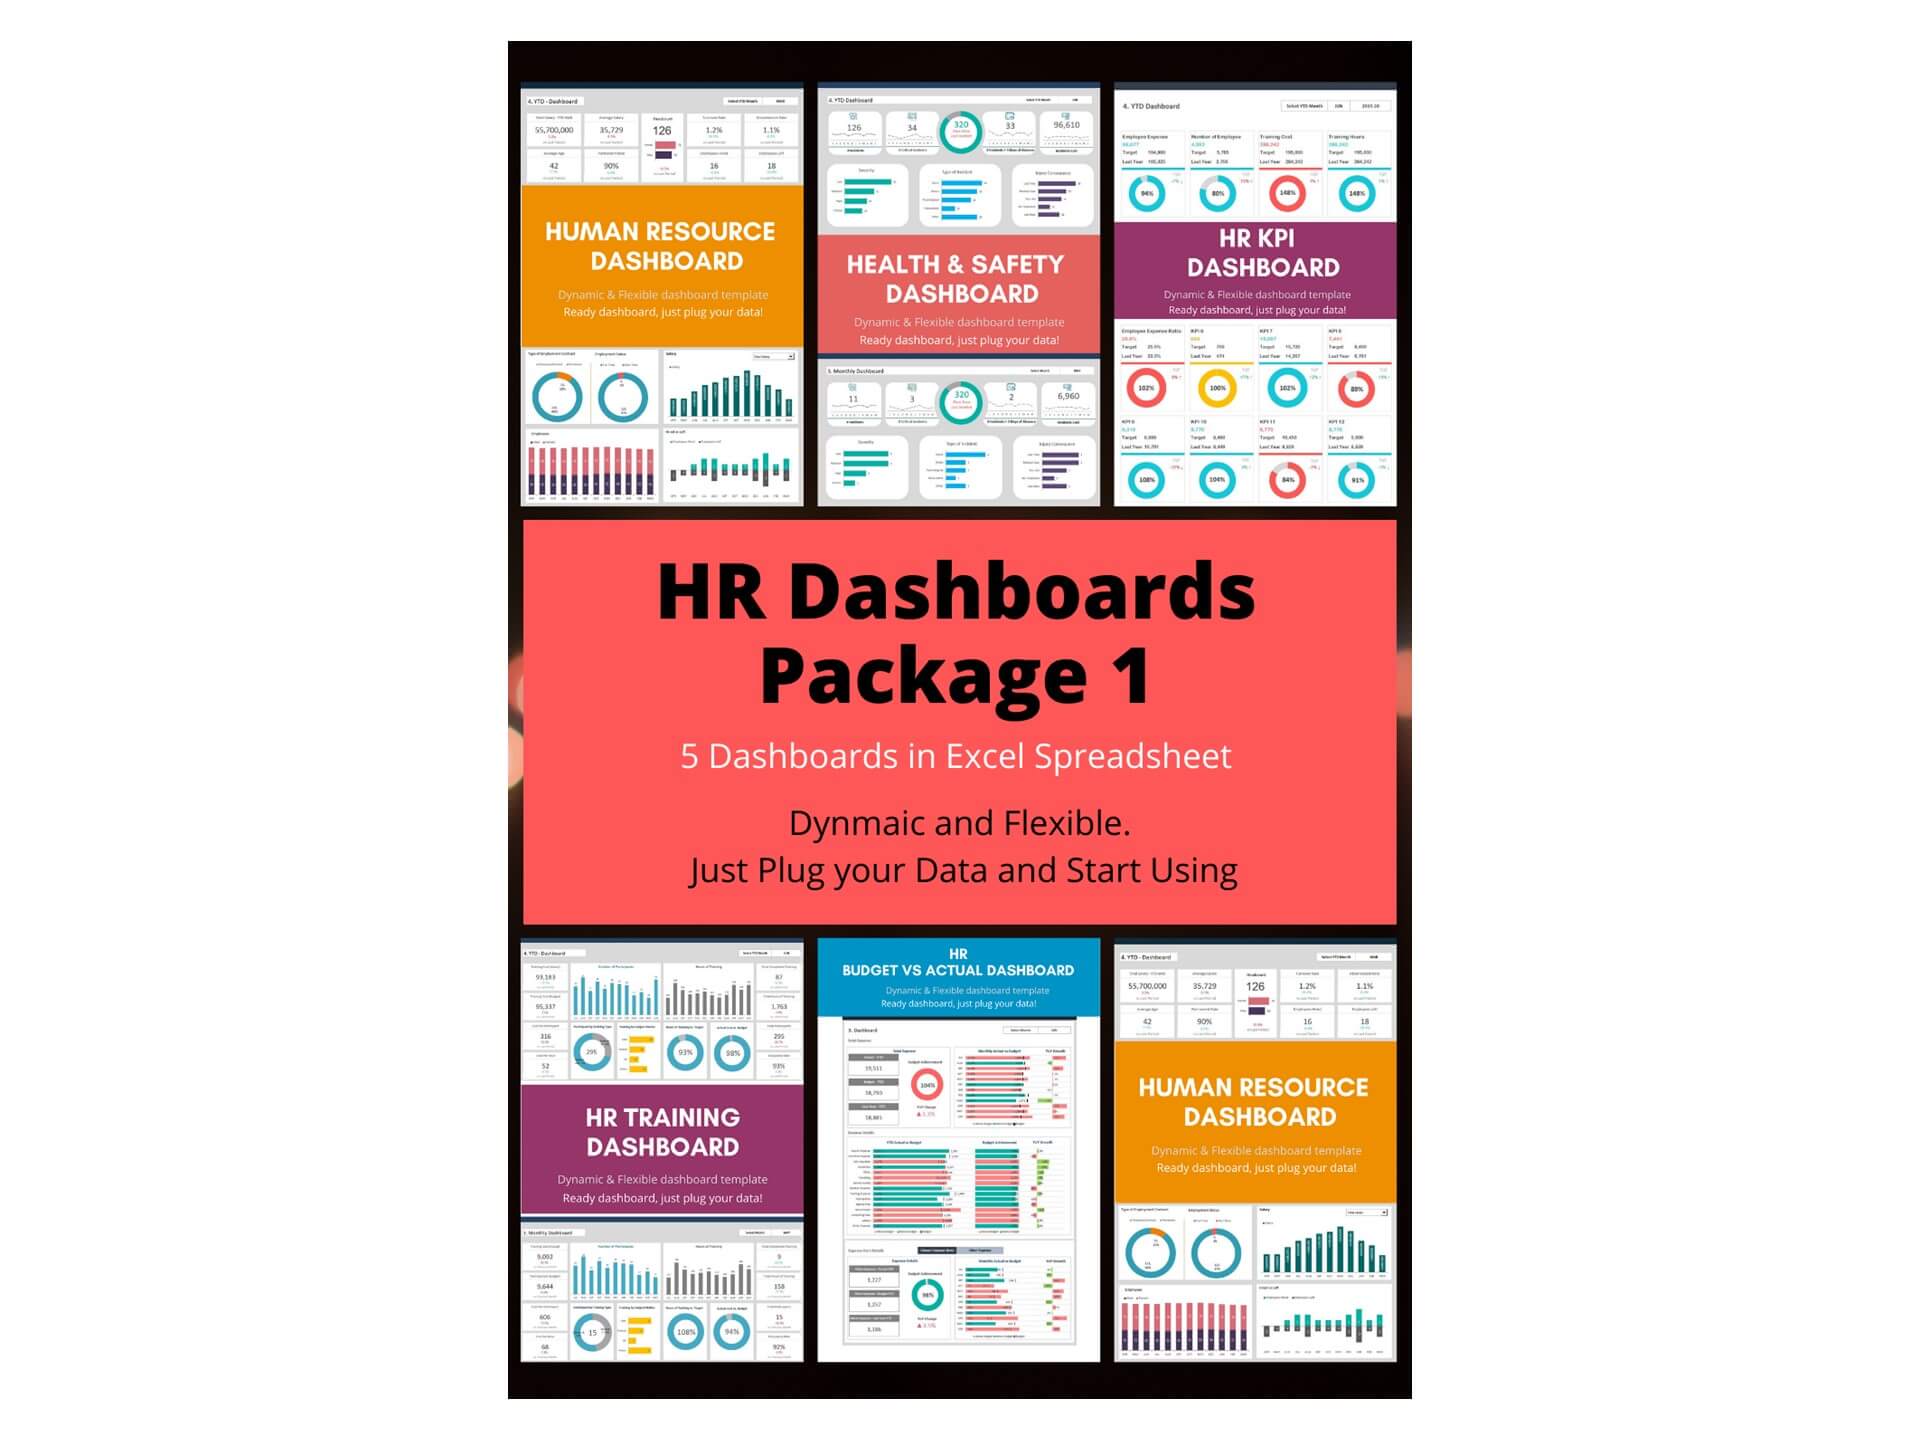
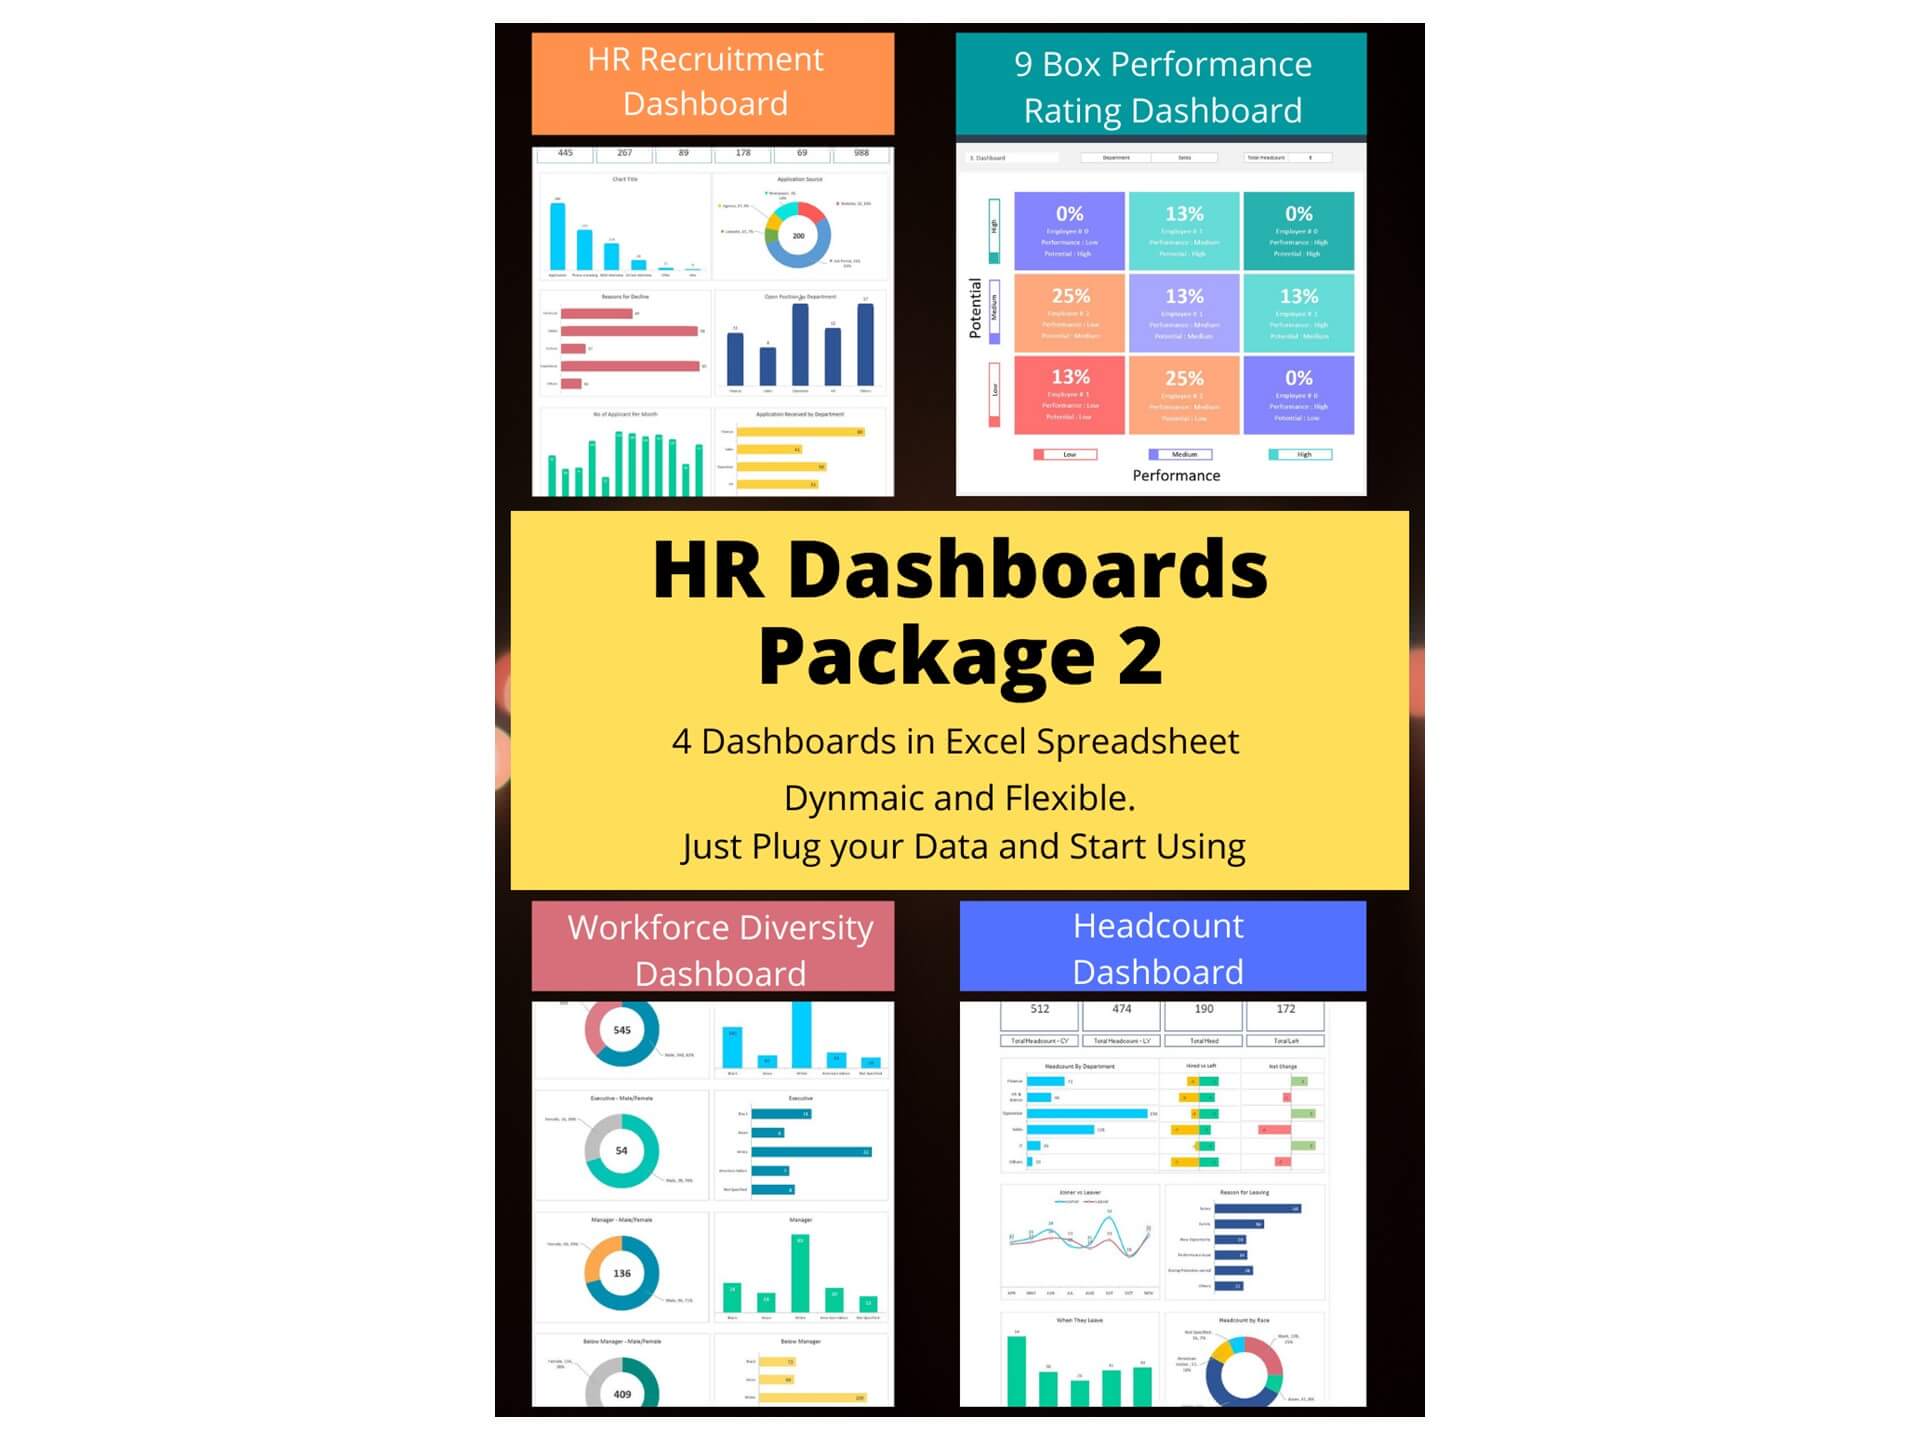
- HR Dashboard Package
- HR Metrics Dashboard
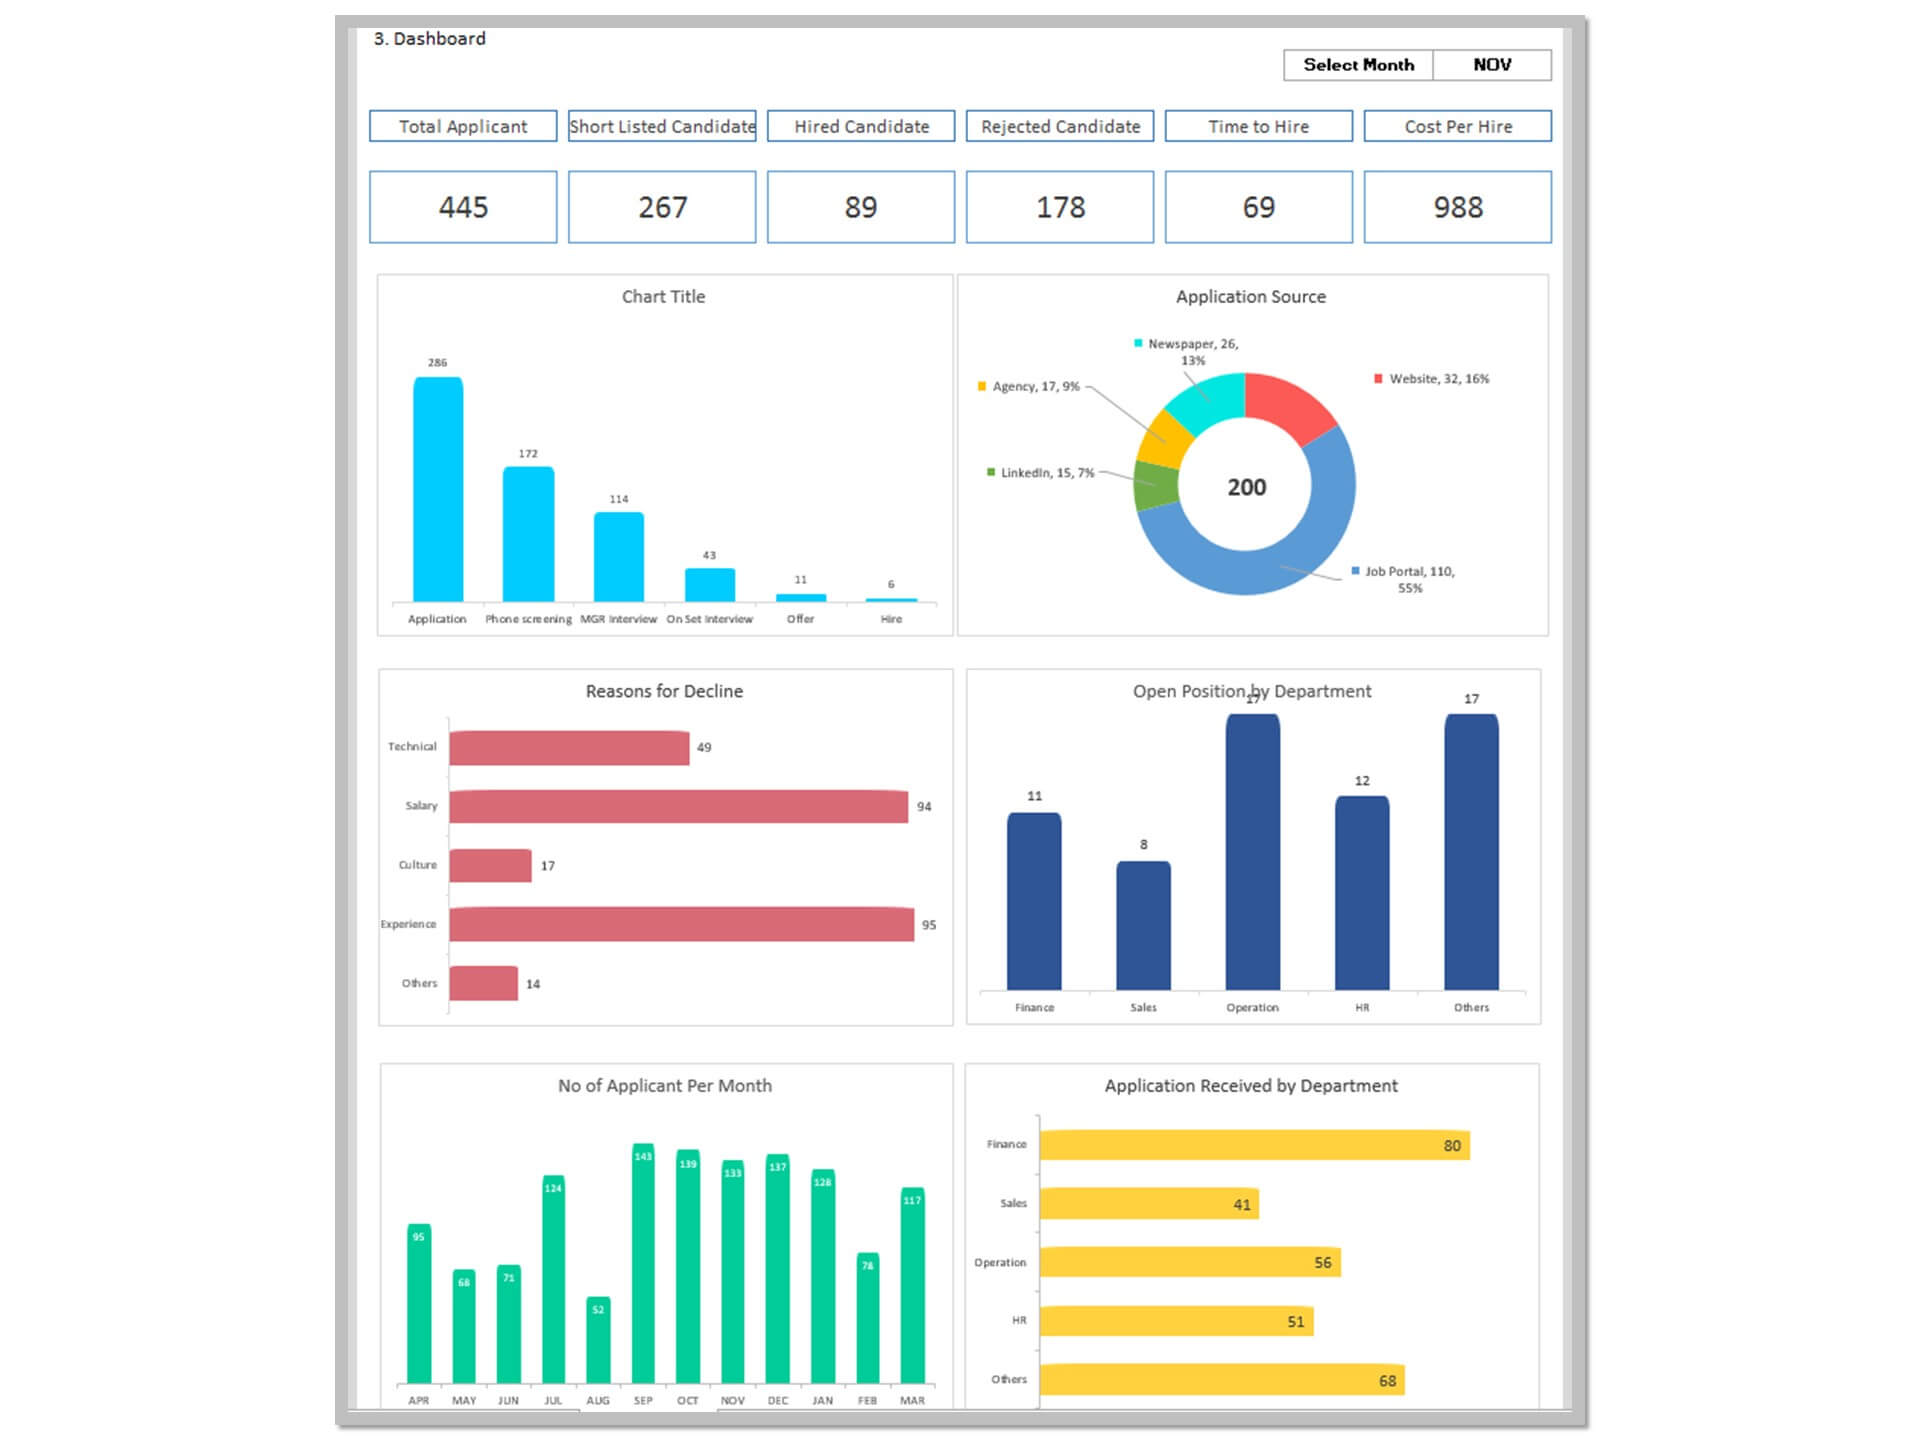
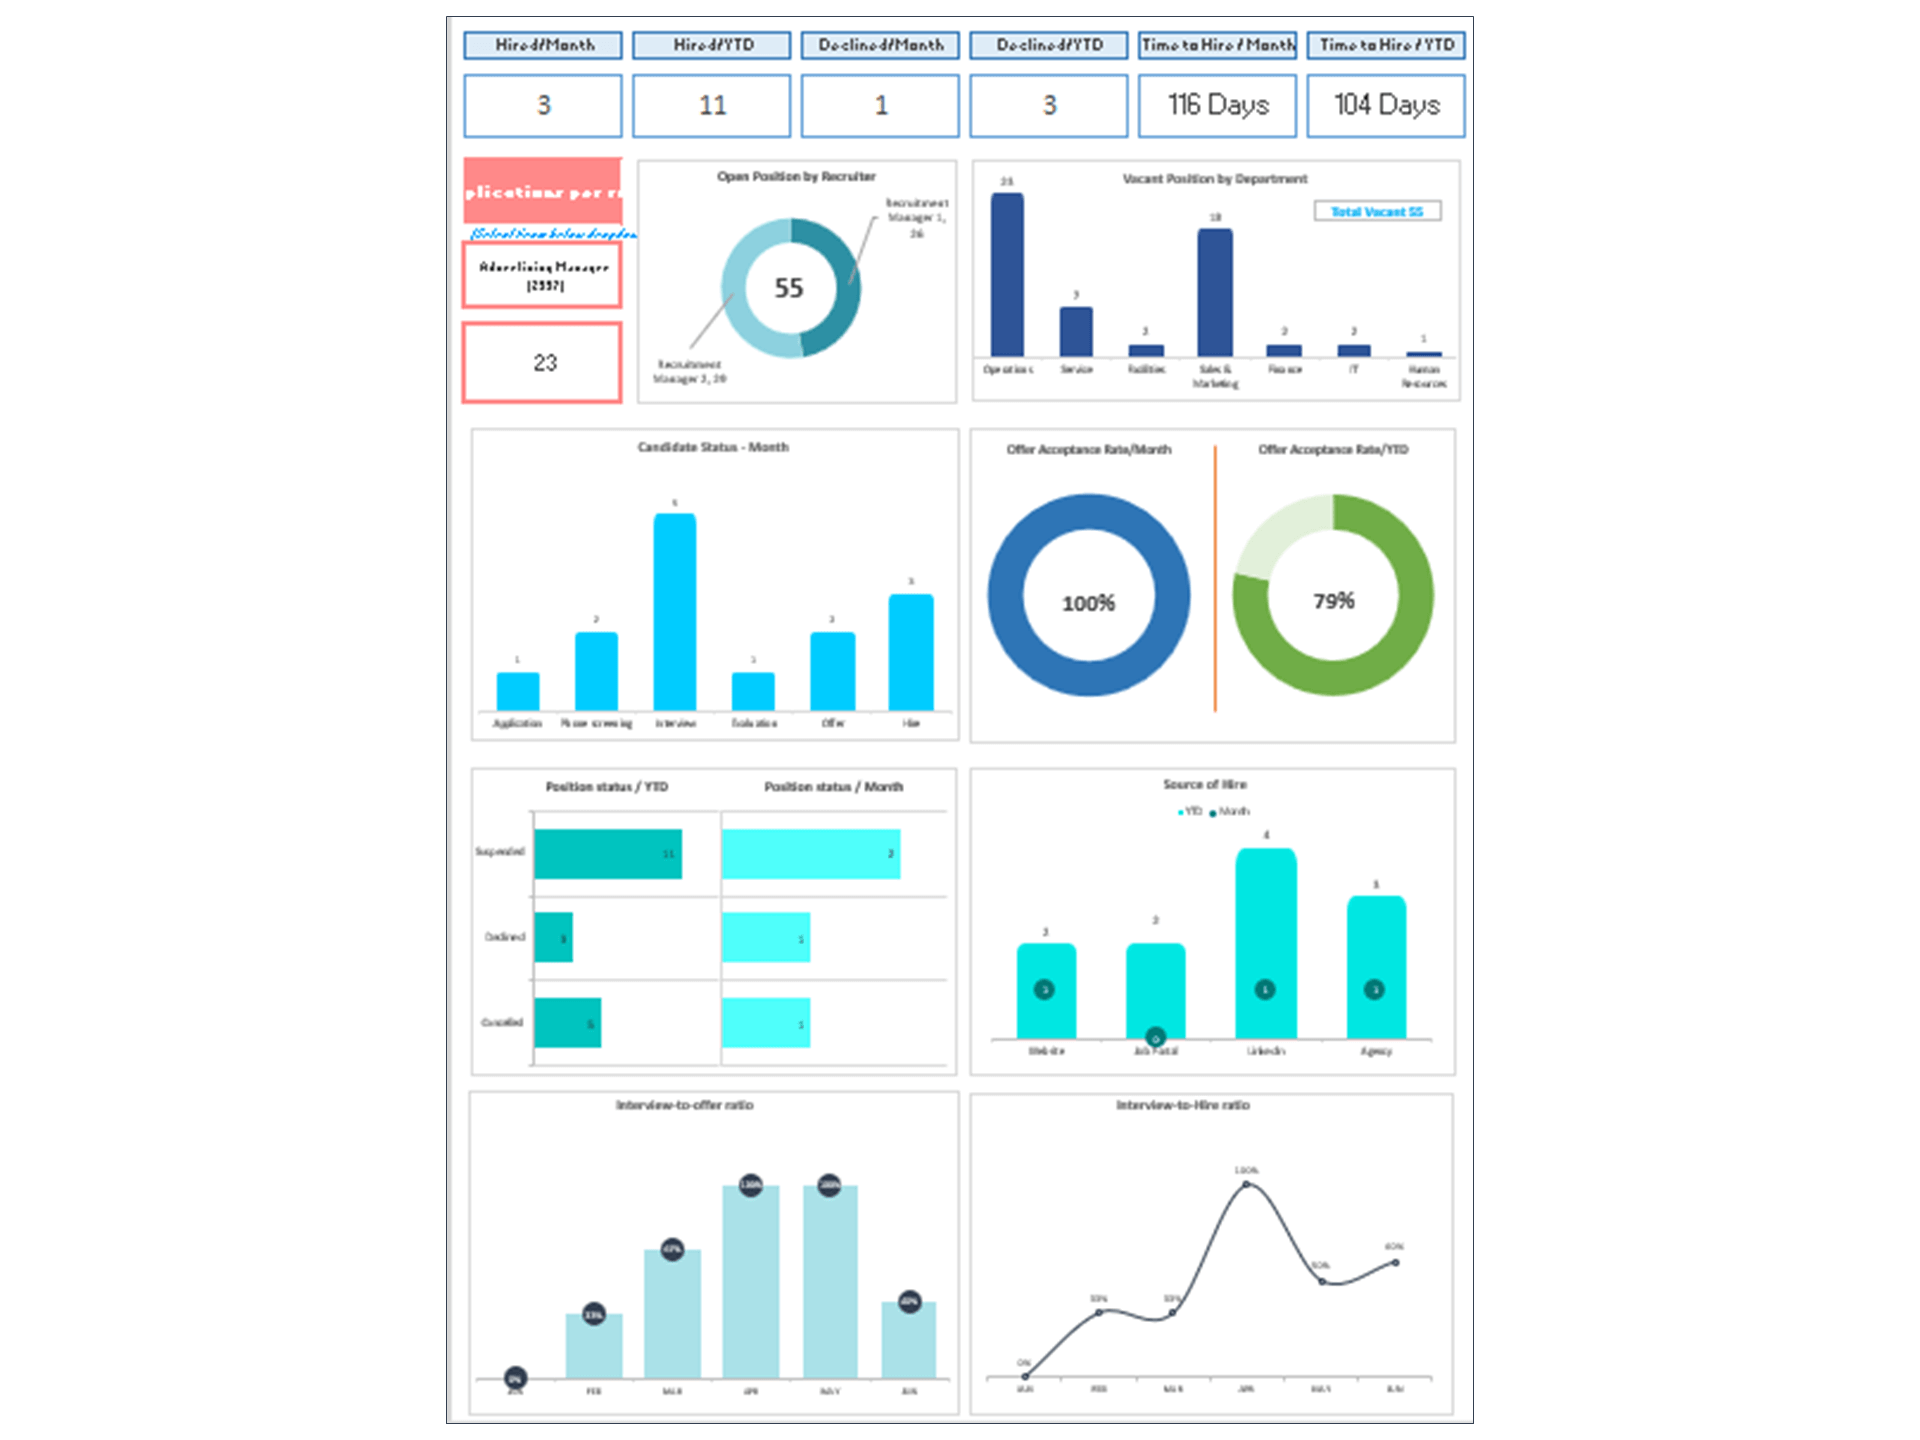
- HR KPI Dashboard
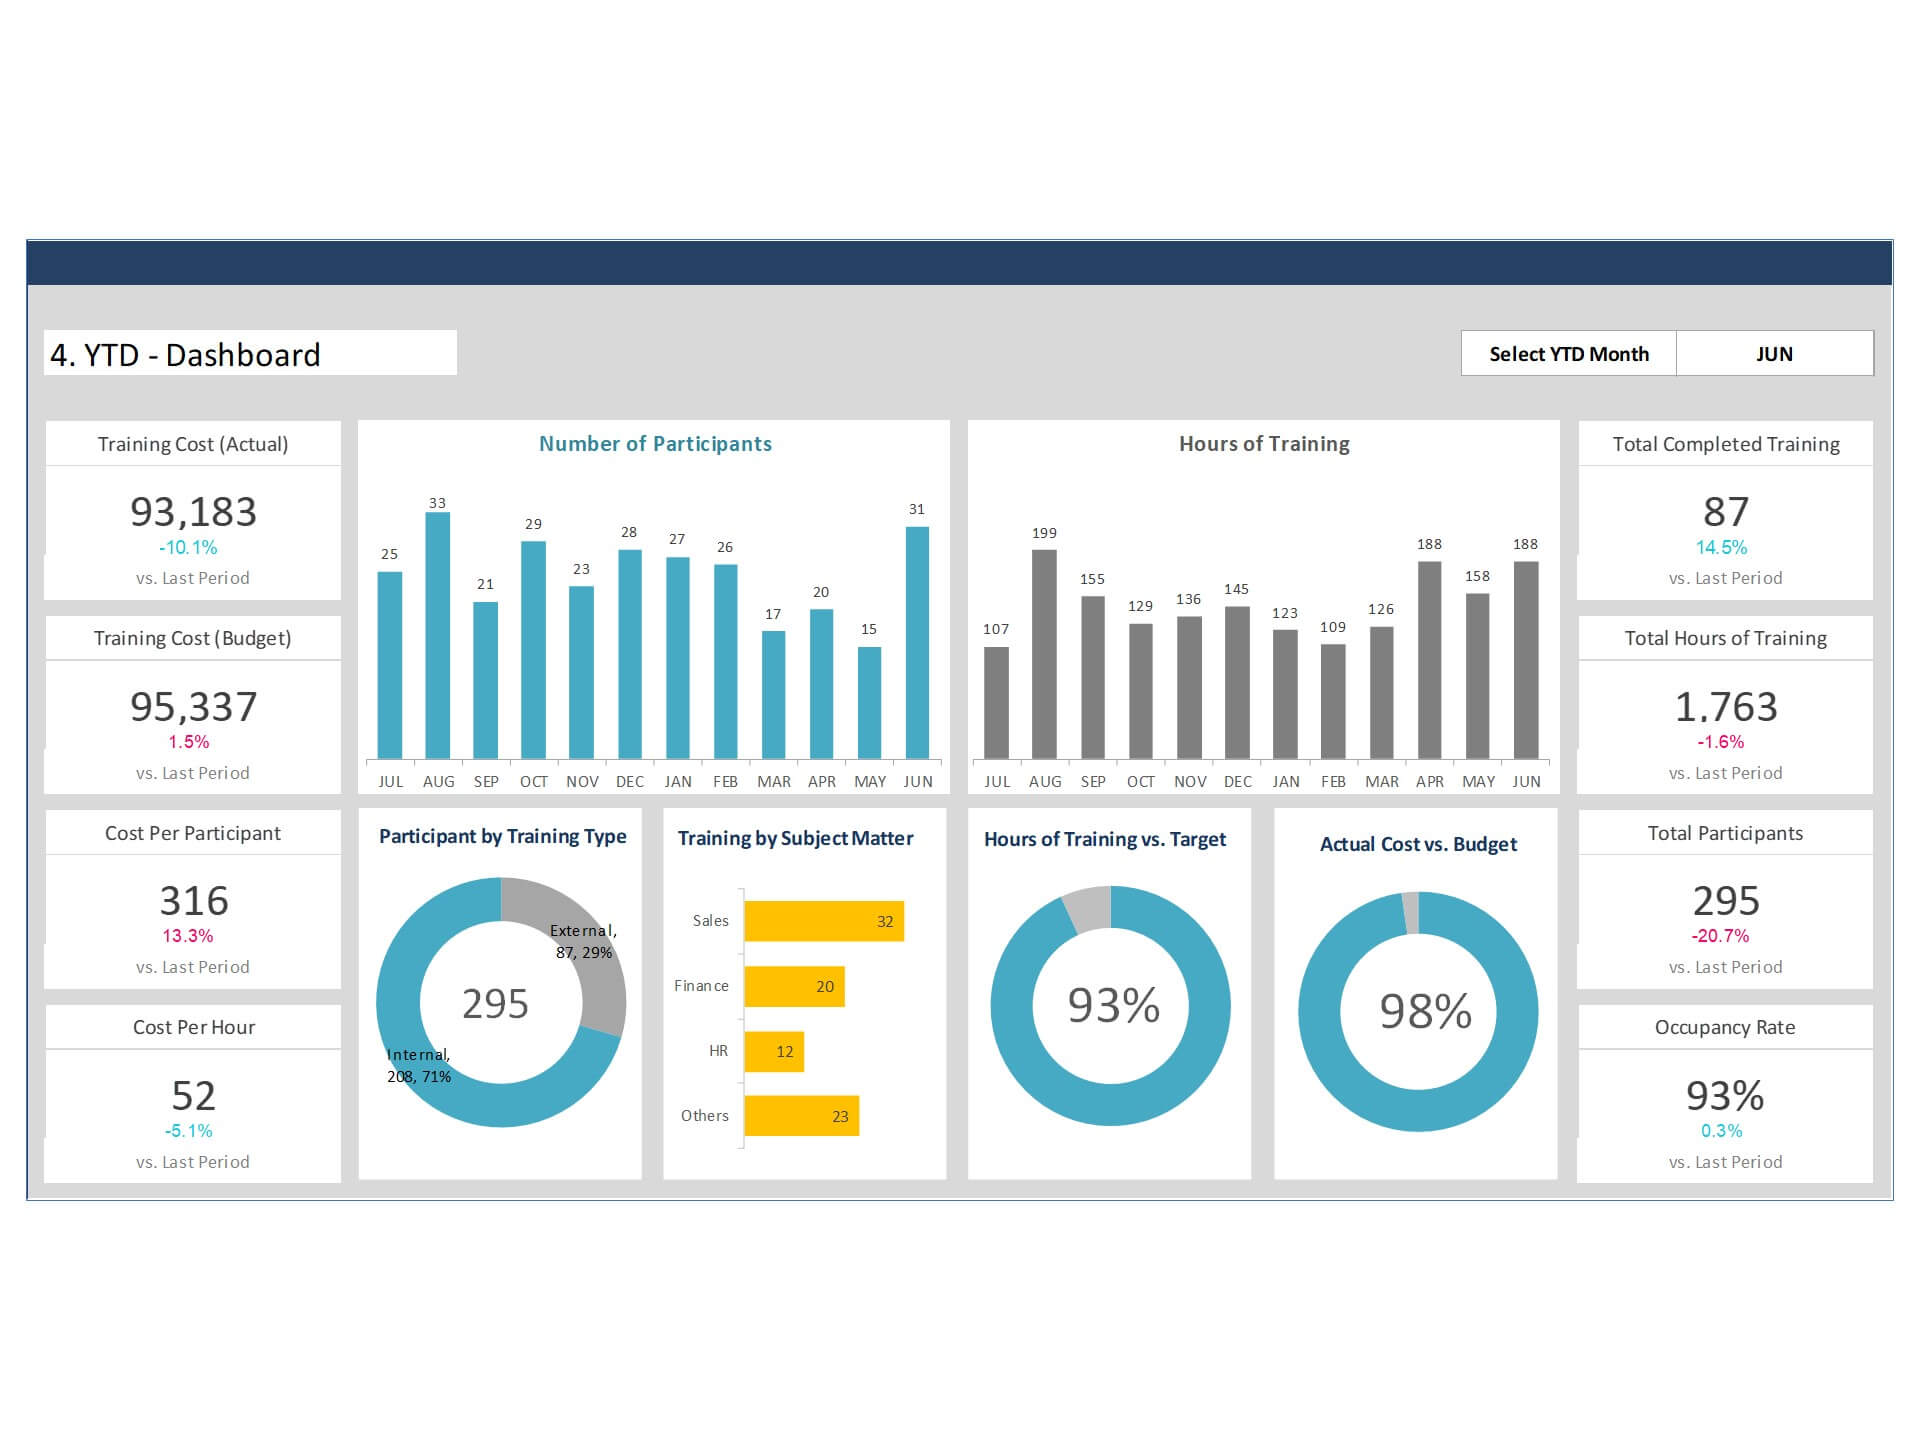
- HR Training Dashboard
- HR Headcount Dashboard