ANOVA in Excel empowers users to conduct comprehensive statistical analysis with ease and precision. Whether you’re comparing means across multiple groups, analyzing experimental data, or assessing variance between variables, ANOVA in Excel provides a robust framework for extracting valuable insights. With intuitive tools and functionalities, ANOVA in Excel streamlines the analysis process, allowing researchers, analysts, and students to uncover meaningful patterns and relationships within their data. Say goodbye to complex statistical software and hello to the convenience of conducting ANOVA directly within Excel. From hypothesis testing to model validation, ANOVA in Excel offers a versatile solution for a wide range of analytical tasks. Elevate your data analysis capabilities and make informed decisions with the power of ANOVA in Excel at your fingertips. Explore the depths of your data and unlock new perspectives with this indispensable feature, transforming your Excel spreadsheets into powerful tools for statistical exploration and discovery.
This Content Covers:
2.1 Add Analysis ToolPak
2.2 Use Anova from Data Analysis Dialogue Box
4.1 Two-Factor with Replication
4.2 Two-Factor Without Replication
1. What is ANOVA?
ANOVA in Excel is a statistical method that is used to test the difference between two or more means. It stands for Analysis of Variance. The ANOVA in Microsoft Excel is a statistical procedure that determines whether the mean values of two or more independent groups differ substantially from one another. It compares several average outcomes to determine the effect of one or more factors. It is the single and two-factor method used to perform the null hypothesis test. It is used to determine if the test will be PASSED for the Null Hypothesis if all the population values are exactly equal. The null hypothesis will fail if any, or at least one, value differs from the other values.
2. How to use ANOVA in Excel?
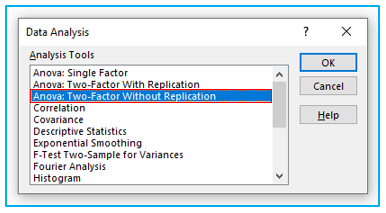
To find and use ANOVA in Excel, first you need to add Analysis Toolpak in your Excel Add-ins. Then use Anova from Data Analysis dialogue box.
2.1 Add Analysis ToolPak
Follow the steps below to add Analysis Toolpak in your Excel Add-ins.
Step 1: Right click on the ribbon section and select Customize the Ribbon option.

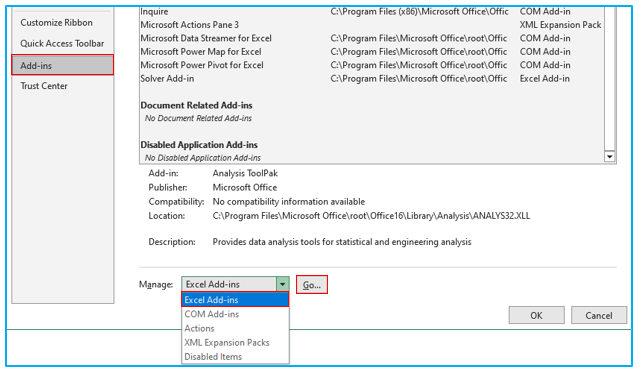
Step 2: From Excel Options dialogue box, go to Add-ins tab and select Excel Add-ins from the Manage section. Then press GO.
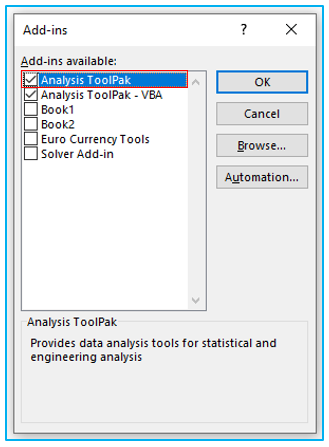
Step 3: Check Analysis ToolPak box inside Add-ins dialogue box and press OK.
2.2 Use Anova from Data Analysis Dialogue Box
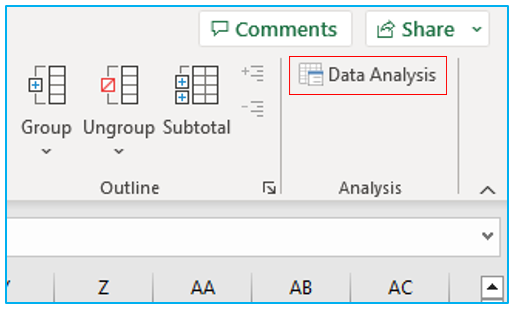
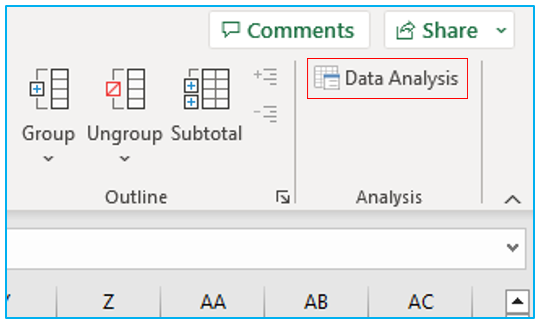
Step 1: After adding Analysis ToolPak in your Excel sheet, go to the Data tab and look for Data Analysis option in the Analysis section. Click on it to option to open Data Analysis dialogue box.
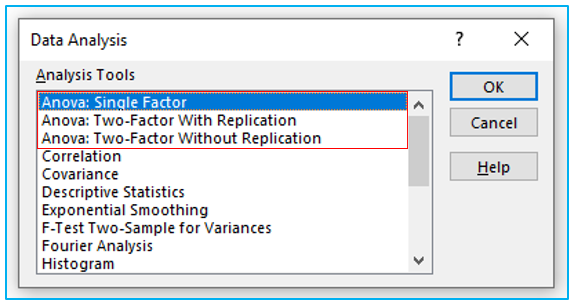
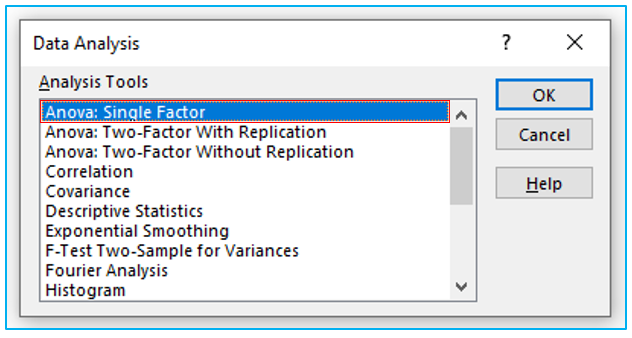
Step 2: Data Analysis dialogue box will open where you can see the different Anova options. You can use Anova from here.
3. How to Do One Way ANOVA Test In Excel?
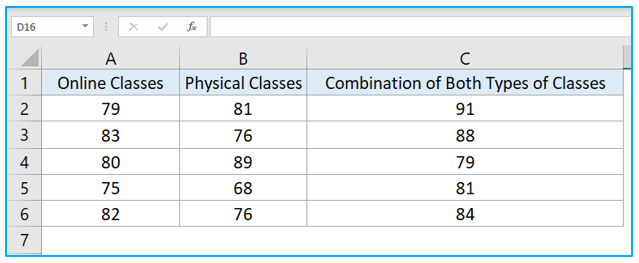
Let’s say we have the test results of a few students who attended classes in person, online, and in both of these settings. We will now compare the dataset’s mean values and see if they vary using the one-way anova.
Step 1: Go to Data tab and click on Data Analysis option.
Step 2: Select Anova: Single Factor and press OK.
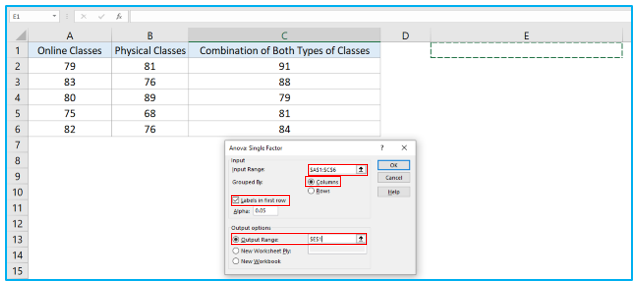
Step 3: Select the range inside Input Range box, check Labels in First Row box, make sure Columns is selected in Group By section. Select Output Range option and insert the location where you want the result to be displayed. Then press OK.
Step 4: Once you press OK you will get this output.
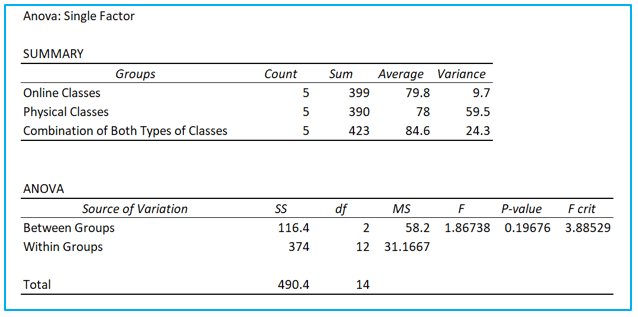
Analysis: To determine if we can reject the null hypothesis or not, we must check the F value along with P value. The F value alone is enough to reject the null analysis. If the F value is greater or bigger than F Crit value and the P value is smaller than Alpha Value (0.05), then we can reject the null hypothesis. In this single factor anova test, the F value is 1.86738 which is smaller than F Crit which is 3.88529. The P value 0.19676 is bigger than Alpha value 0.05. So, we cannot eliminate the null hypothesis that the mean values of the three datasets representing the three tests are not significantly different.
4. How to Do Two Way ANOVA Test In Excel?
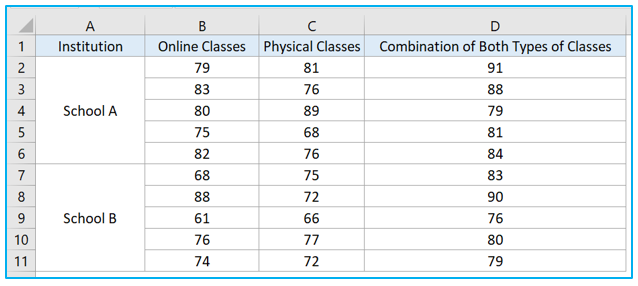
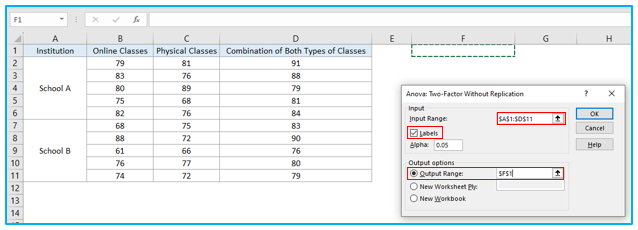
Here are the test results for some students who attended lessons in person, online, or in both formats. We also want to compare the performance of the two chosen schools. We will now compare the dataset’s mean values and see if they vary using a two-factor anova with and without replication.
4.1 Two-Factor with Replication
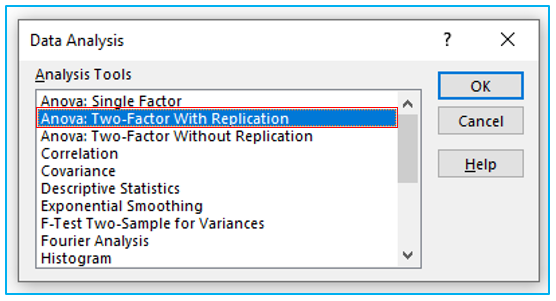
Step 1: Open the Data Analysis dialogue box from Data tab and select Anova: Two-Factor With Replication. Then press OK.
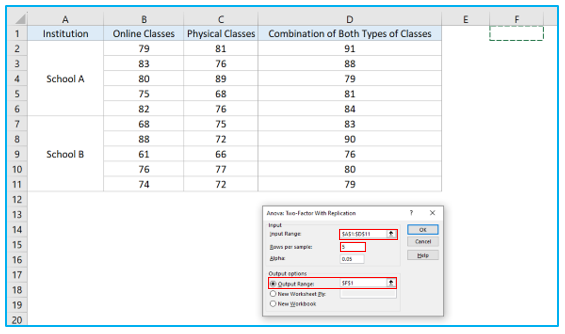
Step 2: Select the range inside Input Range box, type the number of rows between the schools inside Rows per sample box. Now select Output Range and press OK.
Step 3: You will get the result as soon as you press Enter.
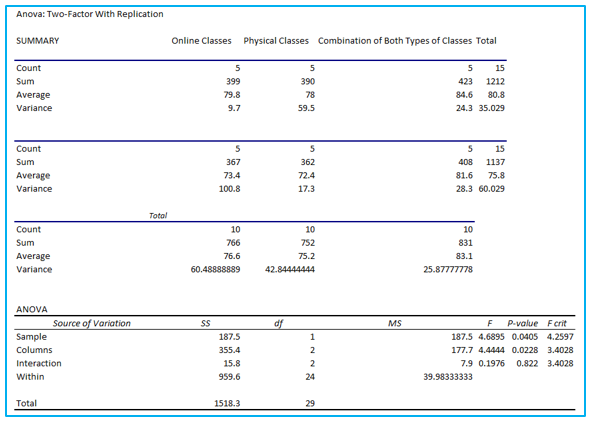
Analysis: To understand and determine if we can reject the null hypothesis or not, we have to look at the ANOVA section of this table and analyze the F value and P values. The Sample section here represents the Institutions (School A and School B), Columns section represents the three types of classes, and the Interaction section determines if there are any interactions between Sample and Columns.
- In the Sample section the F value is bigger than the F crit value and the P value is smaller than Alpha Value (0.05). So, we can reject the null hypothesis here and say that there is difference between the two schools.
- In the Columns section the F value is again bigger than F crit value and the P value is smaller than Alpha Value (0.05). So, we can reject the null hypothesis here again and say that there is significant difference in scores for the class types.
- In the Interaction section the F value is smaller than the F crit value and the P value is bigger than Alpha Value (0.05). Though we rejected the null hypothesis for the first two cases, we can’t reject it in this instance. This means that there is no interaction effect between Sample and Columns.
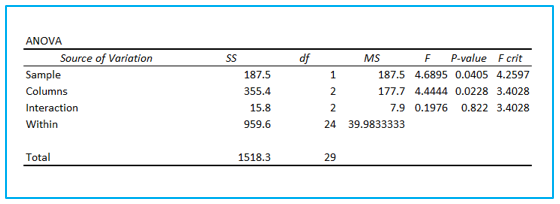
4.2 Two-Factor Without Replication
Step 1: Select ANOVA: Two-Factor Without Replication and press OK.
Step 2: Select the Input and Output Range, check Labels box and press OK.
Step 3: Observe the result.
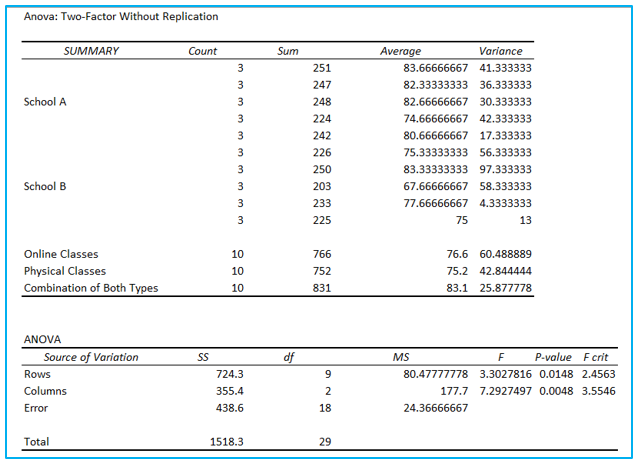
Analysis: For a two-way ANOVA test without replication, the test interpretation is identical; however, there won’t be any interaction data to analyze this time. The Rows section here represents the Institutions (School A and School B), Columns section represents the three types of classes.
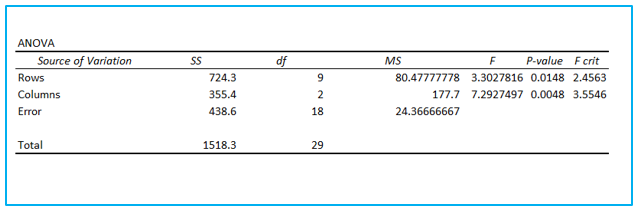
- In the Rows section the F value is bigger than the F crit value and the P value is smaller than Alpha Value (0.05). So, we can say that there is a significant difference between the two schools by rejecting the null hypothesis.
- In the Columns section the F value is bigger than the F crit value and the P value is smaller than Alpha Value (0.05). We can therefore declare that there is a substantial difference in scores for the various class types and reject the null hypothesis once more.
Application of ANOVA in Excel
- Comparing Means: ANOVA in Excel facilitates comparing means across multiple groups to determine if there are significant differences.
- Experimental Analysis: Analyze experimental data to assess the effects of different treatments or interventions using ANOVA in Excel.
- Variance Examination: Use ANOVA in Excel to examine variance between groups, helping identify factors that contribute to variability in the data.
- Quality Control: Employ ANOVA in Excel to evaluate the consistency and quality of manufacturing processes by comparing variations in product characteristics.
- Market Research: Conduct market research by analyzing survey responses or customer feedback with ANOVA in Excel to identify significant trends or preferences.
- Academic Research: Utilize ANOVA in Excel for academic research projects to analyze the impact of independent variables on dependent variables across different groups or conditions.
For ready-to-use Dashboard Templates:
