Transpose function in Excel is a powerful tool for switching the orientation of your data, converting rows into columns and vice versa. By using the “Transpose function,” you can easily rearrange large datasets, making them more manageable and better suited to your needs. Whether you’re working with financial reports, inventory lists, or survey data, this function can save you valuable time and effort. Understanding how to use the “Transpose function” effectively in Excel can significantly enhance your data analysis, making it a vital skill for Excel users in various fields.
- What is the Excel Transpose function?
- Excel TRANSPOSE function – syntax
- How to use the TRANSPOSE function in Excel
- Apply TRANSPOSE formula in Excel 365.
- Limitations for transpose function.
1. What is the Excel Transpose function?
Excel uses transpose to change the aspect of an array. It helps in arranging the raw data in the correct order as it converts vertical area to horizontal area and vice versa. Excel’s TRANSPOSE function is a built-in function that allows you to rotate or reorient a range of cells from row to column or vice versa. That is, convert horizontal data to vertical data and vice versa.
2. Excel TRANSPOSE function – syntax
=TRANSPOSE(array)
Array: Many types of cells can be transposed in. A range of cells, an array constant, or a reference to dozens of other cells are all possible options.
3. How to use the TRANSPOSE function in Excel?
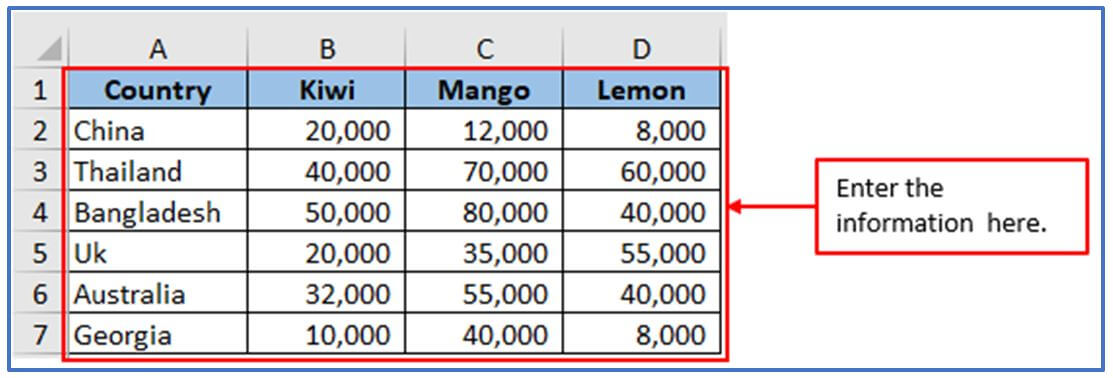
Step 1: Create a data table with the names of some Fruits names and country names as shown below. The first step is to check the number of columns and rows in your table. In the following stage, these numbers are necessary. This transposes table showing fresh fruit exports by county. There are 4 columns and 7 rows in the table.
You can see the names of the fruits along with the country are written down here.
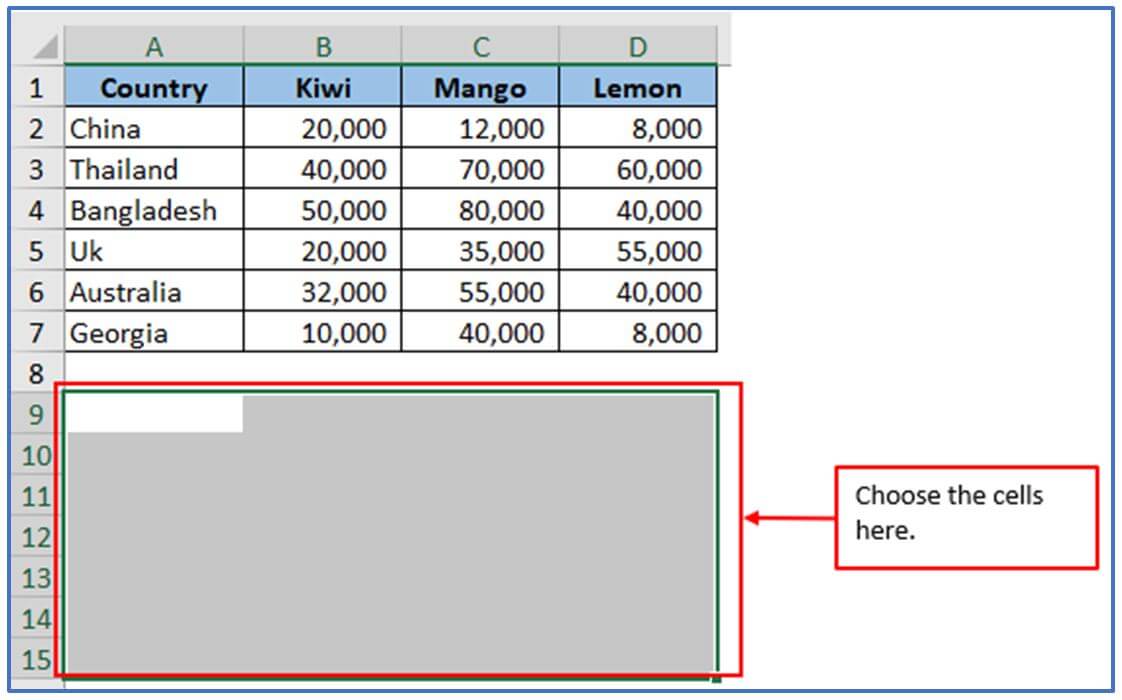
Step 2: The updated table displays the identical quantity of cells, but with the ability to rotate it from horizontal to vertical or vice versa. Choose from a selection of blank cells from A9:D15 that have an equivalent row-to-column ratio and number of columns to row in the original table. Here, the range is limited to 7 rows and 4 columns.
Here, the cells from A9:D15 has been chosen here.
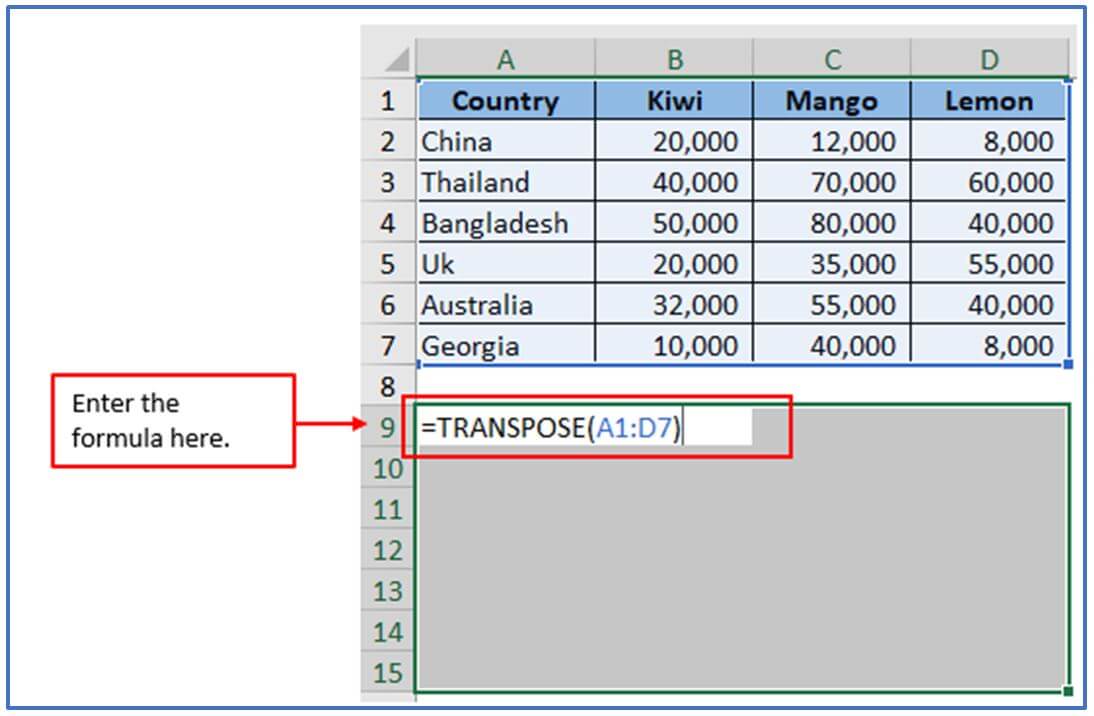
Step 3: To determine the transpose, enter the formula: =TRANSPOSE(A1: D7) by selecting a range of empty cells.
Added the formula here.
Step 4: After entering the formula don’t press enter because the formula is intended to be applied to multiple cells, and that’s all it does, press Ctrl + Shift + Enter to properly convert the array formula.
It ends when you press Ctrl+Shift+Enter, Excel wraps the transposed formula in {curly braces}. {} This appears in the formula bar and provides a visual reference to the array formula. Do not enter it manually under any circumstances. It doesn’t work.
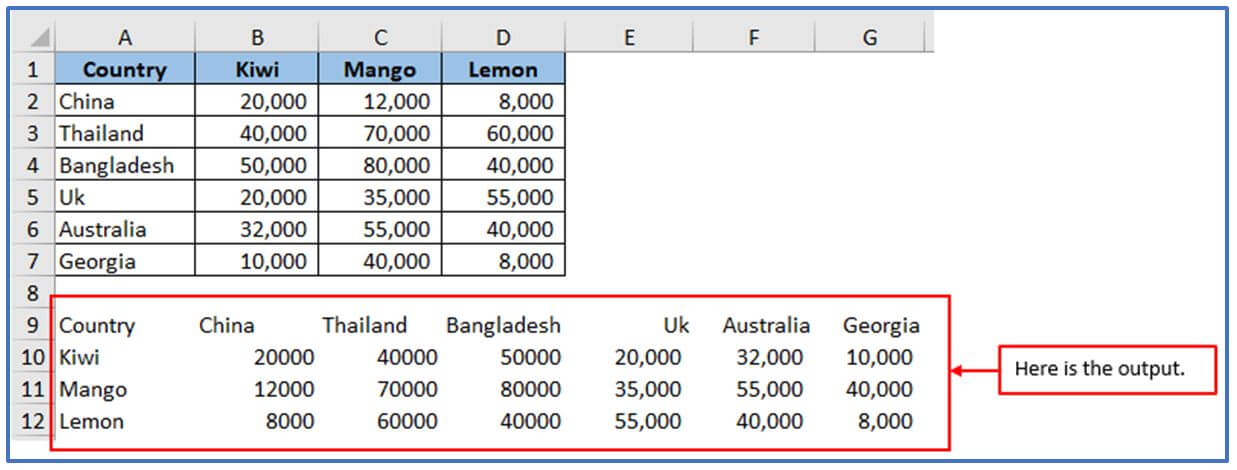
Below is a screenshot that shows how to convert the 4 columns into 7 rows after transposing the source table.
4. How to use TRANSPOSE formula in Excel 365?
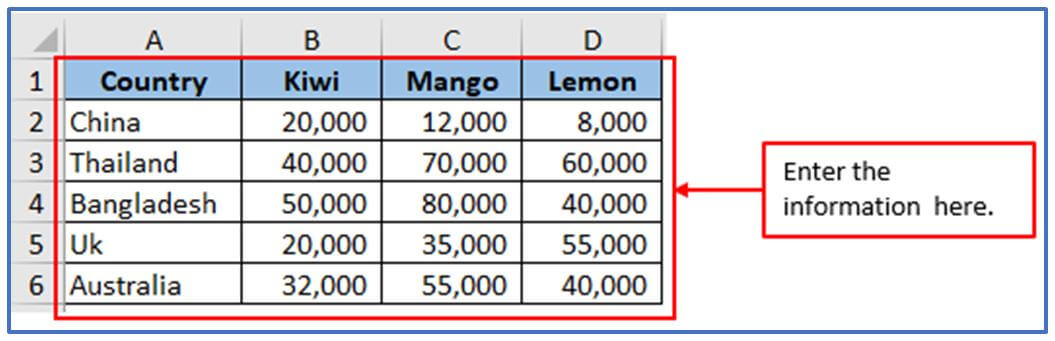
Step 1: Create a data table with the names of some Fruits names and country names as shown below.
Placed the information here.
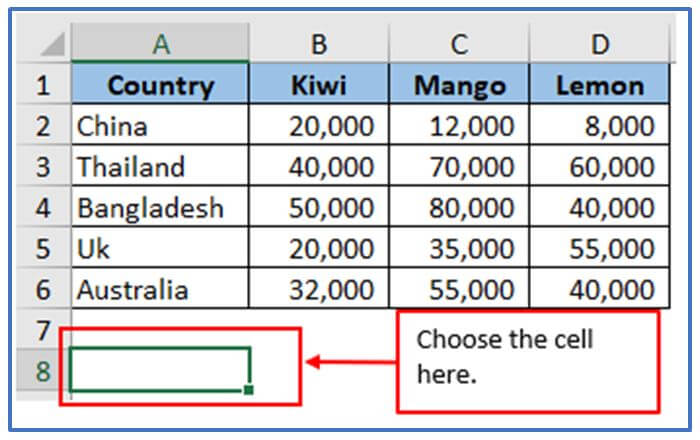
Step 2: Now, select the cell where you want to apply the formula.
The cell has been added here.
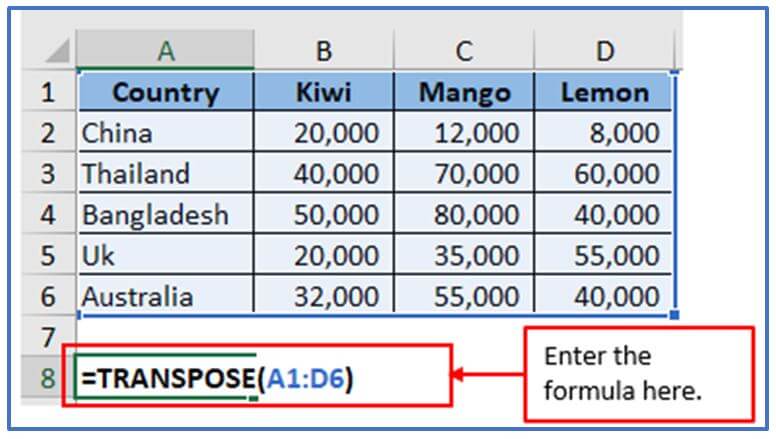
Step 3: Dynamic Arrays in Excel (365 and 2021), the TRANSPOSE function is very easy to use. Simply enter the formula in the top left cell of your target range and press Enter. There are no row and column count or CSE array formulas. The formula will be: =TRANSPOSE(A1:D6)
Applied the formula here.
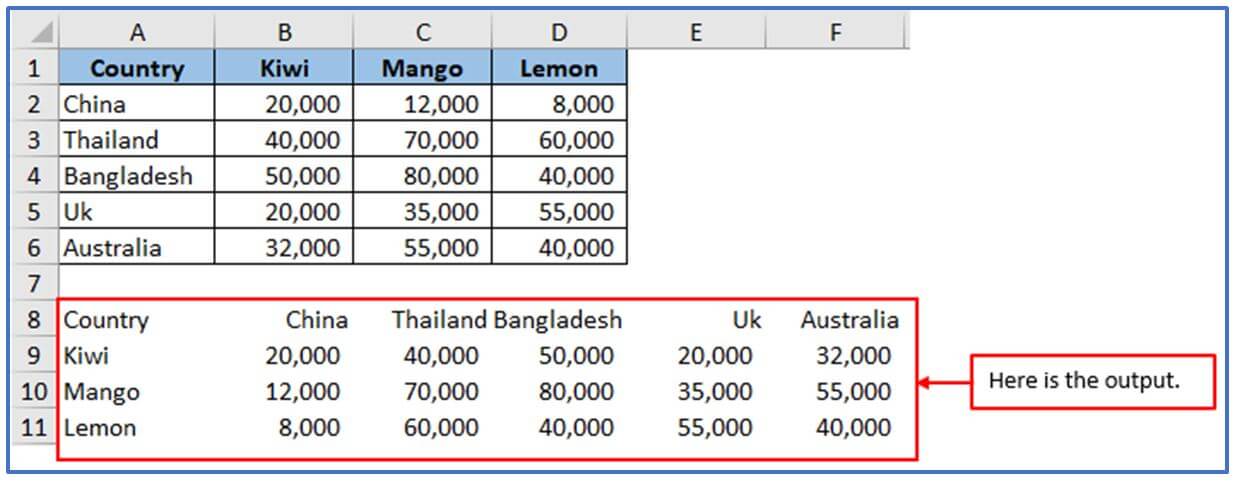
Step 4: In the end, hit enter to get the value.
The result is outlined below.
5. Limitations for transpose function.
By using TRANSPOSE, it is possible to rotate a set of cells from corresponding rows to columns or vice versa in Excel. The use of TRANSPOSE has some restrictions.
- Size limit: Arrays with large sizes are the only ones that TRANSPOSE can handle. The maximum number of rows or columns in Excel versions before Excel 2007. Excel 2007 and later versions expand this limit to 1,048,576 rows or columns.
- The memory: When dealing with large data sets, TRANSPOSE uses a considerable amount of memory. This is particularly true for large arrays. Excessive storage in your Excel workbook can cause it to run slowly and crash, potentially due to the memory limit limits.
- Temporary information: If the data changes constantly, using TRANSPOSE may not be the best option, as the transposed data must be manually updated every time the original data changes.
- Performance: Using TRANSPOSE on large data sets can hinder Excel’s performance, particularly on computers with limited resources or older hardware.
- Compatibility: When transferring an Excel file to someone with an older Excel version, TRANSPOSE may not function properly or cannot be used at all. This is particularly problematic. It is important to note that the source data structure is dependent. Regularly structured data can be used in conjunction with TRANSPOSE.
However, if your data is irregularly structured or contains merged cells, empty rows/columns, or other unusual data, it may not transpose correctly. When using TRANSPOSE in Excel, it is important to consider these limitations to ensure that the workbook functions correctly and efficiently.
Application of Transpose function in Excel
-
Switching Rows and Columns: Easily flip data from rows to columns or vice versa without manually rearranging the information.
-
Reorganizing Data for Analysis: Reorganize large datasets for better readability and analysis by transforming the layout to match your preferred format.
-
Creating Reports: Quickly transpose data to prepare reports or pivot tables, adjusting data to fit the report structure.
-
Data Entry Optimization: For datasets with repeating patterns, transpose the data for efficient data entry and to prevent errors.
-
Aligning Data from Different Sources: When combining datasets from different sources, use the transpose function to align data into a consistent layout.
-
Converting Vertical Lists to Horizontal Layouts: Convert vertical data (like lists of items) into horizontal formats for charts, summaries, or presentations.
For ready-to-use Dashboard Templates:
