FORECAST formula in Excel is a powerful tool for predicting future values based on historical data. By using this formula, you can make informed decisions, spot trends, and estimate outcomes efficiently. Whether for business analysis or financial planning, the “FORECAST formula” simplifies complex calculations, providing more accurate predictions. This function is essential for users seeking to forecast trends and outcomes in sales, inventory, or market performance. Understanding and utilizing the “FORECAST formula” can improve your data analysis, making it a crucial tool for anyone working with statistical models in Excel.
- What is FORECAST Function in Excel?
- Why create a forecast in Excel?
- How to Use FORECAST Function in Excel?
- Things you should know about FORECAST Function.
- Why FORECAST.ETS function not working?
1. What is FORECAST Function in Excel?
An Excel statistical function is the FORECAST function. Based on current values, it computes or forecasts future figures. For example, the FORECAST function is used in financial modeling to compute statistical values for the forecasts produced. By using the same function, you can anticipate future figures by utilizing information about your previous earnings and expenses.
The formula of FORECAST Function is: =FORECAST (x, known_y’s, known_x’s)
2. Why create a forecast in Excel?
Accessibility: Most individuals and businesses can easily access Excel due to its popularity.
Ease of use: Creating forecasts in Excel is effortless, and many users can use only basic statistical tools.
Capability for adaptability: It is capable of processing a wide range of data types and forecasting models.
Visualization: Forecasting data can be represented graphically through charting and graphing in Excel.
A system that fosters integration: Comprehensive analysis can be carried out using Excel with any business tool and data source, making it a versatile application.
In essence, Excel’s approach to creating forecasts is a powerful tool that helps in making informed decisions using historical data, planning strategically, and managing risk.
3. How to Use FORECAST Function in Excel?
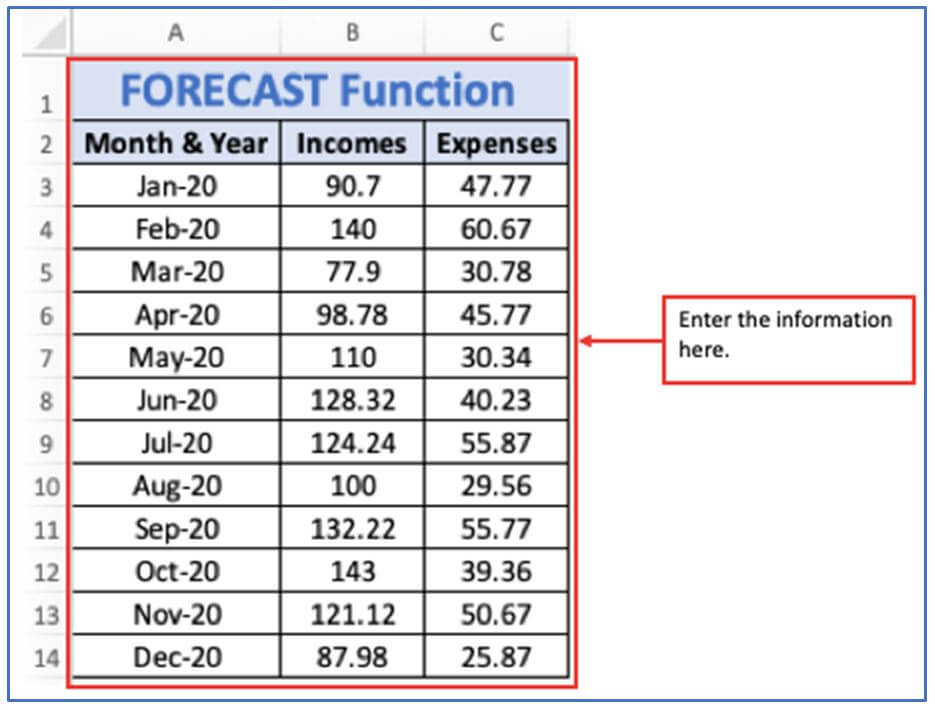
Here given income (X’s) and expenditure information (Y’s) respectively. Now, you can use the FORECAST function to predict a further point alongside the best-fit line given a set of known x and y values. By utilizing the FORECAST function, we can expect expenses for January 2021, which is also our monthly income data. For this you need to follow the underneath steps.
Step 1: Write down the 12 months name as well as year 2020, Earnings and expenses into the excel sheet.
The data has been placed here.
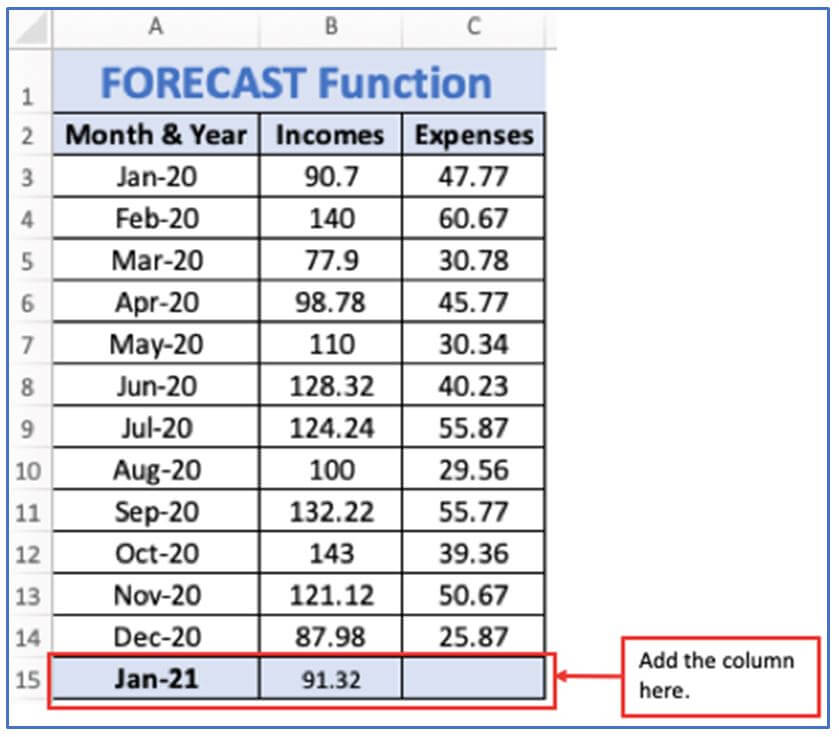
Step 2: Add the column in A15:C15, here you need to add incomes of Jan-21 in column A15:C15 to get the expenses of Jan-21 there.
The columns have been selected below.
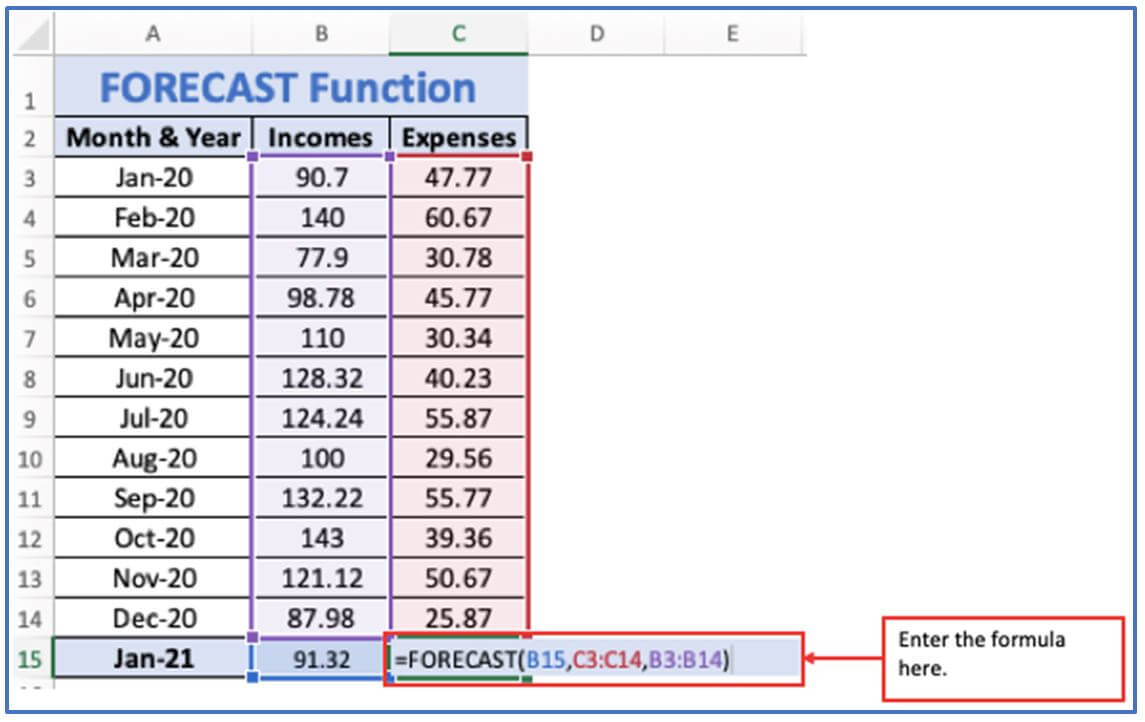
Step 3: Now, use the FORECAST function formula to get the result. The formula is: =FORECAST(B15,C3:C14,B3:B14)
Entered the formula here.
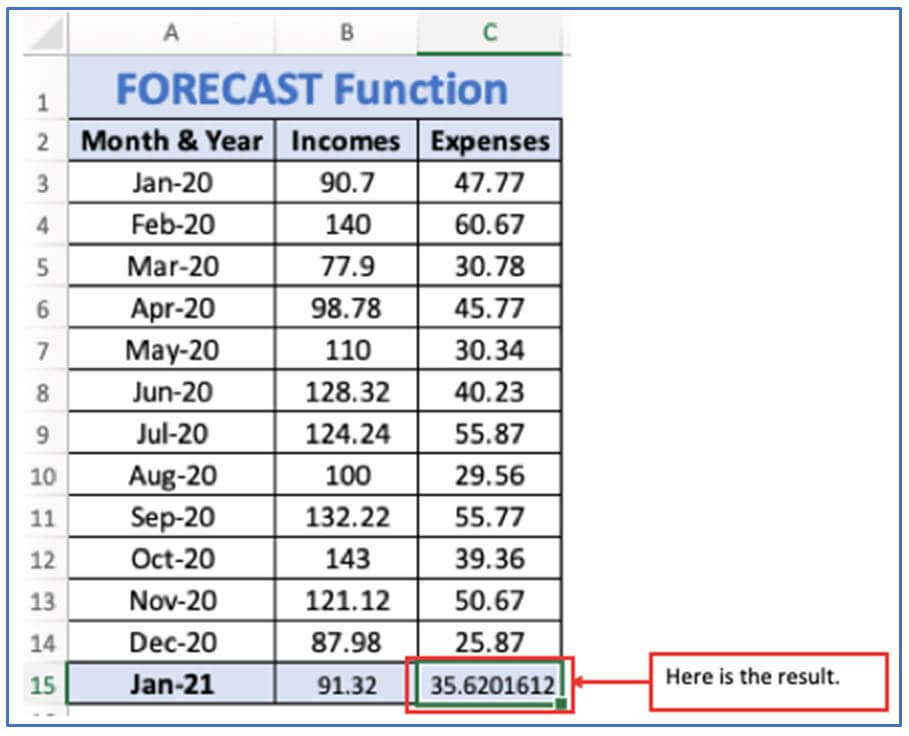
Step 4: Now, press the enter button and you will get the output.
Here is the result below. The values of x and y are the averages of the known values.
4. Things you should know about FORECAST Function.
i) A zero variance must be present in an array of known x values and the lengths of the known ones must match the width of their length.
ii) #N/A!Error- Raised when: The lengths of the provided array of known x values and the provided array of known y values are different. All known x values or y values in arrays are either blank fields or numeric inputs.
iii) #DIV/0!Error – when the variance of the specified known x values is zero.
iv) #VALUE!Error – Raised when the specified future x values are not numeric.
5. Why FORECAST function not working?
There are several reasons why Excel’s FORECAST.ETS function may not be functioning properly.
a) Data issues an ignoring or uncompleted historical data, ensure that the information you use for your forecast is accurate. Missing data points can cause errors. Invalid data format the timeline requires a date format that Excel recognizes. Make sure all your data is formatted correctly. Values must be numeric. Consistent time interval Timelines must have a consistent interval (daily, monthly, yearly) if the interval is not consistent, errors may occur.
b) Function syntax error Required arguments. The parameters of the method, such as target_date, values, and timeline, are mandatory. Ensure they are correctly defined.
c) The versions that are compatible with Excel are. In Excel 2016 and later versions, the FORECAST.ETS function is also accessible. Ensure that your Excel file is compatible with your device.
d) Seasonal Inadequacy. Provide the correct explanation for the seasonality argument. The default value is 1 (autodetect). Errors may arise if the value is manually set incorrectly.
e) The method of aggregate. Adding time values that are the same is represented by adding an aggregation argument. The default value is 0 (average). Make sure this setting is appropriate for your data.
f) Error messages for formulas. Examine specific Excel errors for instance: #VALUE! This indicates a problem with a value or timeline (such as a non-numeric value). The presence of a target date issue or ambiguity in the range could be indicative.
Application of FORECAST Function in Excel
-
Predict Future Sales: Use the FORECAST formula to predict future sales based on past performance, helping businesses plan their inventory and marketing strategies.
-
Estimate Market Trends: Forecast stock prices or market trends by analyzing historical data, allowing investors to make better-informed decisions.
-
Budgeting and Financial Planning: The FORECAST formula is useful for projecting future expenses or income based on previous financial records, aiding in more accurate budgeting.
-
Project Demand: Forecast product demand based on historical sales data, helping companies ensure they meet customer needs without overstocking.
-
Assess Risk: Use the formula to predict potential risks or financial downturns, giving businesses the opportunity to prepare for potential losses.
-
Forecast Growth: Predict the growth of a business or project over time, providing valuable insights for long-term planning and strategy development.
For ready-to-use Dashboard Templates:
