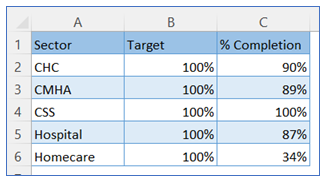
- Take sample data.
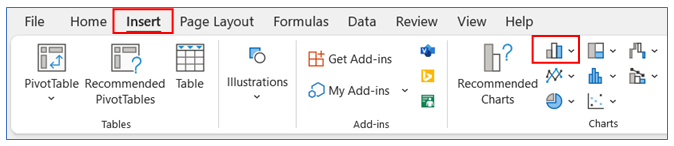
2. Select any cell of data then go to the ribbon, select Insert, and select your chart type from the chart group.
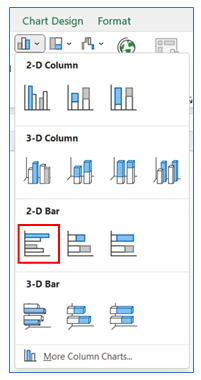
3. Select Chart type as 2-D Bar.
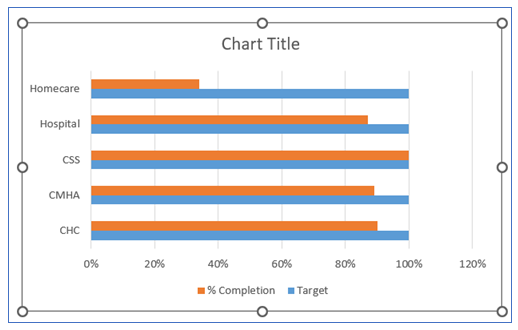
4. The chart looks below.
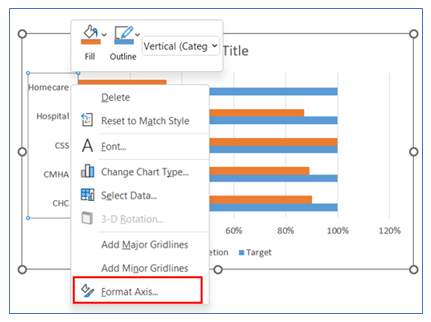
5. To change the category in reverse on the vertical axis, right-click on the axis and select Format Axis.
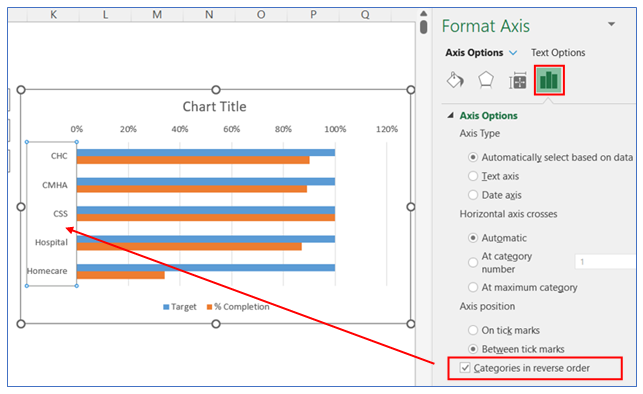
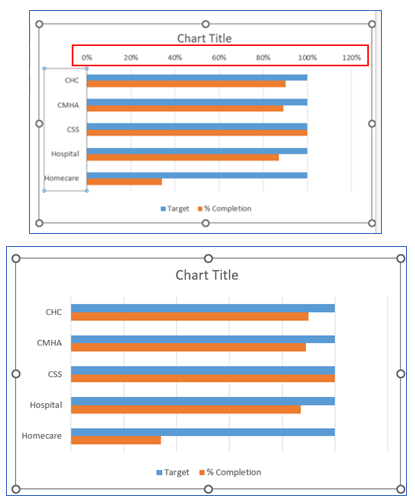
6. After that in the Axis Options give a checkmark on the ‘Categories in Reverse Order’ box.
7. To remove the horizontal axis, click on Axis and press Delete.
8. To remove the Chart Title and Legend, click on the Chart Title and Legend then press Delete.
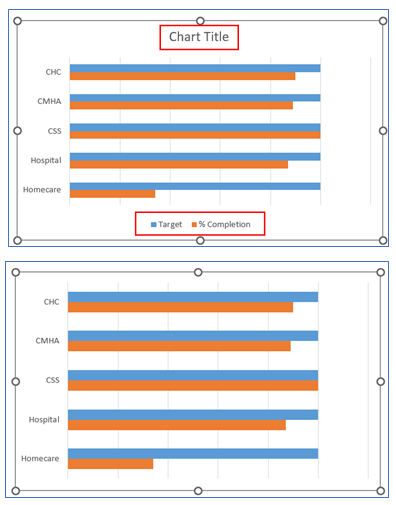
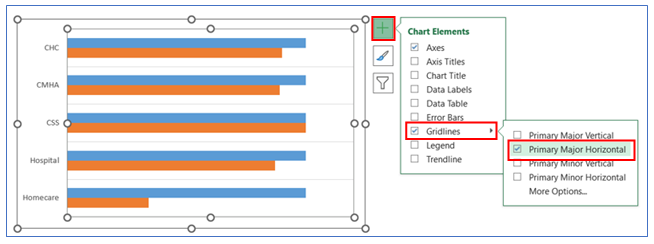
9. To give a horizontal Gridline, click on the chart then select the + button, and check the Gridline. Here we remove the vertical gridline and give a horizontal gridline.
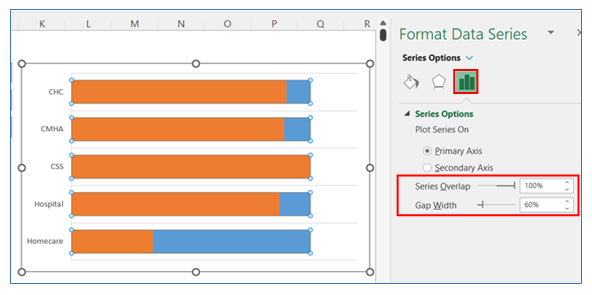
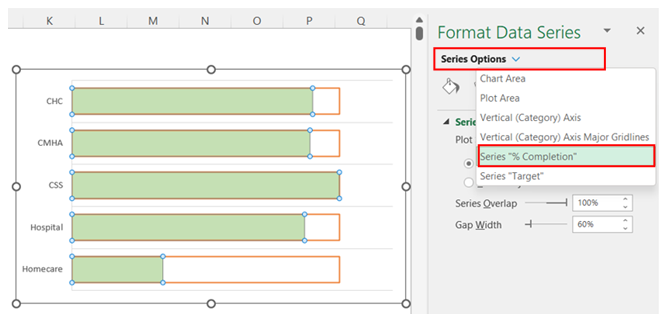
10. To change the gap width and Series Overlap in the bar, right-click on the chart and select Format Data, in Format Data Series select Series Option and change the gap width to 60% and Series Overlap to 100%.
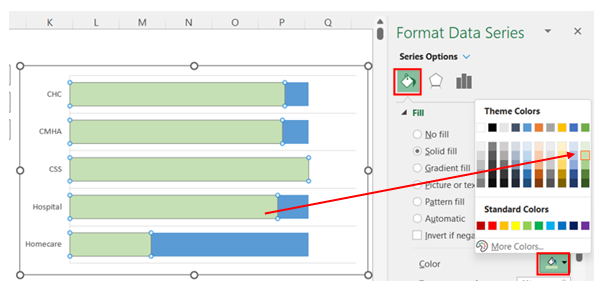
11. To change the color in the first bar, right-click on the chart and select Format Data, in Format Data Series select Fill and choose your color.
12. To change the color in the second bar, right-click on the chart and select Format Data, in Format Data Series select Fill and choose No fill.
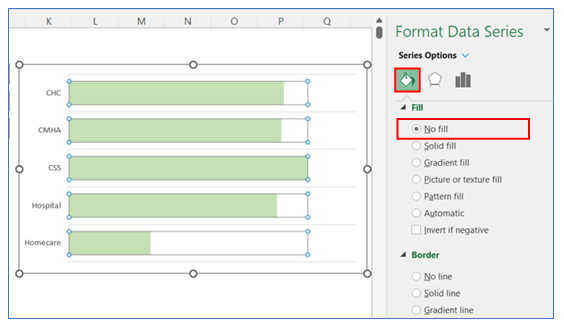
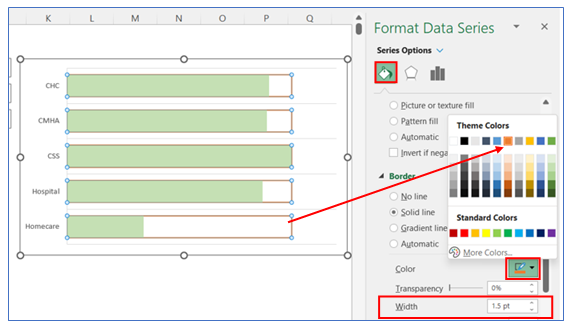
13. To change the color in the second bar outline, right-click on the chart and select Format Data, in Format Data Series select Border and choose your color and change Width to 1.5 pt.
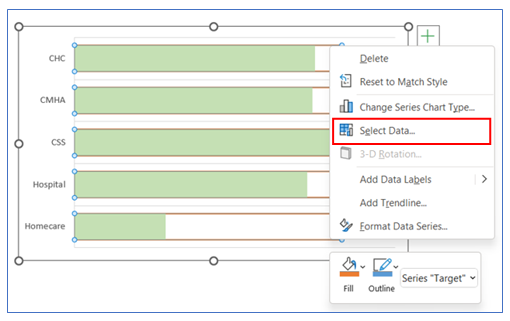
14. To bring forward the second bar outline, follow the below steps. Right-click on the bar and select data.
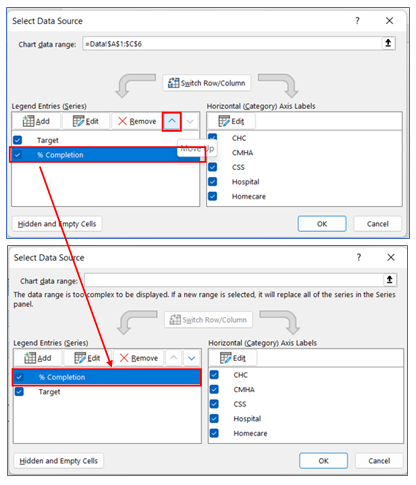
15. Select % of Completion and move up as indicated below image.
16. To give a data label of % completion, right-click on the bar, select Format Data Series, and choose the series type as % Completion.
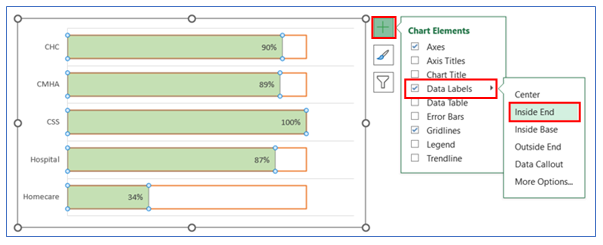
17. To give Data Labels click on your chart and select the + button to give your Data labels. Select Data labels and click on Inside End or any other option.
18. To give a Chart Title click on your chart and select the + button to give your Chart Title, select Chart Title.
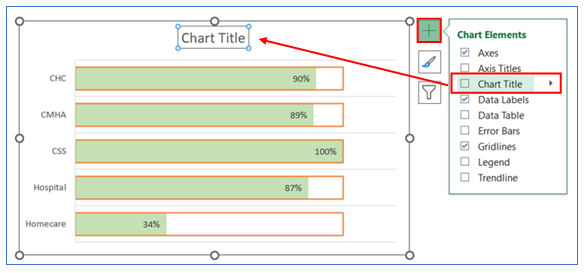
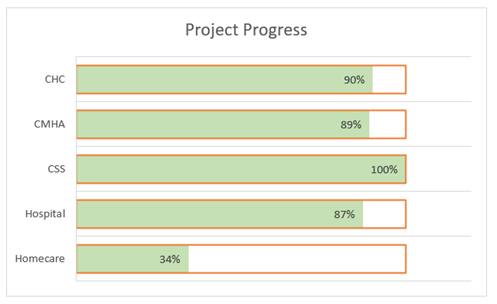
19. To change the chart title name, click the chart title and write the title name. The chart looks below.