Calculate Average Growth Rate in Excel to unlock a wealth of insights into your data’s developmental trends and project future progress with precision. This fundamental analytical technique is a cornerstone in fields ranging from finance to scientific research, offering a clear perspective on growth patterns over time. Whether you’re evaluating financial investments, monitoring business expansion, or analyzing population growth, this guide will equip you with the tools and knowledge to proficiently compute the average growth rate in Excel, transforming raw data into actionable, strategic insights.
While certain built-in Microsoft Excel formulas can assist you in determining growth rates, you will need a small workaround in order to compute average and compound annual growth rates (nothing too complex though).
The average annual growth rate (AAGR), compound average growth rate (CAGR), and comparison of the two are all covered in this tutorial.
This Tutorial Covers:
- What is the Average Growth Rate or Average Annual Growth Rate (AAGR)
- How to calculate Average Growth Rate
- How to calculate the Compound Average Growth Rate
- How to calculate the Compound Annual Growth Rate using the XIRR Function
- AAGR Vs CAGR
1. What is the Average Growth Rate or Average Annual Growth Rate in Excel (AAGR)?
As the name implies, the Average Annual Growth Rate (AAGR) is the average of the annual growth rates.
For instance, if I inform you that your stock portfolio has increased with an annualized growth rate (AAGR) of 8% over the past six years, what I mean is that you have added 8% of the value each year (at the end of the year as compared with the beginning of the year).
This might not imply that it increased by exactly 8% annually. It simply means that it provided an overall AAGR of 8% at the end of the sixth year.
Investors frequently use the average annual growth rate to monitor the performance of their portfolios or to determine the direction of a company’s revenue, cost, and profit trends.
2. How to calculate Average Growth Rate?
Calculate growth rate in Excel.
It takes two steps to calculate the Average Annual Growth Rate (AAGR) in Excel (unlike CAGR, which can be calculated with a single formula).
You must first determine the excel growth rate for each year in order to calculate the growth rate average across the numerous years. Only then can you determine the AAGR.
Let’s say you know the values for each year as follows:
Value at the Beginning = $200,000
End of year 1 value = $235,000
End of year 2 value = $245,000
End of year 3 value = $270,000
End of year 4 value = $300,000
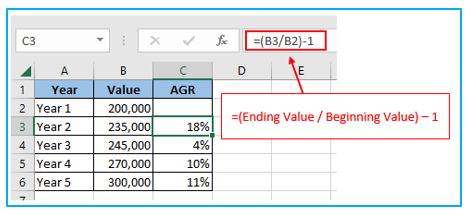
Using the information above, the formula for calculating the growth rate for each year:
=(Ending Value / Beginning Value) – 1
You may obtain the following growth rates in Excel using the aforementioned dataset:
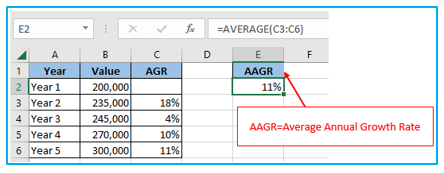
Now, you can use Excel to find the average annual growth rate in excel by entering the AVERAGE function below:
=AVERAGE(C3:C6)
And is it possible to accomplish this with one annual growth rate formula excel?
Indeed, you can!
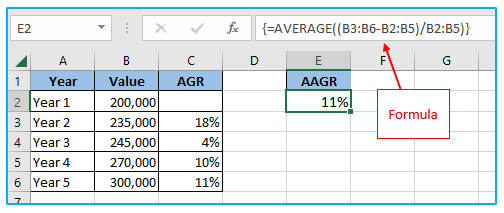
The annualized growth rate formula excel that will calculate your AAGR value using the year-by-year data you have is shown below:
=AVERAGE((B3:B6-B2:B5)/B2:B5)
The formula above can be used to obtain the result if you are using Office 365 and have access to dynamic arrays.
If you’re using Excel 2010, 2013, or 2016, you must enter this formula using Control + Shift + Enter (hold the Control and the Shift key and then press the Enter key). After that, the formula looks like this:
{=AVERAGE((B3:B6-B2:B5)/B2:B5)}
3. How to calculate the Compound Average Growth Rate?
Calculating compound annual growth rate – formula for CAGR in Excel
In Excel, there is a fundamental formula that can be used to get the compound annual growth rate: =((End Value/Start Value)^(1/Periods)-1. And the following application of the formula is simple:
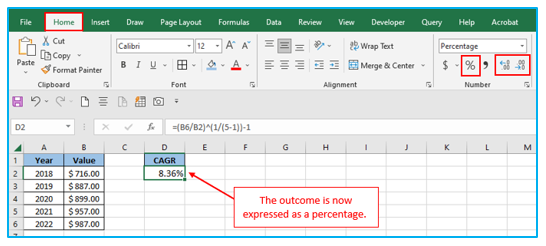
Step 1: Enter the formula below into a blank cell, such as Cell D2, and then press the Enter key. See illustration:
=(B6/B2)^(1/(5-1))-1
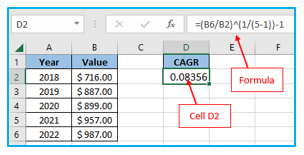
Note: It should be noted that the above formula uses B6 as the cell with the end value, B2 as the cell with the start value, and 5-1 as the interval between the two. You can alter these variables to suit your needs.
Step 2: The computation result might not always be formatted as a percentage. Please maintain choosing the calculation result, click the Percent Style button on the “Home” tab to convert it to percentage format, and then click the Increase Decimal or Decrease Decimal buttons to adjust the number’s decimal places. View the screenshot:
4. How to calculate the Compound Annual Growth Rate using the XIRR Function?
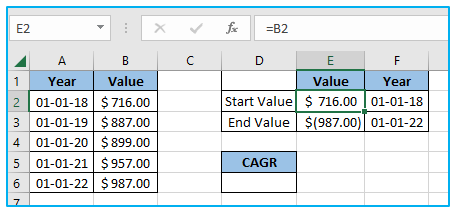
However, you must first construct a new table with the start value and end value before using the XIRR function to calculate the compound annual growth rate in Excel.
Calculation of CAGR percentage using the XIRR Formula in Excel:
Step 1: With the start value and end value, make a new table. You can enter your original data straight into this table by entering =B2 in cell E2, =A2 in cell F2, =-B6 in cell E3, and =A6 in cell F3. By the way, the End Value must be followed by a minus.
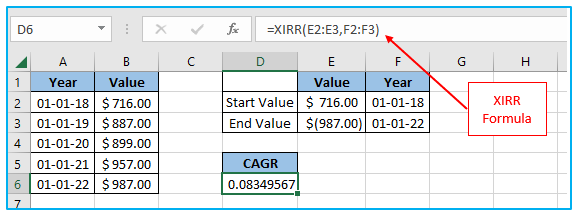
Step 2: Press the Enter key after choosing the cell where you want to enter the formula below.
=XIRR(E2:E3,F2:F3)
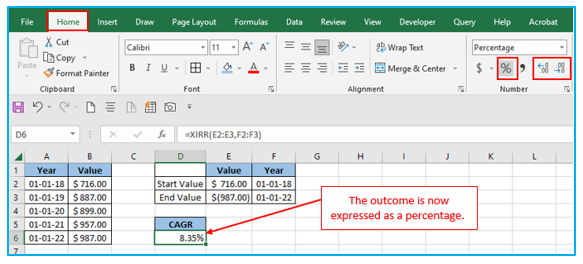
Step 3: The computation result might not always be formatted as a percentage. Please maintain choosing the calculation result, click the Percent Style button on the “Home” tab to convert it to percentage format, and then click the Increase Decimal or Decrease Decimal buttons to adjust the number’s decimal places. View growth percentage in the screenshot:
5. AAGR Vs CAGR:
Both formulas compute the annual growth rate, but AAGR fully disregards the effect of compounding that builds up over time.
CAGR, on the other hand, would consider the compounding effect.
Although AAGR is a useful indicator for determining the general growth trend, it occasionally causes the growth rate to be overestimated.
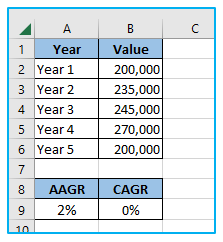
For instance, in the example below, the investment’s value is the same in Years 1 and 5, but the AAGR would lead you to assume that it increased in value at a rate of 2%. (Which is not true). Contrarily, CAGR provides an accurate picture by displaying a growth rate of 0%.
CAGR is more commonly employed in financial research and reporting due to its error-prone nature.
AAGR is still useful in the financial industry and is frequently used to determine the general trend.
Therefore, this is a simple method for calculating AAGR and CAGR in Excel. To achieve the same result, you may either use the single array formula or the more time-consuming method of first computing the growth rate of each year and then taking an average.
Application of Calculate Average Growth Rate In Excel
- Investment Analysis: Calculate the average annual growth rate of investments to evaluate their performance (rate of return) over time and make informed financial decisions.
- Business Revenue Growth: Determine the average growth rate of business revenue across multiple periods to assess overall business health and strategic effectiveness.
- Population Growth Studies: Use Excel to analyze demographic data by calculating the average growth rate of a population in a specific region over time.
- Sales Trend Analysis: Calculate the average growth rate of sales to identify trends, forecast future performance, and develop sales strategies accordingly.
- Product Demand Forecasting: Determine the average growth rate of product demand to assist in inventory planning, production scheduling, and market analysis.
- Educational Achievement Tracking: Analyze the average growth rate of test scores or other educational metrics to evaluate student progress and the effectiveness of teaching methods.
You may be interested:
