Audit formula in Excel is a powerful tool to track and verify the integrity of your data. By using it, you can identify errors, inconsistencies, or discrepancies in your spreadsheets, ensuring your work is accurate and reliable. Whether you’re working on complex financial models or simple datasets, implementing an audit formula helps maintain data accuracy and consistency. Excel’s audit formulas can save time, increase efficiency, and help you keep your work organized and error-free.
- What Is Formula Auditing?
- How to Trace Precedents in Excel?
- How to Trace Dependents in Excel?
- How to Remove Arrows in Excel?
- How to Show Formulas in Excel?
- Things to Remember when Auditing Formulas in Excel.
1. What Is Formula Auditing?
By auditing the formula in Excel, you can ascertain the correlation between cells and these two formulas. Additionally, Excel formula audit tools can be utilized to identify the subsequent elements. These cells help to solve the formula in the operating box.’ The. Formulas based on operating cells escapes the audit of the formula expressed by graphics by arrows, facilitating the visualization of the formula. In addition, it displays the formulas in the worksheet to operate in a single order When your formulas contain cells from another filler, you will notice this source table as a specific one. Various methods are available in Microsoft Excel for auditing a formula. Furthermore, by selecting the Excel formula tab, you will be presented with a group for formula audit. For many users, the ribbon needs to be customized in order to access this function.
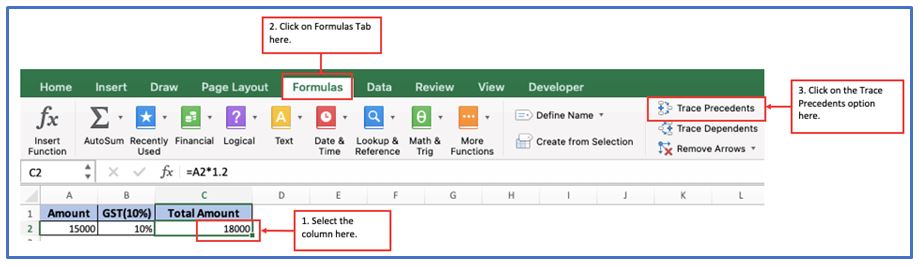
2. How to Trace Precedents in Excel?
Step 1: You can see the break-even point(unit) has been calculated here. You need to input data into Excel and utilize formulas to discover the results in this manner.
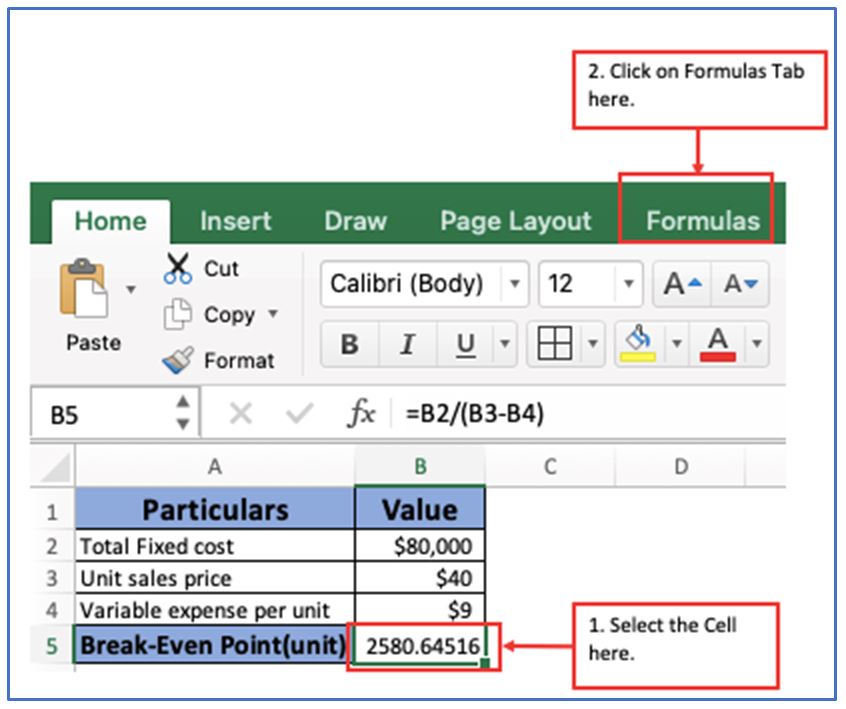
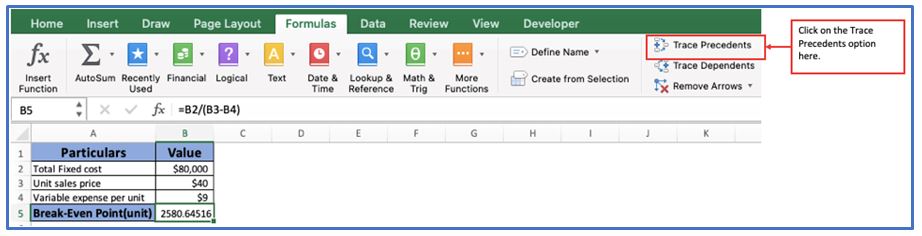
Step 2: Now, you need to pick the cell B5 and then go to Formulas tab.
Here following the above instruction below.
Step 3: Clicking on the Formula tab will open a selection of Trace Precedents option, click on that.
Selecting Trace Precedents option below.
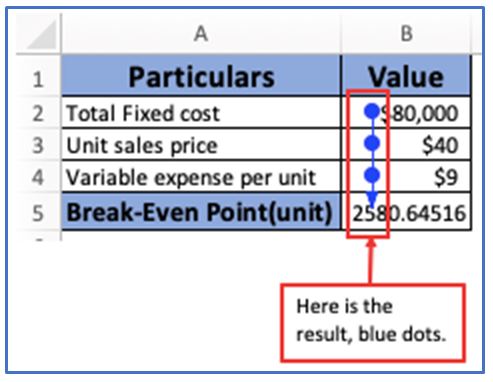
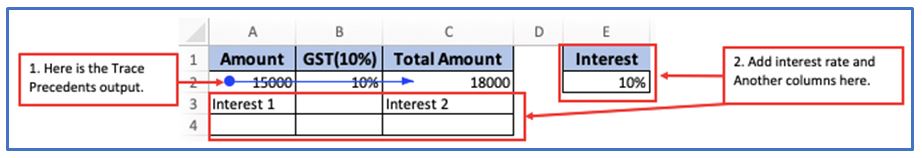
Step 4: This precedent can be identified by blue dots. The result is an arrow as shown below
Here is the result.
3. How to Trace Dependents in Excel?
Step 1: Enter the data into your excel as shown.
Placed the data here.
Step 2: This precedent can be identified by blue line arrow. The Trace Precedents result is an arrow as shown below.
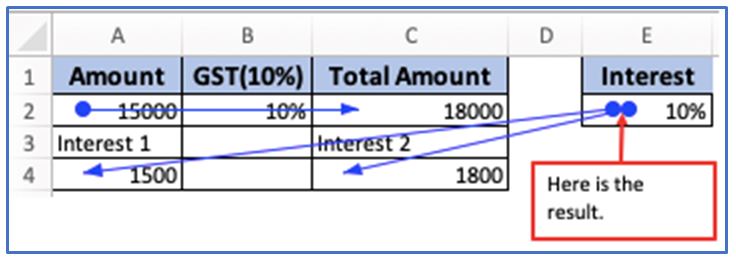
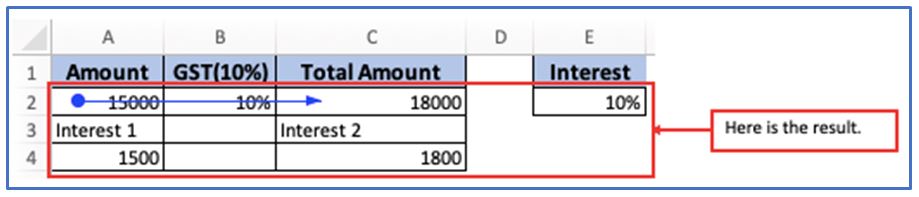
Now, to use Trace Dependents add another column and interest, apply new interest in amount and Total amount.
New columns and interest have been added here.
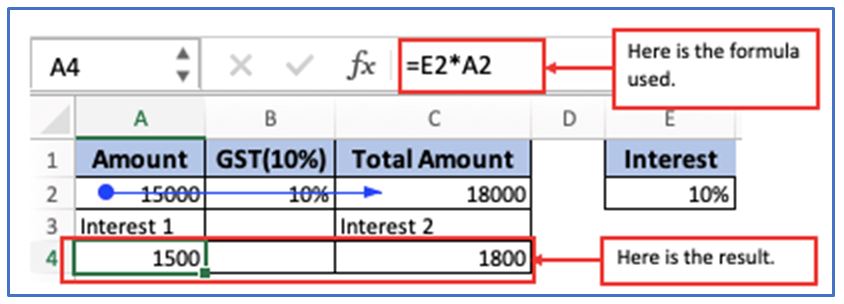
Step 3: Now, use the formula in A4 and C4 as displayed.
The result of calculation 10% interest on Amount and Total Amount is outlined below.
Step 4: Now, select the cell (E2) after calculating interest on Amount and Total amount then go to the Formulas> Trace Dependents.
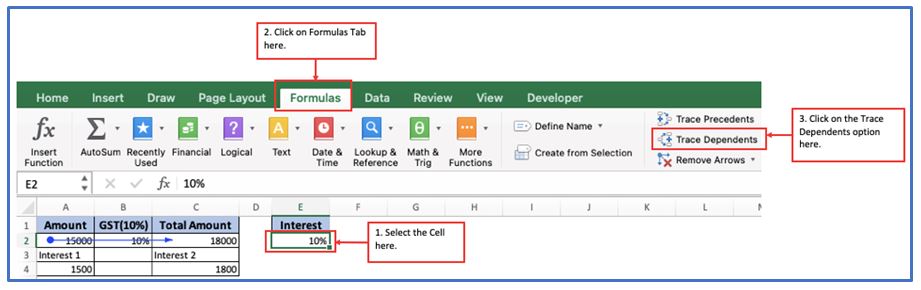
Step 5: As a result, you can see two arrows from cells E2 to A4 and from cells E2 to C4 Meanwhile, E2 forms the basis of A4 and C4.
Here is the output after using Trace Dependents.
4. How to Remove Arrows in Excel?
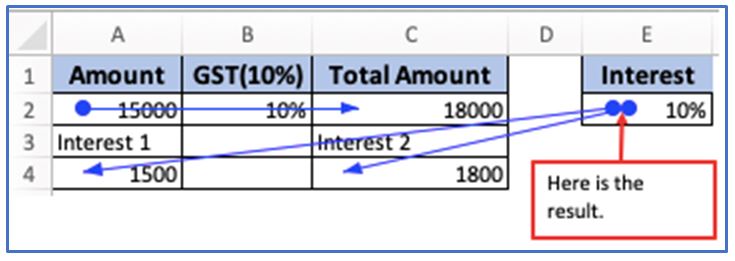
Step 1: You have seen how to do Trace Precedents and Trace Dependents this from the example above. The example above is used here for showing how to Remove Arrows in Excel?
Taking the mentioned example below.
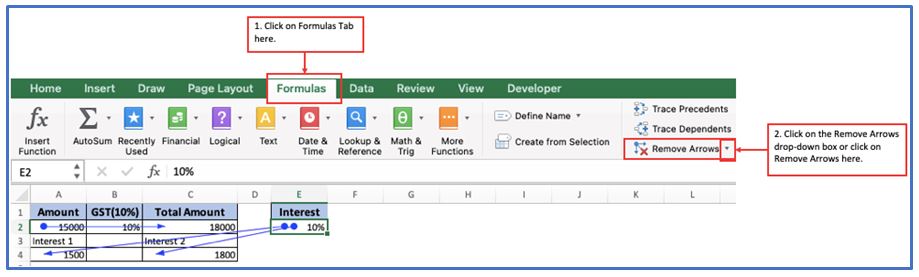
Step 2: Now, Go to Formulas tab and then click on the Remove Arrows drop-down box or you can click on the Remove Arrows option directly.
Clicking on the Remove Arrows drop-down box here.
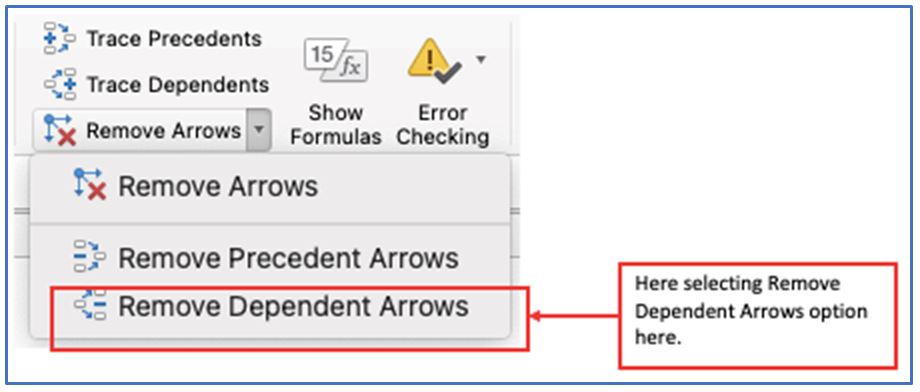
Step 3: After clicking on the Remove Arrows drop-down box you will get some options like this as the below image. You can select whichever option you like, according to your preferences.
Here picking Remove Dependent Arrows option here.
Step 4: As a result, you can notice, Trace Dependents option has been removed from the picture.
Here is the outcome after using Remove Dependent Arrows option.
5. How to Show Formulas in Excel?
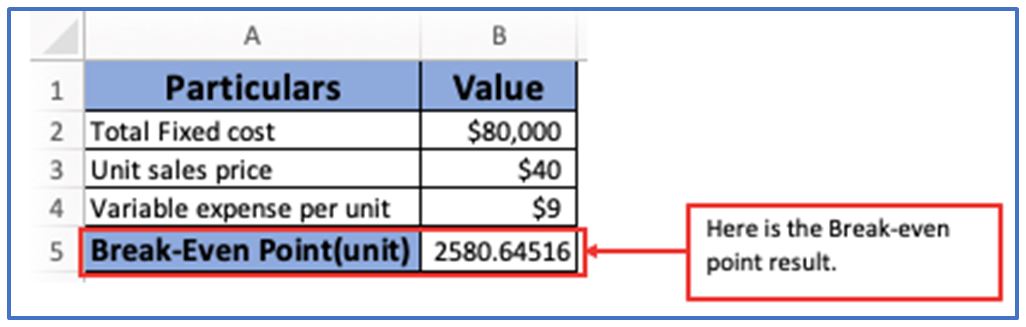
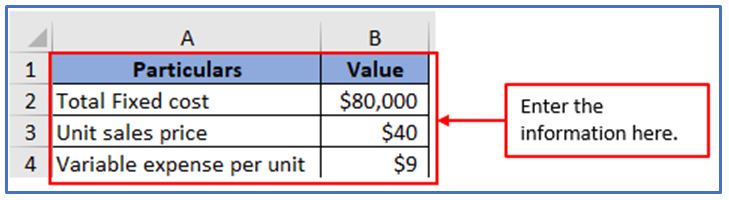
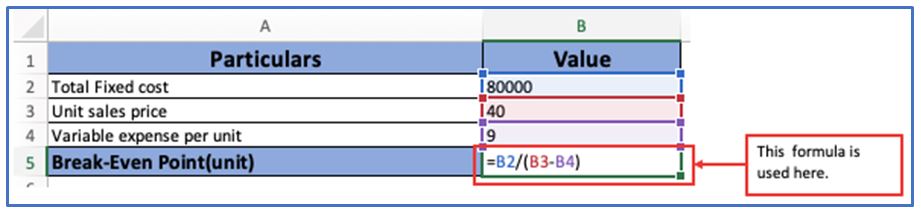
Step 1: Here given, Total fixed cost is $80,000. The variable expense is $9 per unit, and the unit sales price is $40.
The information has been Placed here.
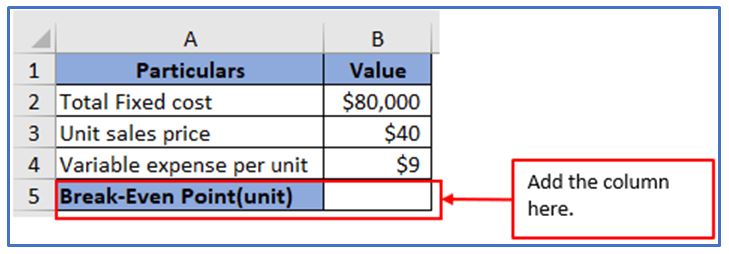
Step 2: Now, add the column in A5 and B5 to get the Break-Even Point result there.
Added the column here.
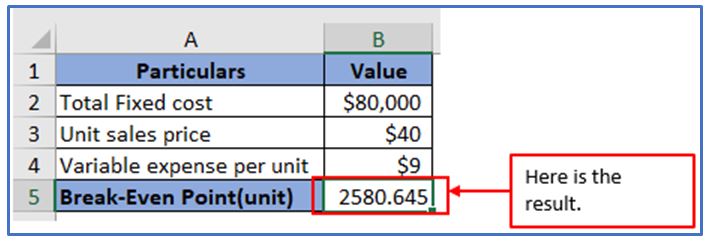
Step 3: Enter the break-even formula now. In the end, click the enter button to get the Break-Even Point.
The break-even point(unit) is 2580.645 outlined below.
Step 4: Now to see the formula, tap on the cell of the result B5, then go to Formulas tab and click on the Show Formulas option.
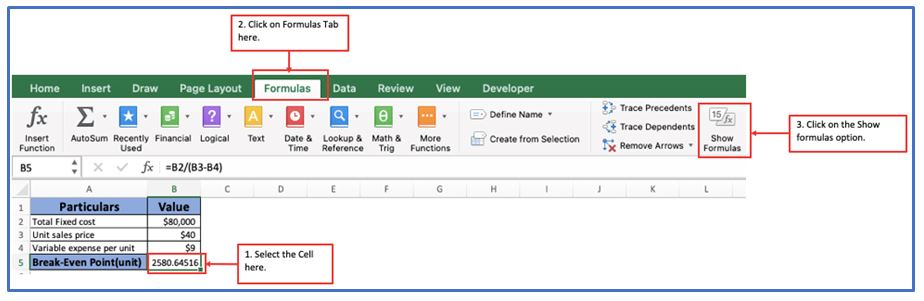
Step 5: After clicking on the Show Formulas option, you can see the formula that is used here.
Here is the formula.
6. Things to Remember when Auditing Formulas in Excel.
- When clicking on the “Show formulas” option, you can also see the date in the form of a number.
- By pressing “F9” on the keyboard, you can verify if the given equation in Excel is genuine.
- In case the cell does not show the ” Trace Precedents ” indication, Excel will send an error message.
- The Trace Dependents of cells with each cell guarantee that the formula in another cell is a reference to cells otherwise, an error message will be displayed.
Application of Audit Formula in excel
-
Error Detection:
Audit formulas help identify errors or inconsistencies in formulas and calculations across your worksheet. -
Formula Tracing:
You can use audit formulas to trace precedents and dependents of specific cells to ensure accuracy. -
Debugging Complex Calculations:
With audit formulas, you can quickly pinpoint and fix issues in complex formulas, making debugging easier. -
Ensuring Data Integrity:
Audit formulas help maintain the integrity of data by verifying that input values and results match expectations. -
Checking for Circular References:
They can be used to identify and resolve circular references, which can cause Excel to perform incorrect calculations. -
Cross-Verification of Results:
Audit formulas allow you to compare and cross-check results from multiple data sets, ensuring consistency across the workbook.
For ready-to-use Dashboard Templates:
