HR Payroll Power BI Dashboard
Introduction to the HR Payroll Power BI Dashboard
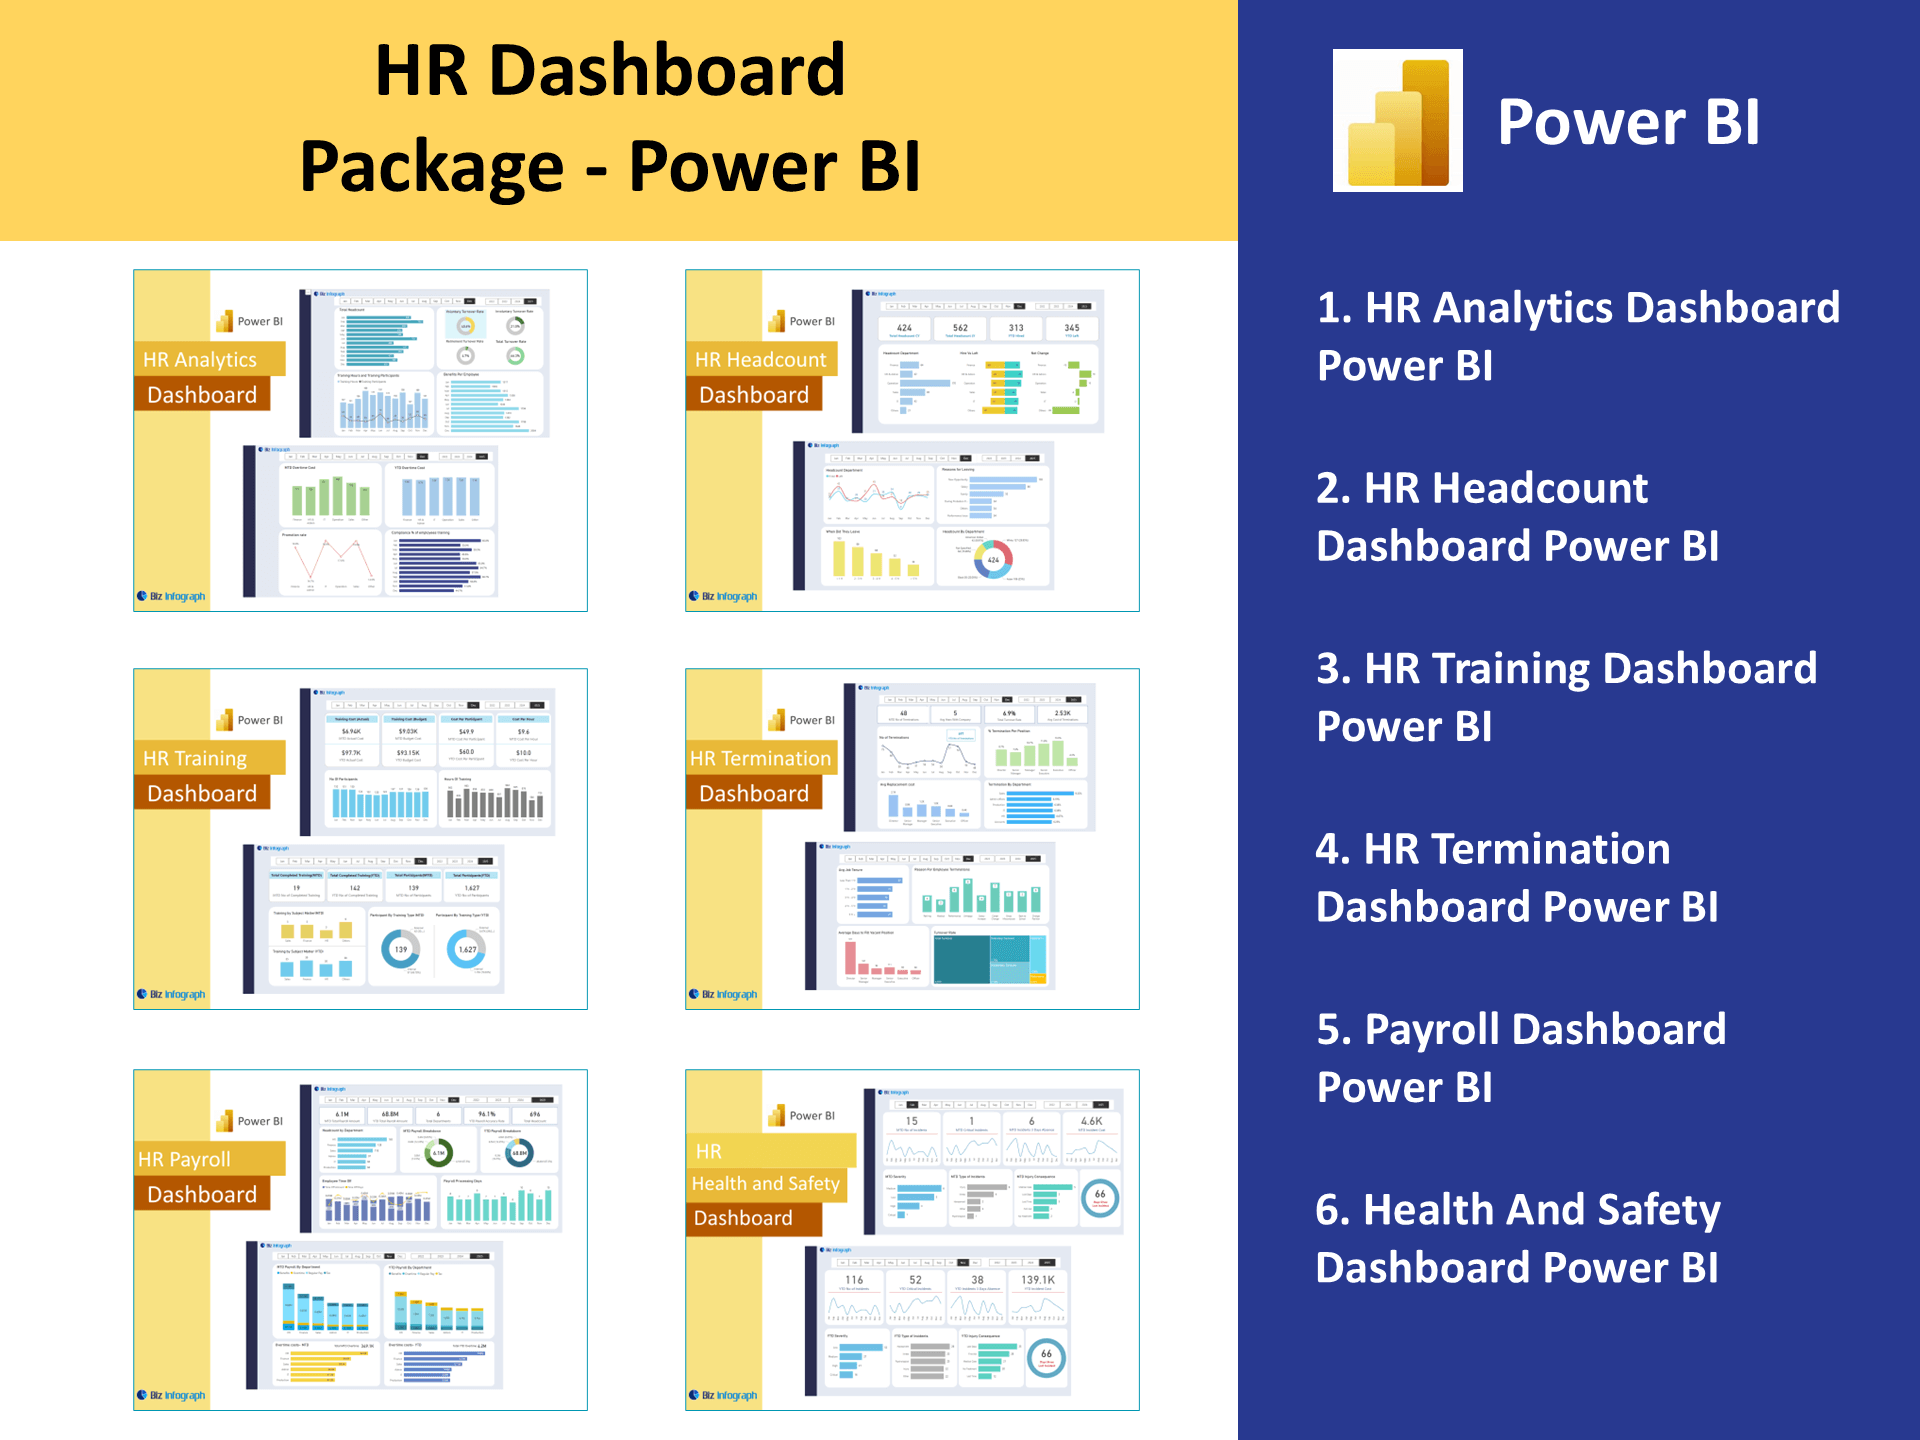
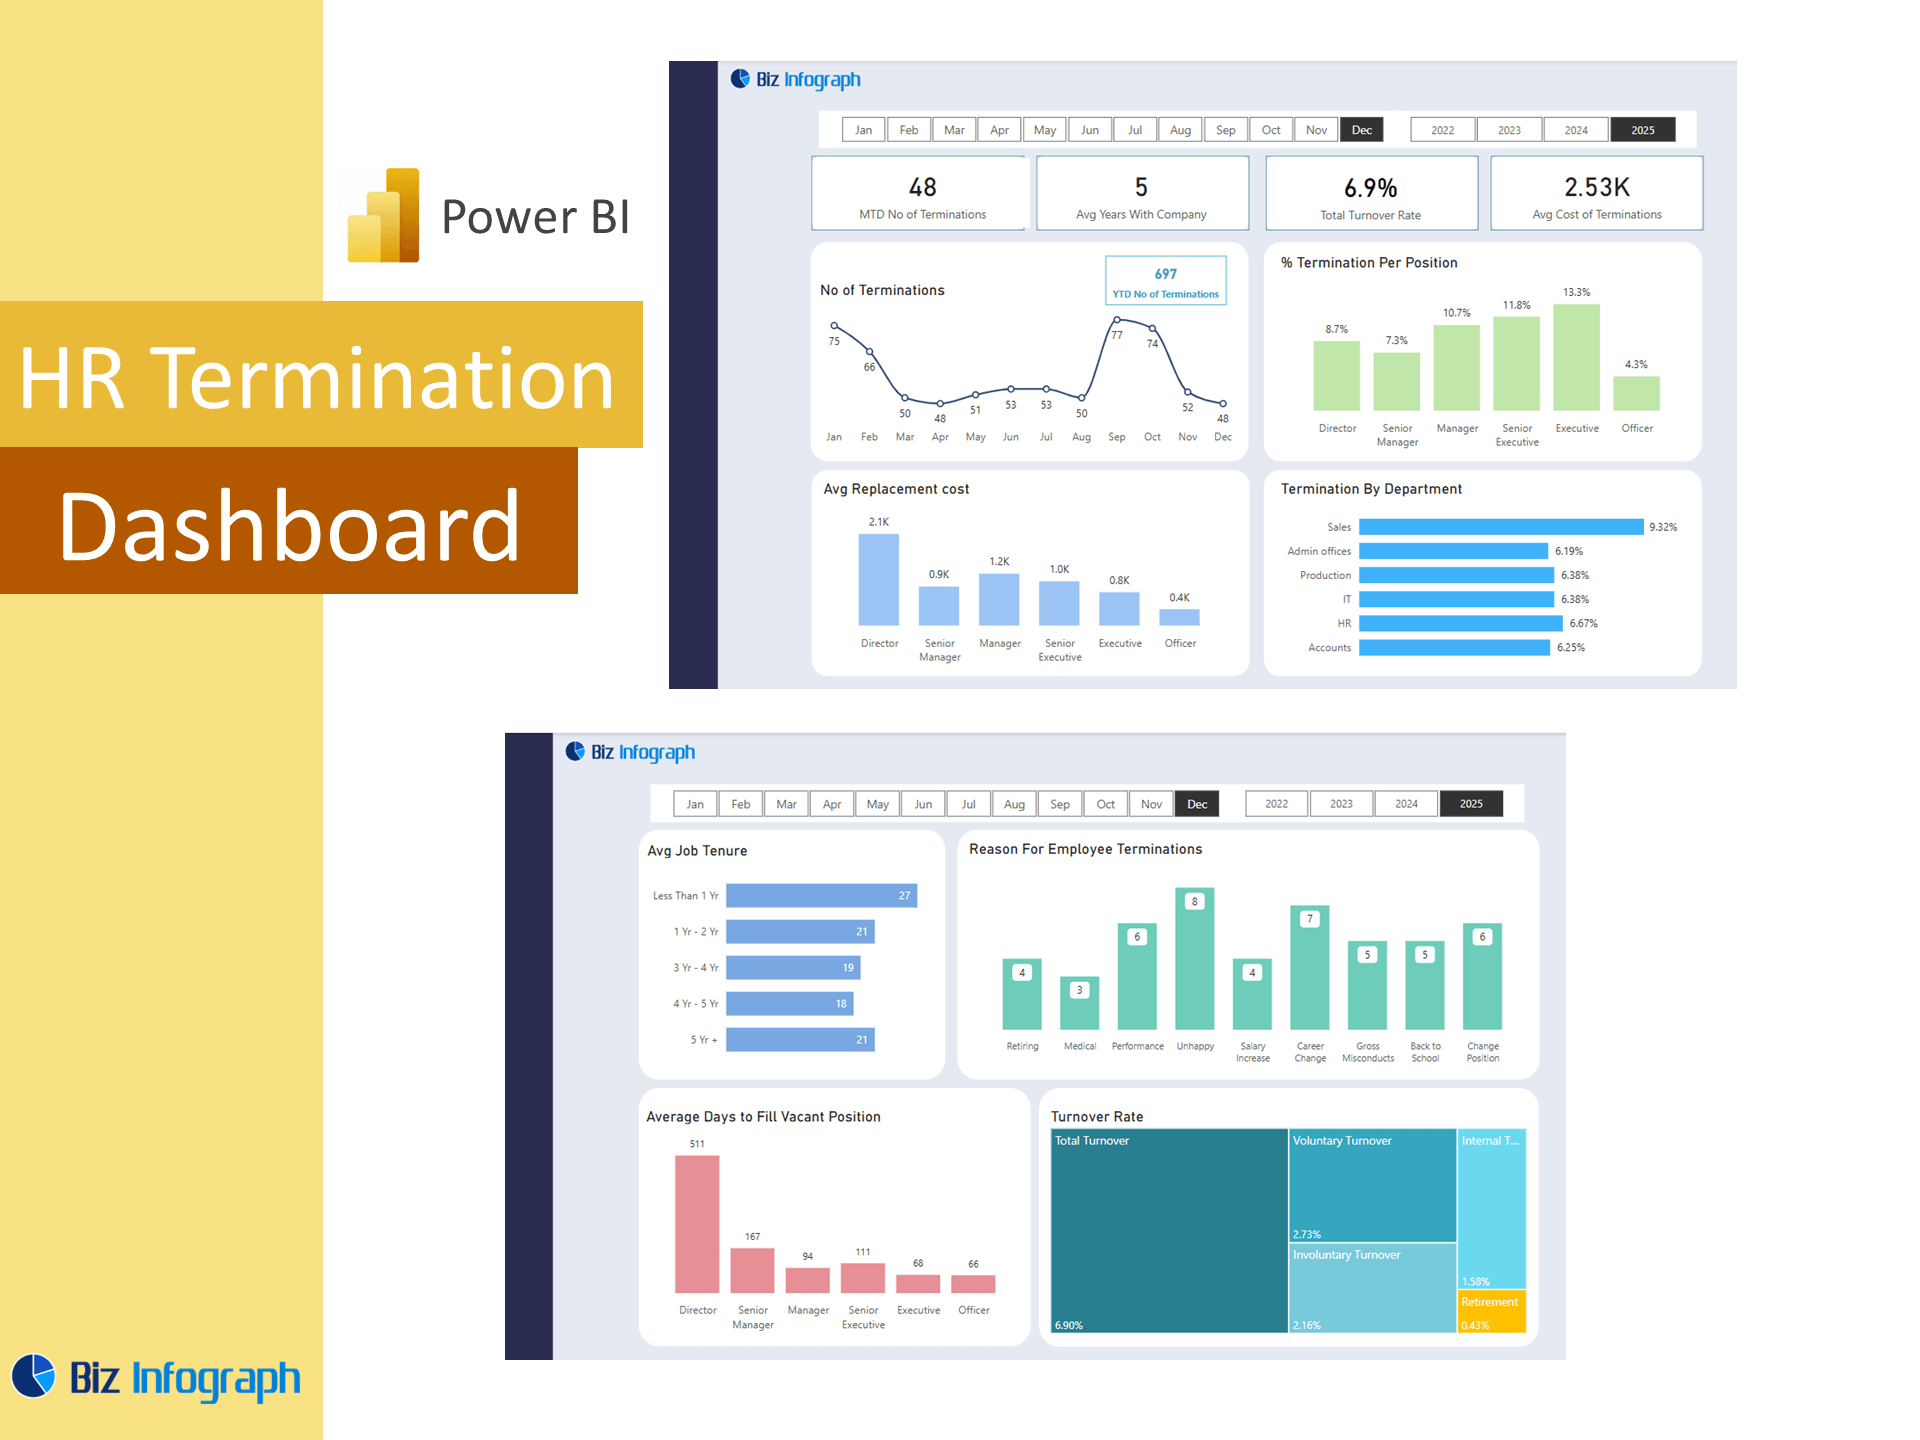
What Is an HR Payroll Dashboard and Why It Matters
An HR Payroll Dashboard is a centralized tool built with Microsoft Power BI to monitor, analyze, and report on employee compensation trends and payroll metrics. Used by HR professionals and HR managers, it combines employee data with HR metrics to help organizations understand and manage payroll distribution, track overtime, review average salary by department, and analyze cost-to-company figures. A well-structured HR power BI dashboard provides clarity into both current and historical payroll operations, helping leaders make data-based decisions. The dashboard allows easy tracking of financial trends and patterns related to workforce costs, and it is essential for effective human resource management and budgeting.
Benefits of Using Power BI for Payroll and HR Analytics
Power BI Human Resource dashboards offer unmatched capabilities for data automation and presentation, pulling data from multiple data sources and transforming it into insightful visualizations. Human Resource teams can benefit from templates for data automation, where payroll cycles, data analytics, bonus structures, and employee turnover costs are updated in real time through Power BI service. Unlike traditional spreadsheets or static reports, dashboard in Power BI provides drill-down interactivity and dashboards tailored for both analysts and executives. These dashboards enhance transparency in HR management, improve data access, and reduce manual reporting time, making HR management with Power BI more agile and strategic.
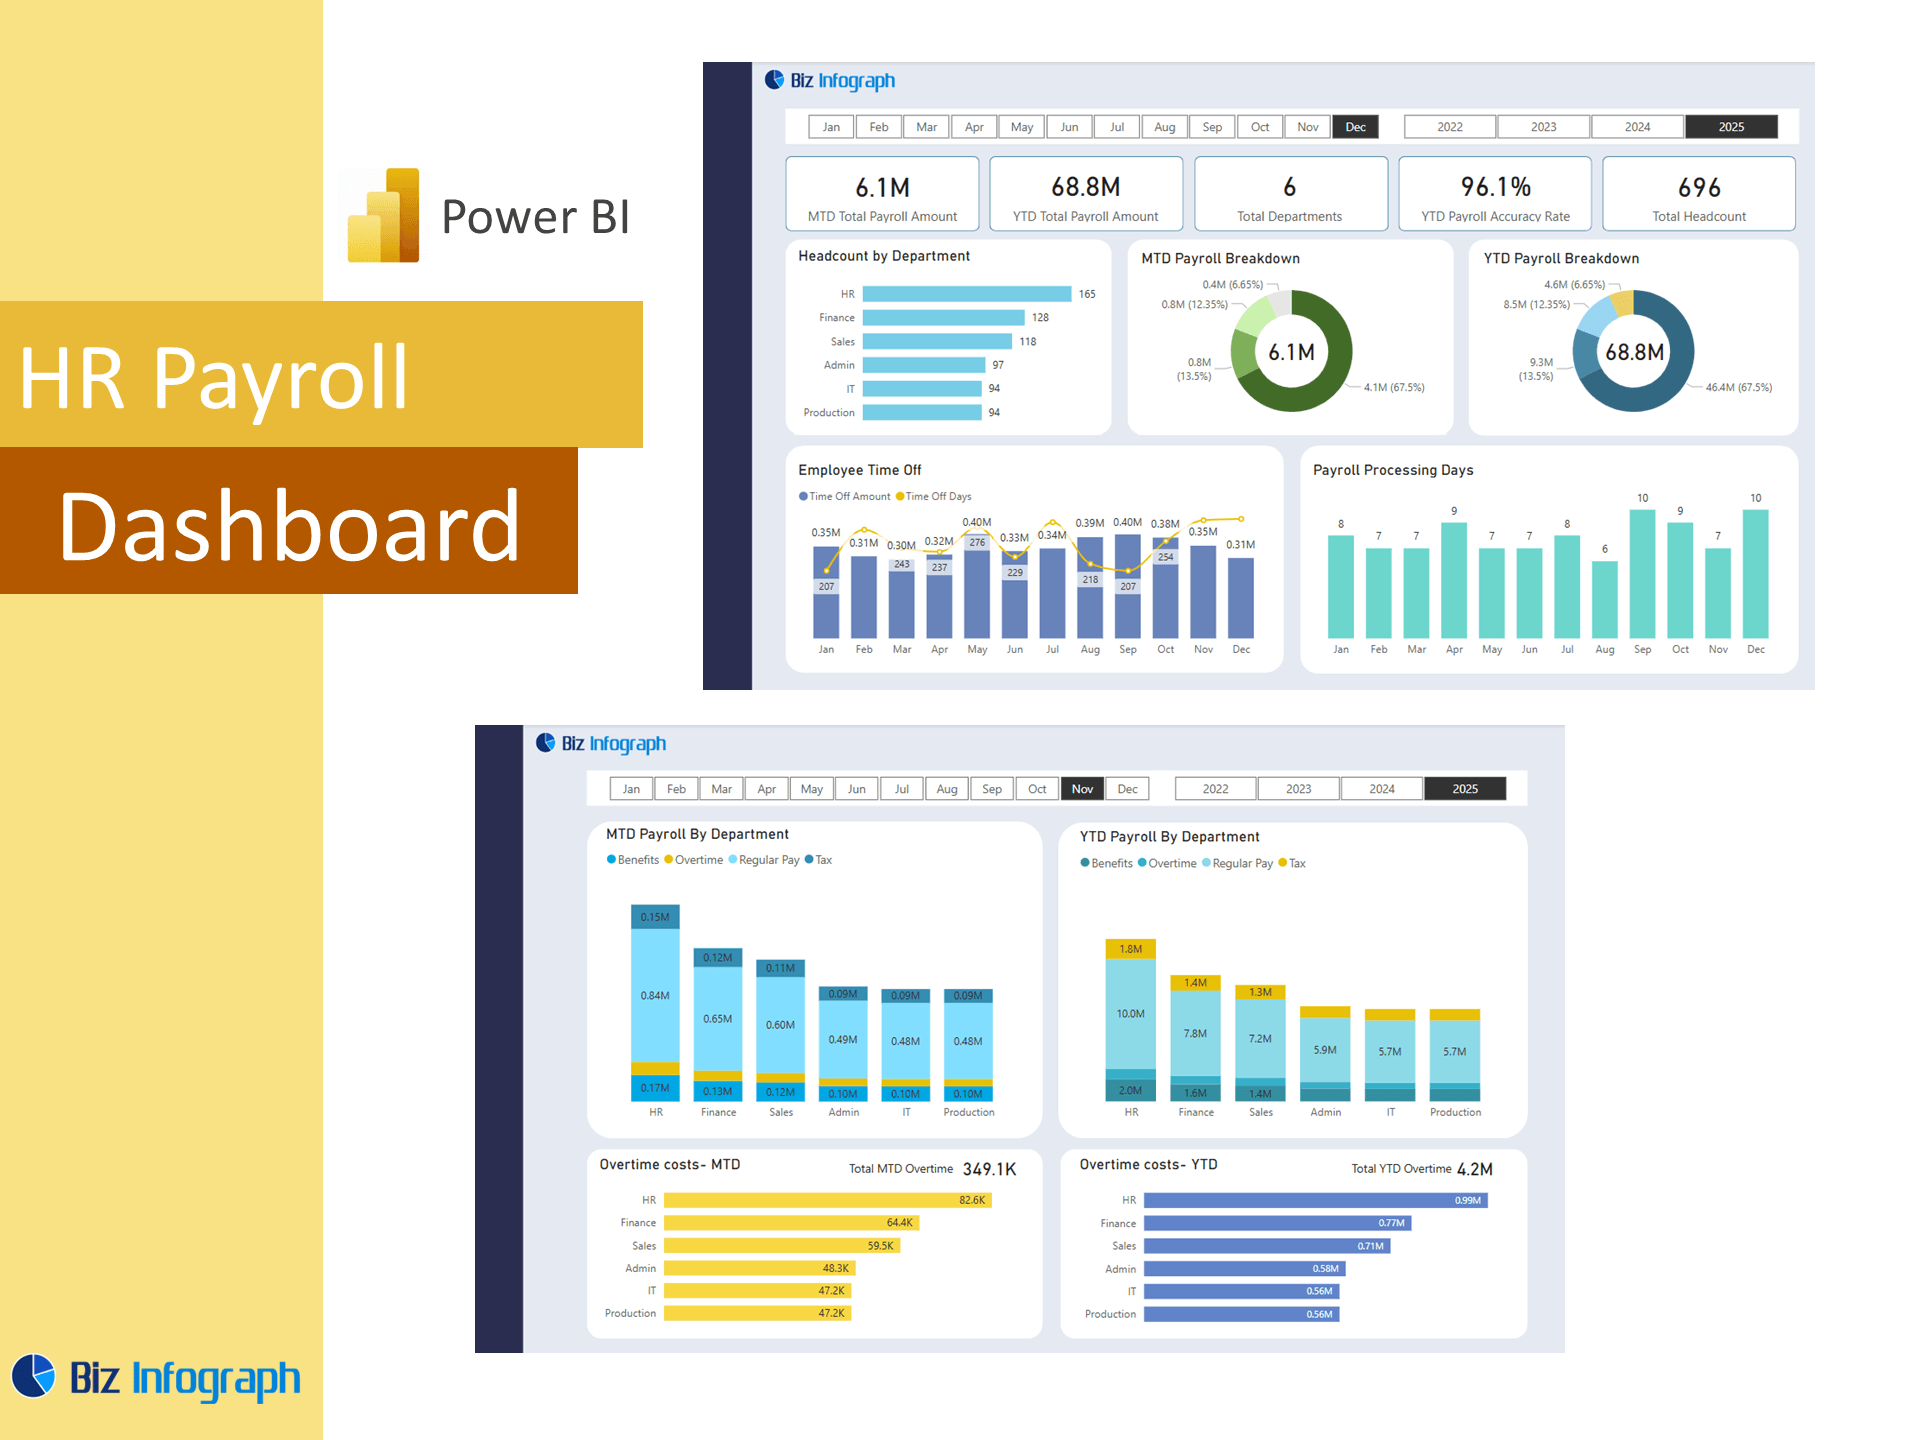
Key HR Metrics to Track in Payroll Dashboards
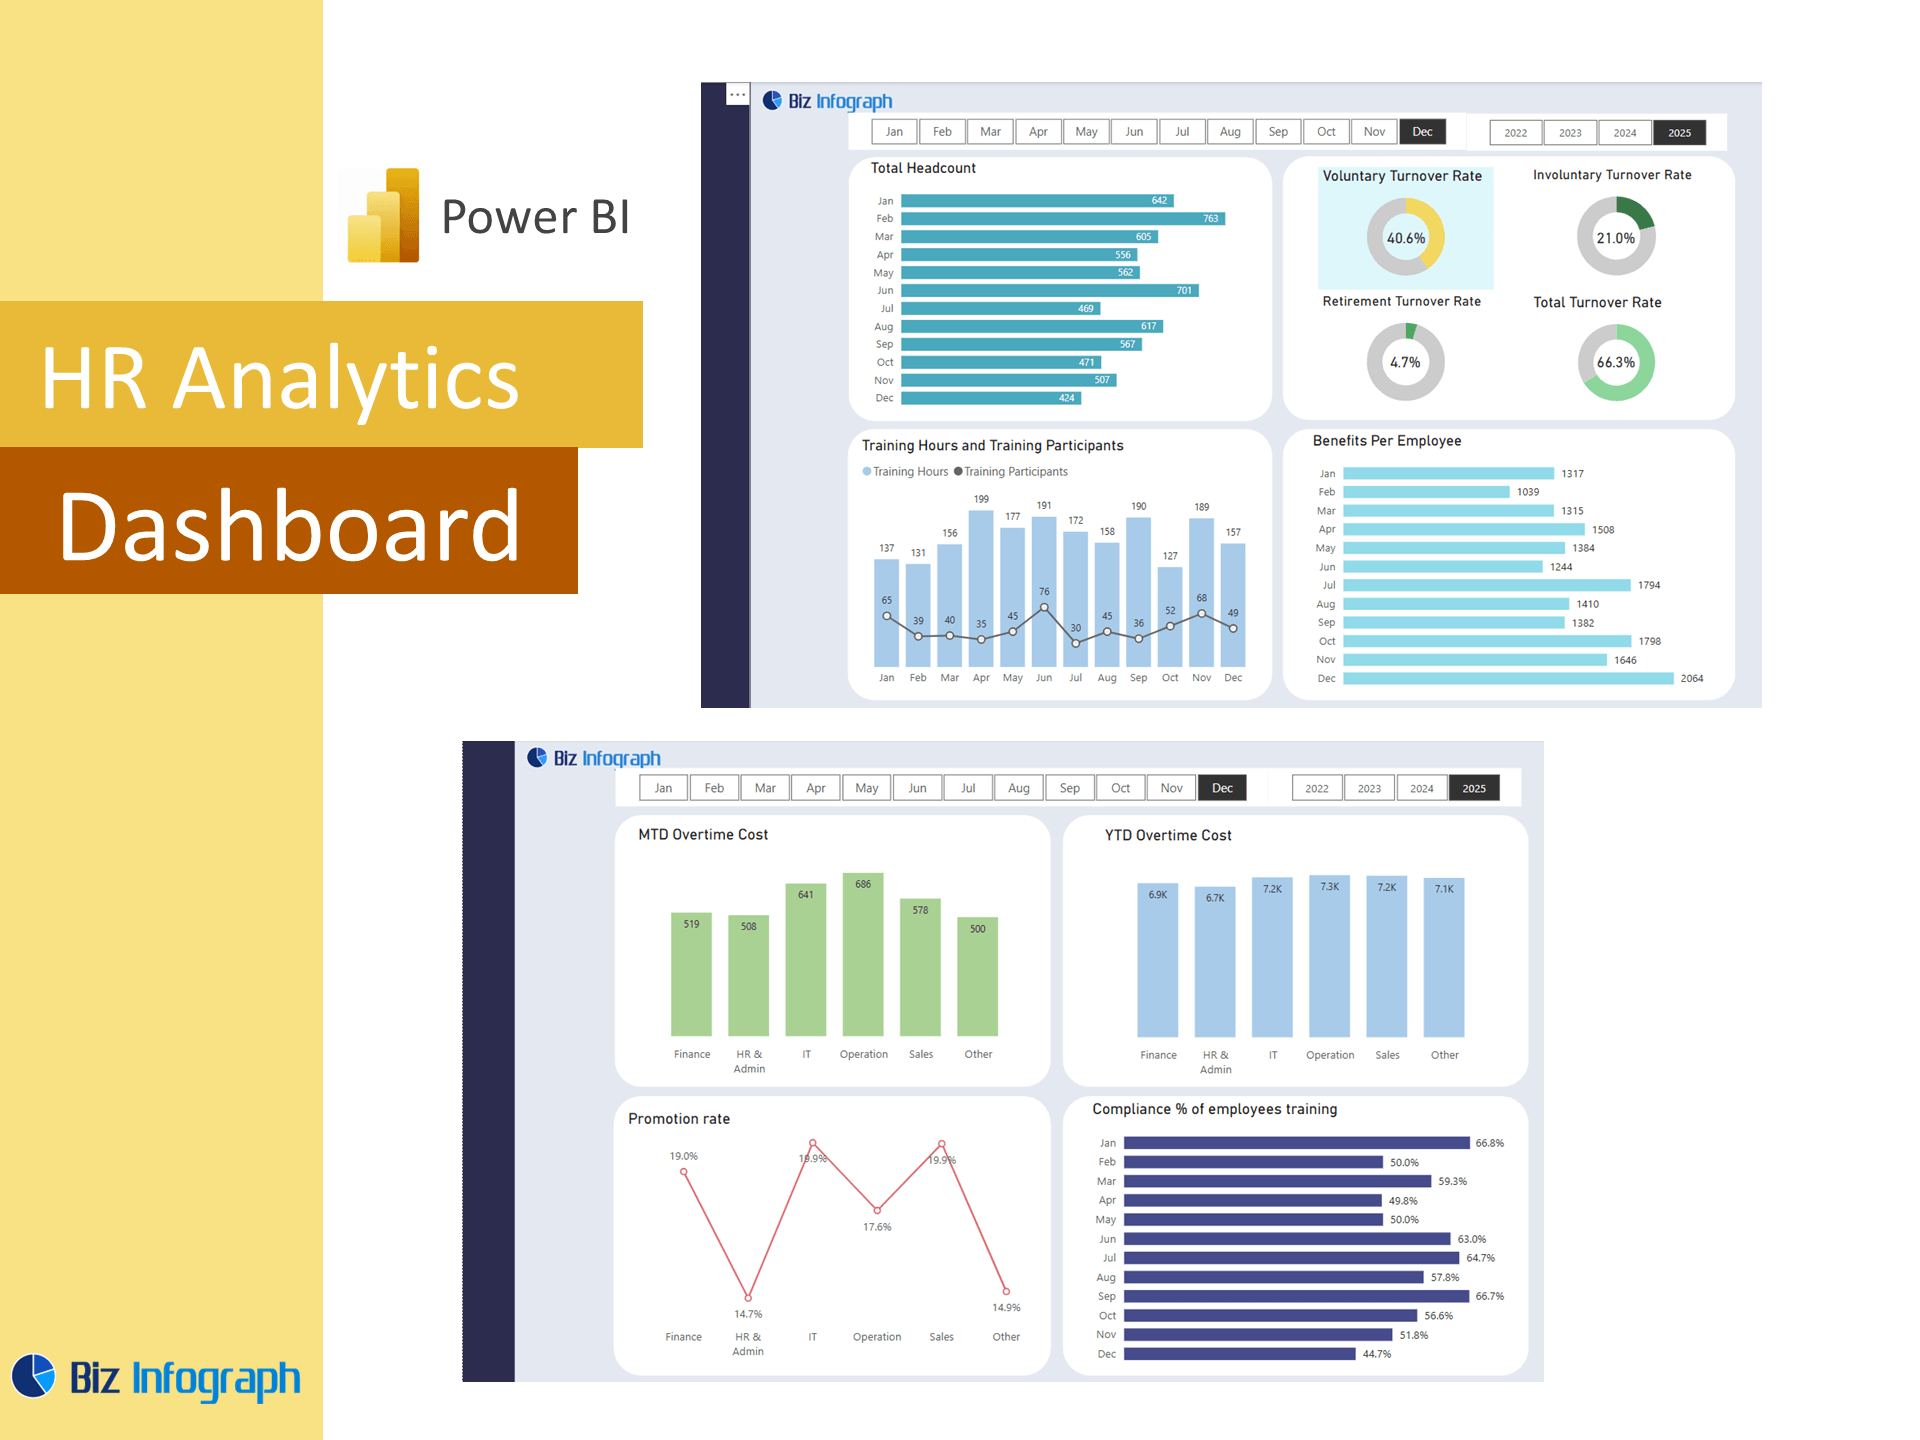
An effective HR Payroll Dashboard Power BI Template solution should focus on key performance indicators (KPIs) that support decision-making. Essential HR metrics include average salary, payroll cost per employee, salary band distribution, headcount trends, and time-to-fill for open roles. Including HR employee satisfaction, employee onboarding rates, and performance scores can help correlate pay with productivity. These important HR data points provide insight into fairness, pay equity, and retention risk. Power BI HR dashboards help HR departments track how well compensation aligns with business goals, while also integrating HR employee dashboard templates that reflect engagement, job changes, and department-level salary averages.
Building a Payroll Dashboard in Power BI
How to Design a Dynamic HR Payroll Dashboard Template
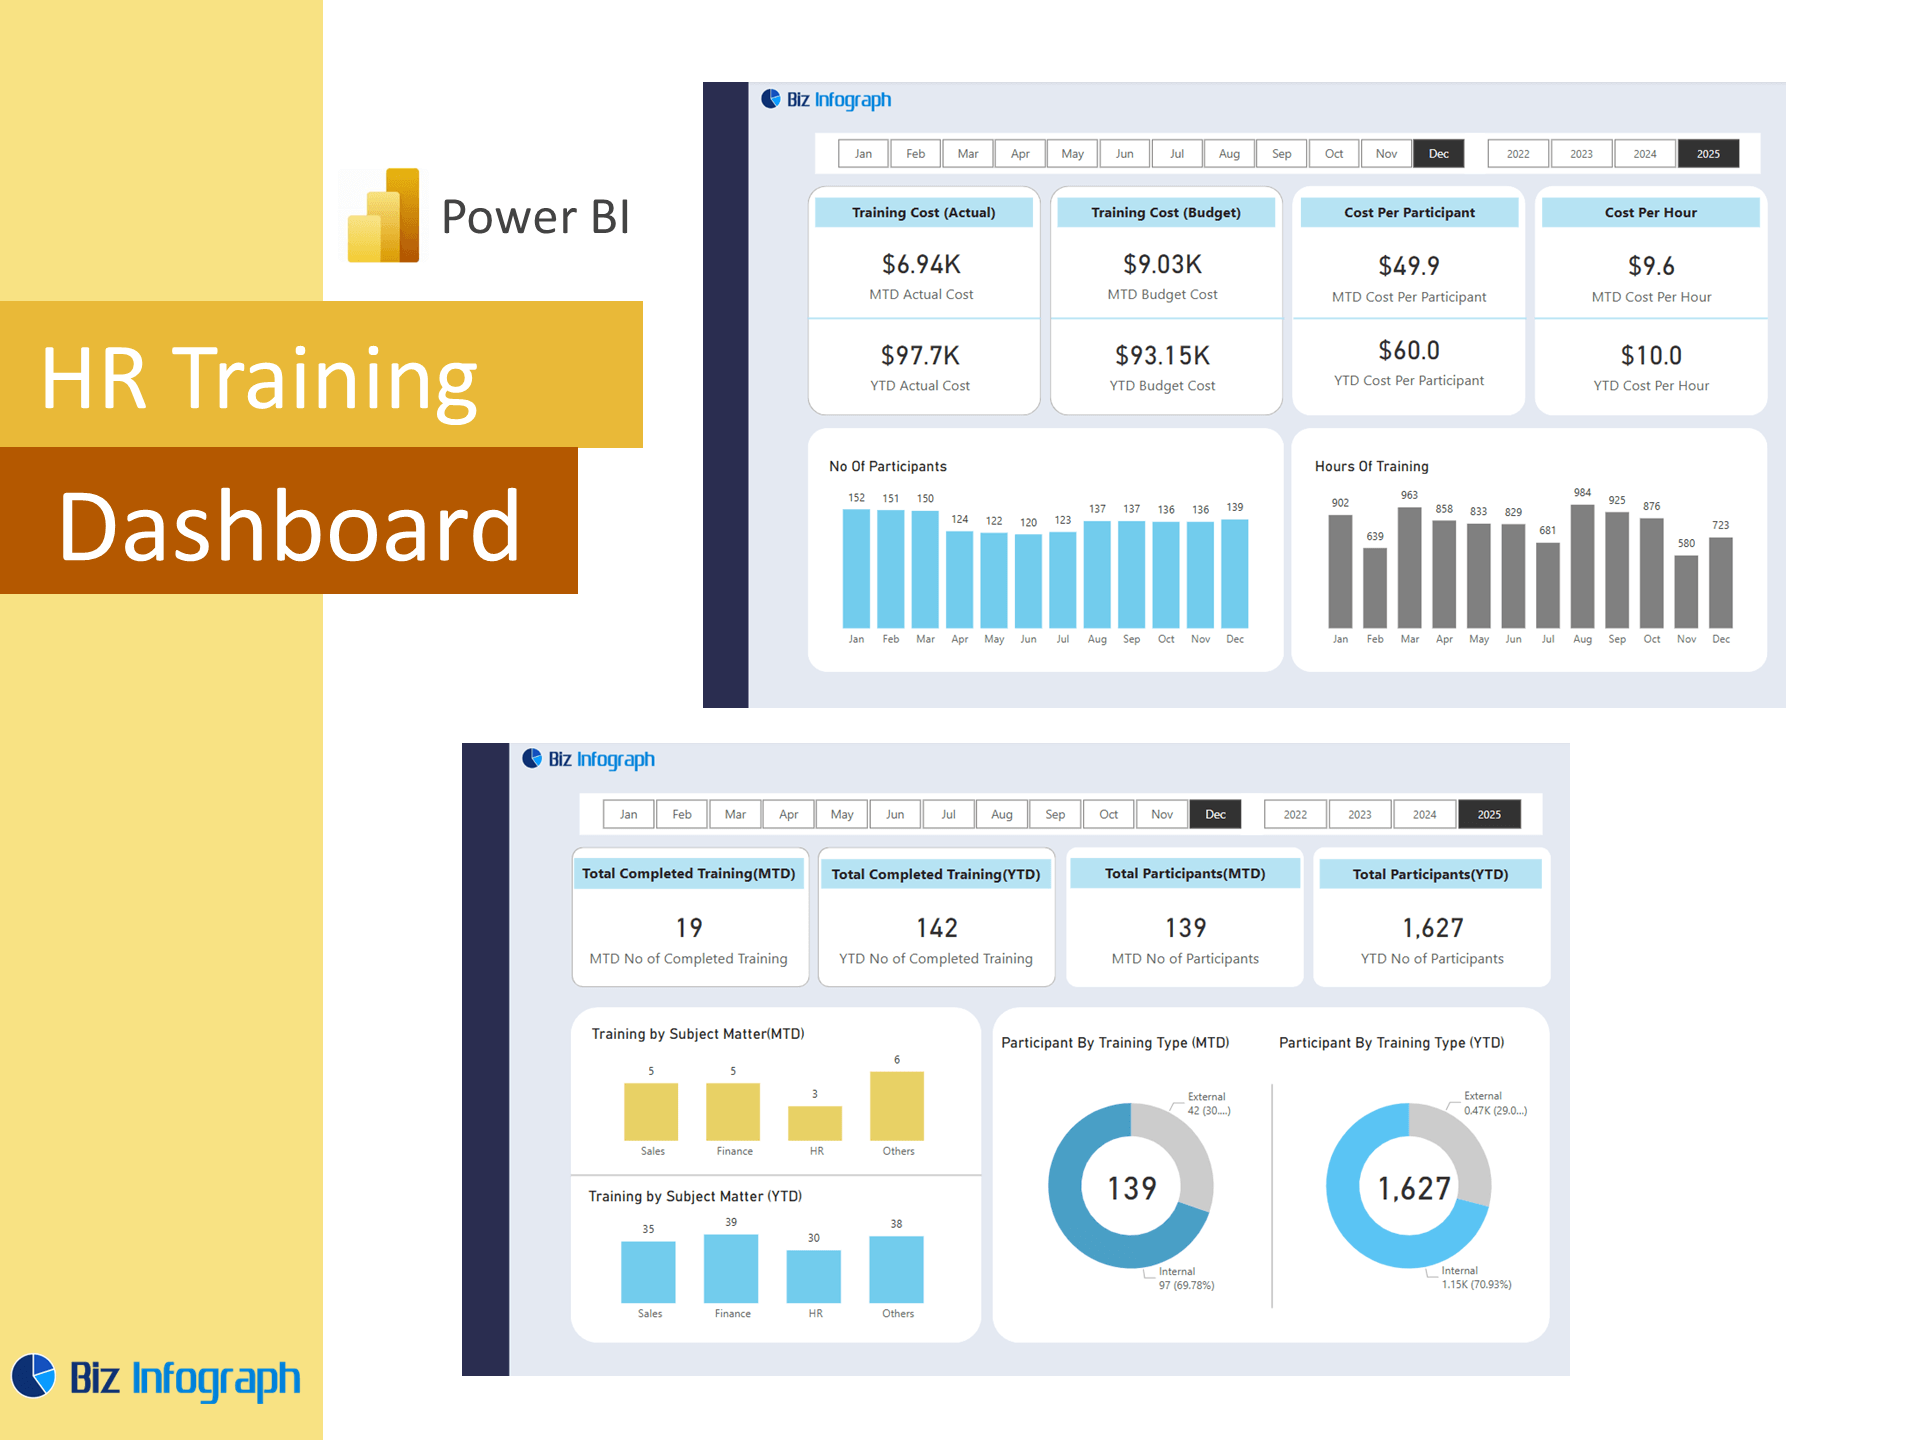
Creating a dynamic HR dashboard template begins with selecting a reliable dashboard power BI template or building one from scratch using Power BI’s modeling capabilities. Start by defining key datasets, such as hr data, employee performance, payroll history, analytics, and recruitment tracker dashboard logs. Use Power BI Human Resource template visuals like bar charts, KPIs, pie charts, and slicers to segment data by role, department, or region. Templates should be designed for usability—featuring clear tabs, filters, and export options. With well-structured HR dashboard power BI templates, the HR department can quickly replicate dashboards across time periods or business units, helping to support consistent HR reporting and effective decision-making.
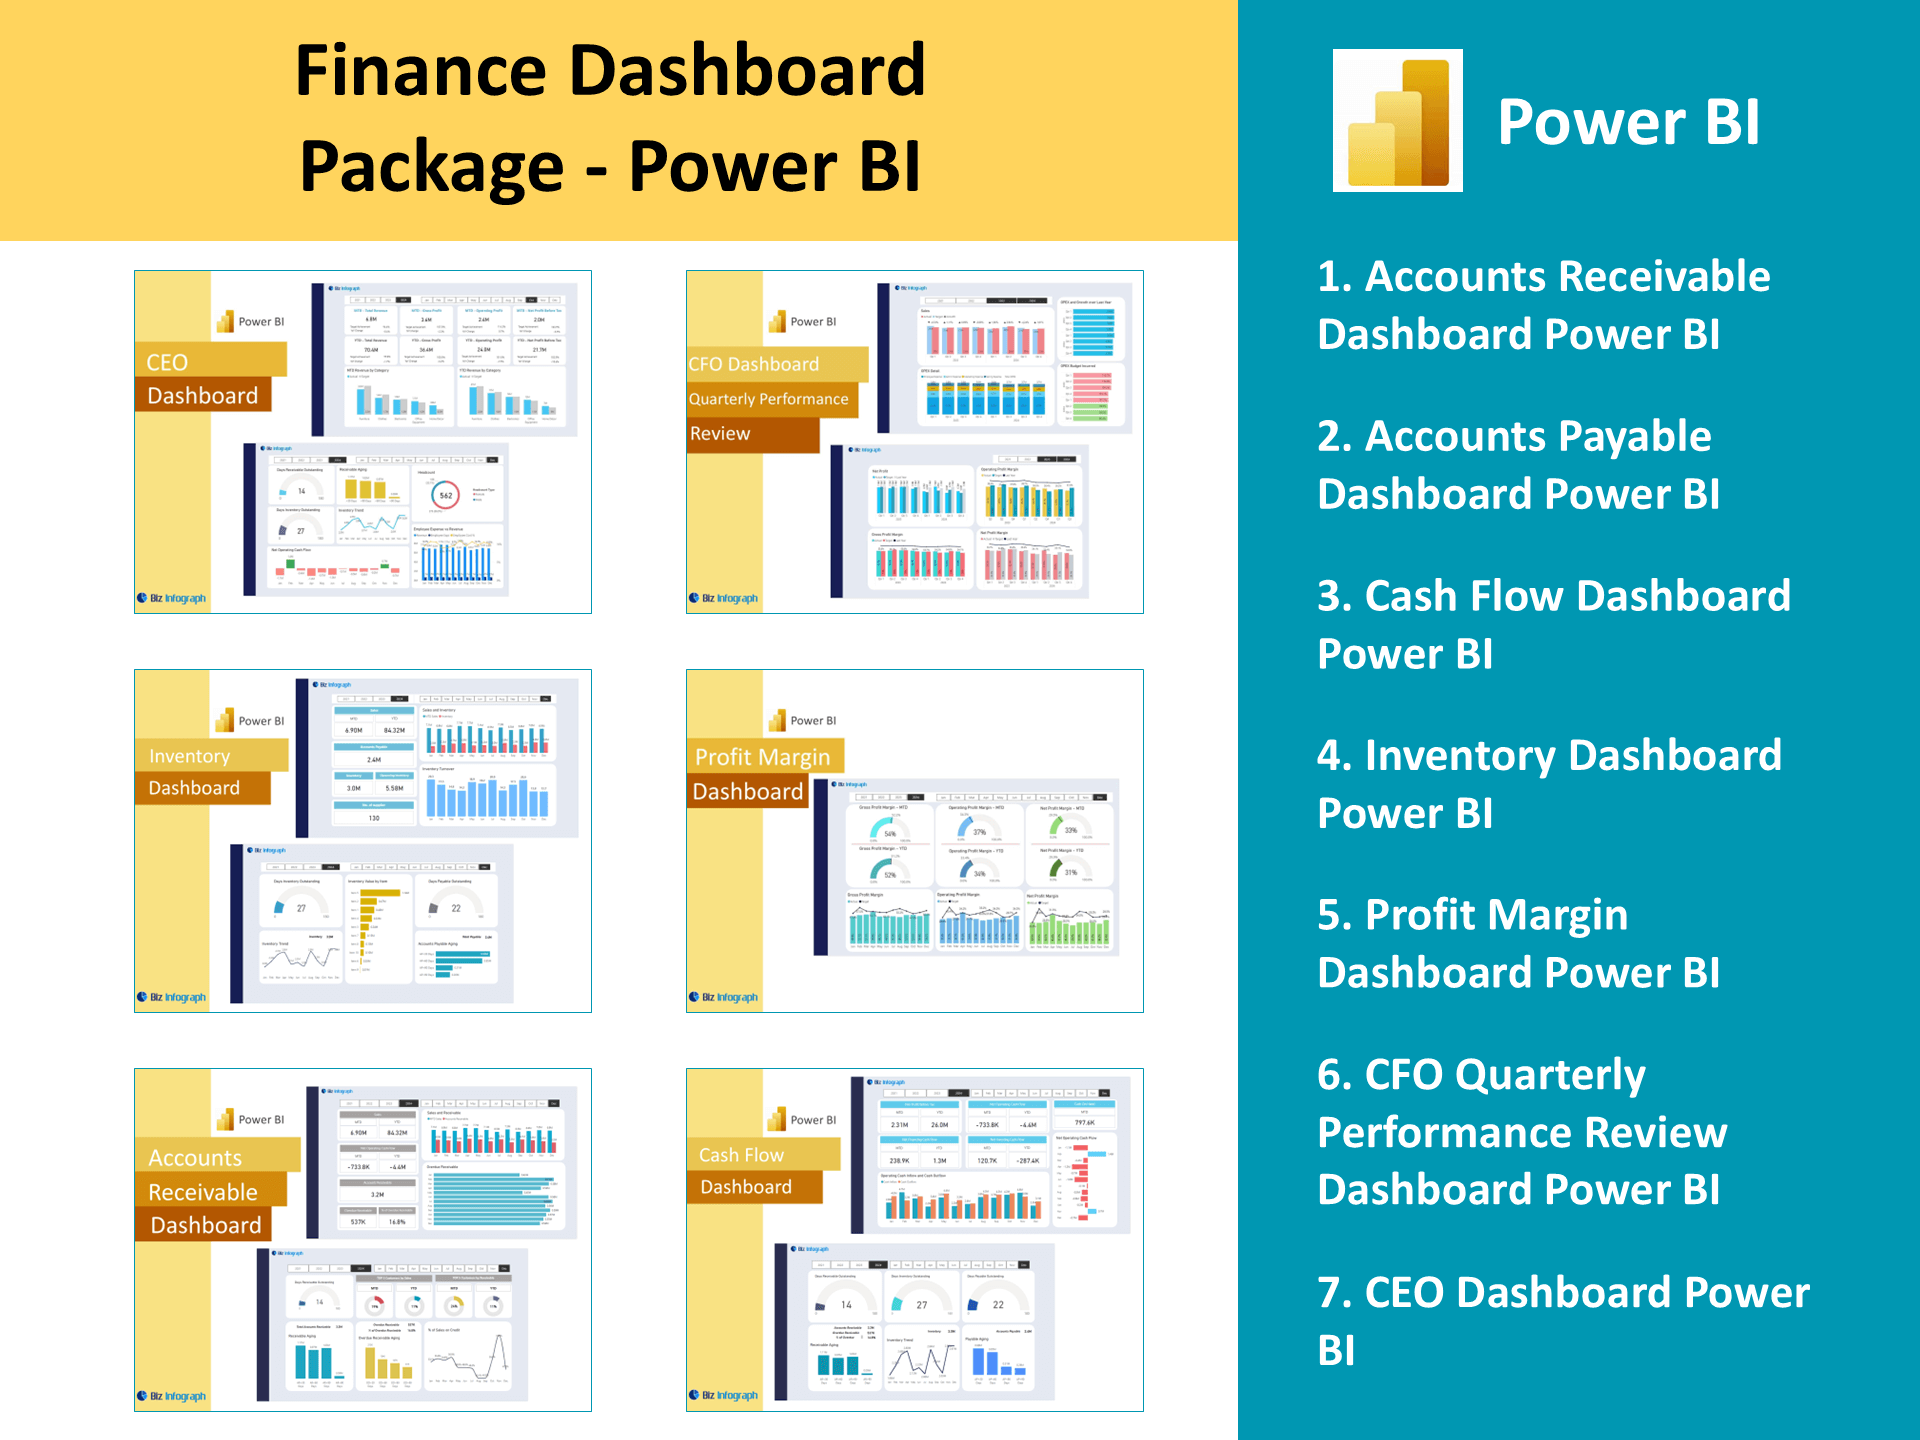
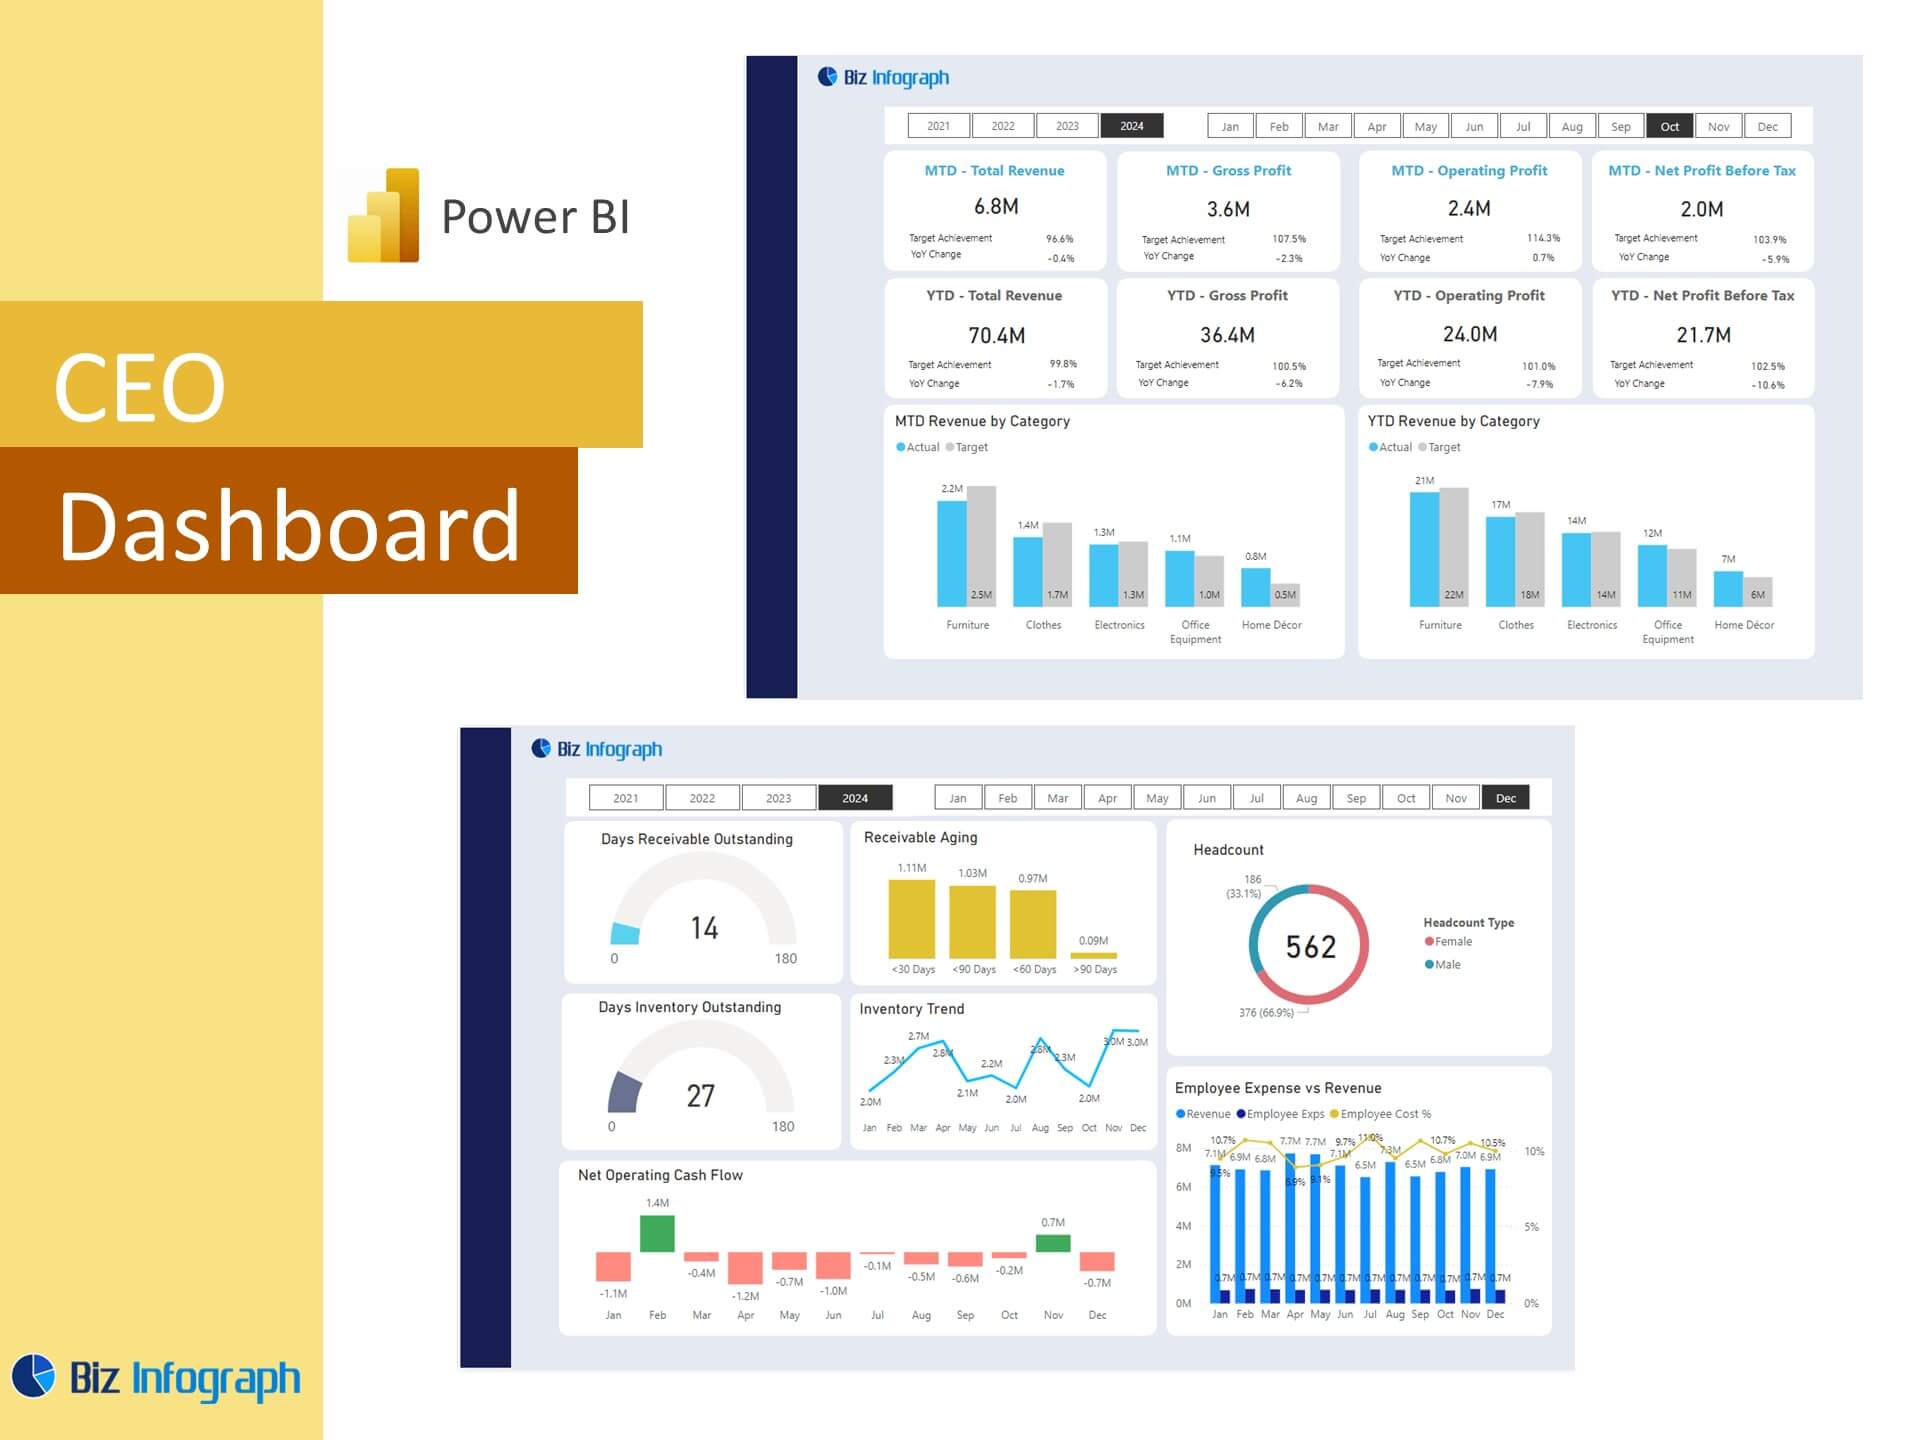
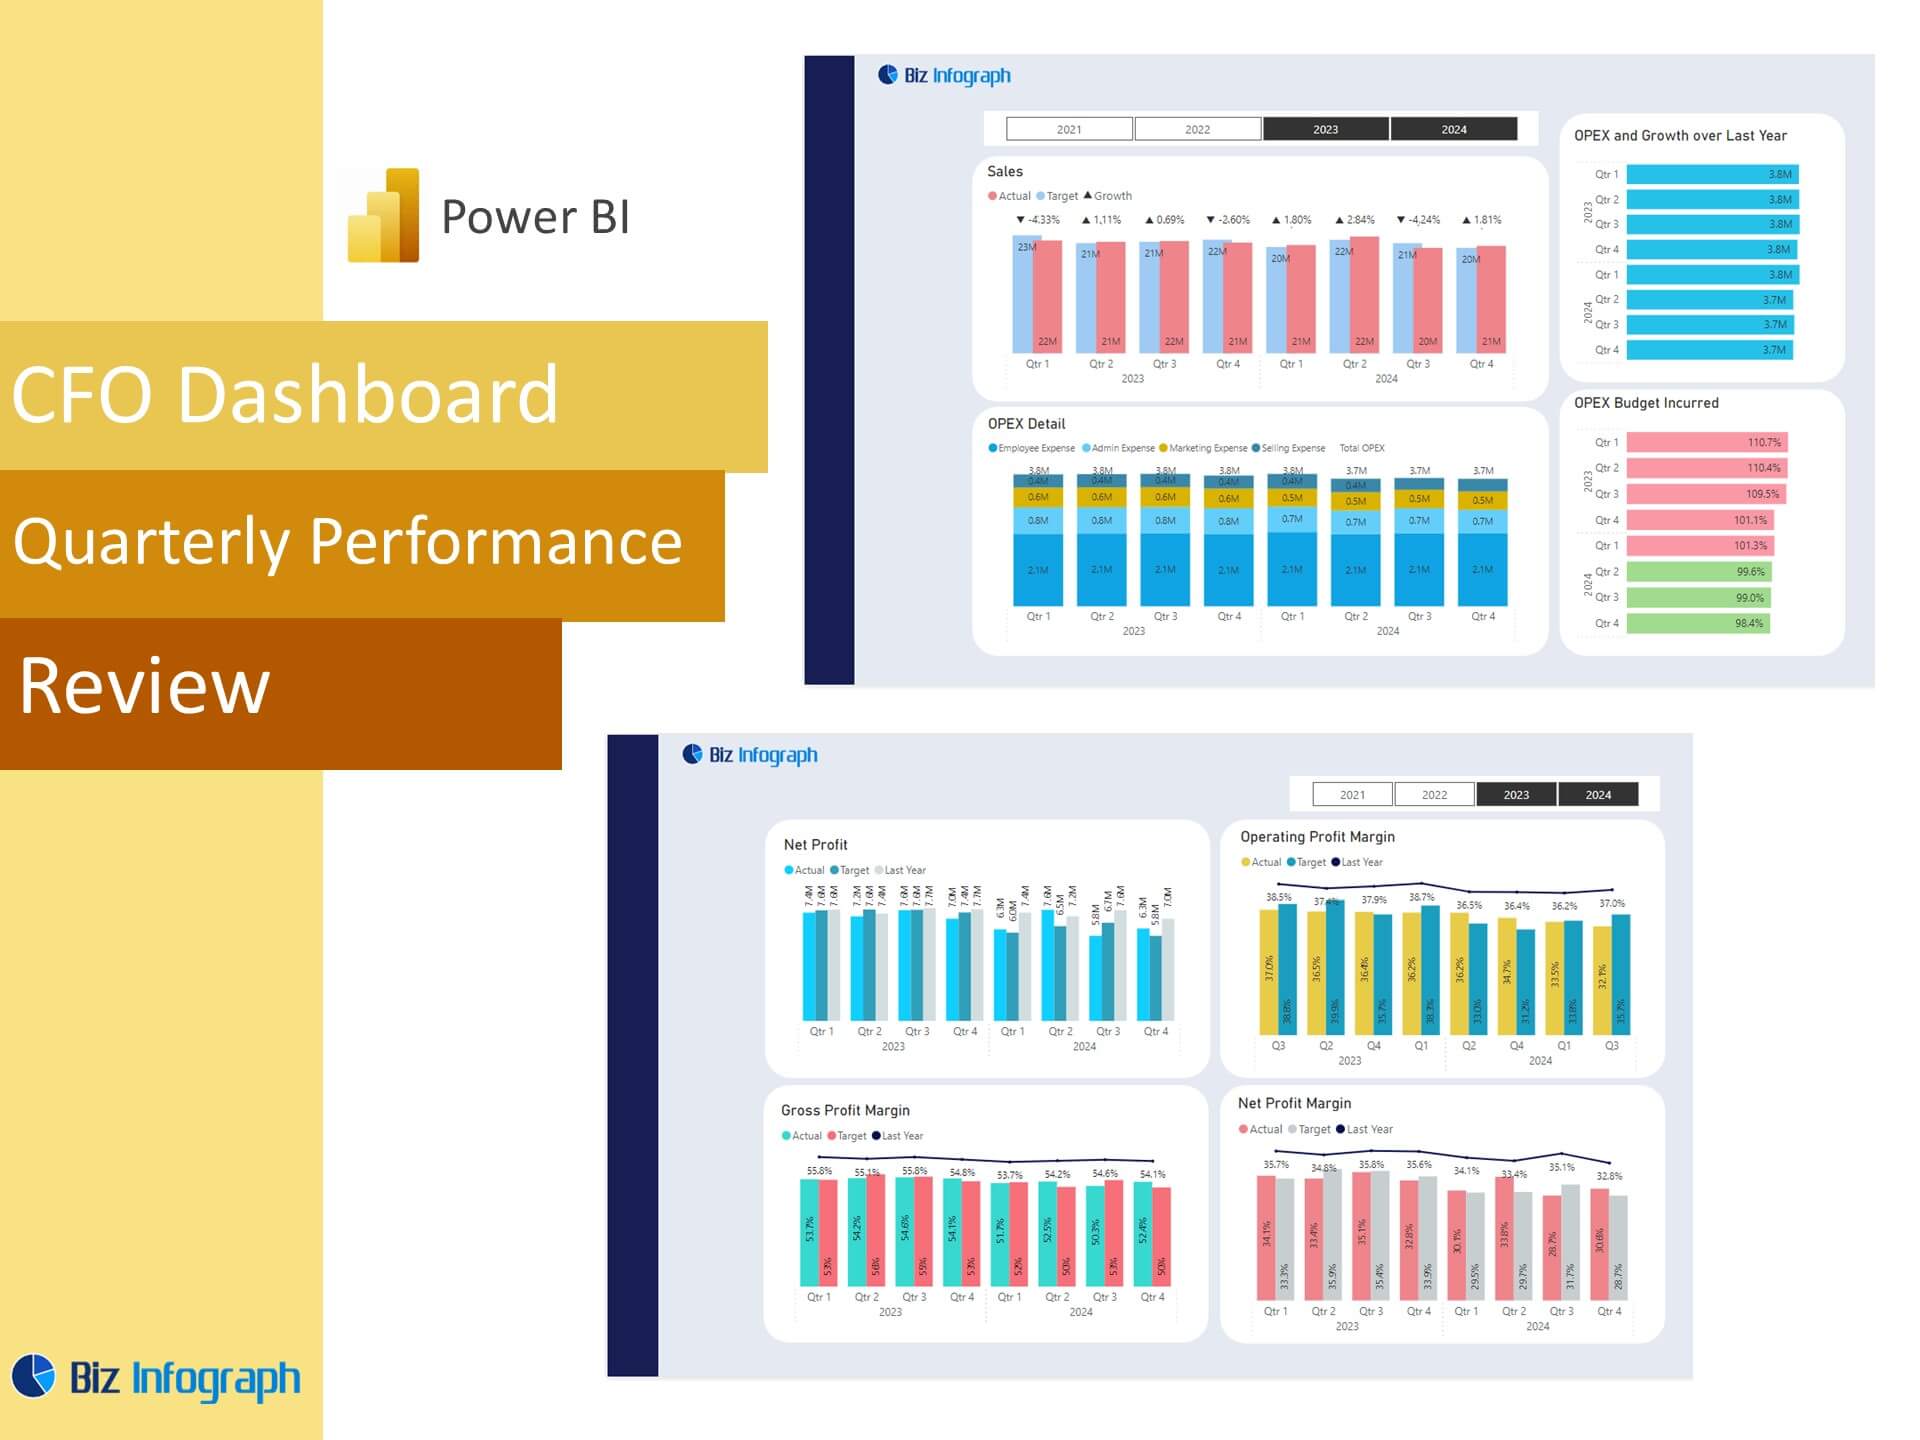
Best Power BI Dashboard Examples for HR and Payroll
Some of the best Power BI dashboard examples showcase integration across HR and finance, tracking payroll side-by-side with employee performance dashboards, sales dashboards, and even marketing dashboards. A great hr analytics dashboard power bi example will display salary distribution by level, total payroll trendlines, and variance by location or team. Advanced dashboards incorporate employee retention data, enabling analysis of how compensation impacts attrition. Others use HR Analytics dashboard templates to merge feedback dashboards or employee leave management reports for a comprehensive view. These dashboard examples reflect how multipurpose dashboards can serve multiple stakeholders and adapt to various HR management scenarios.
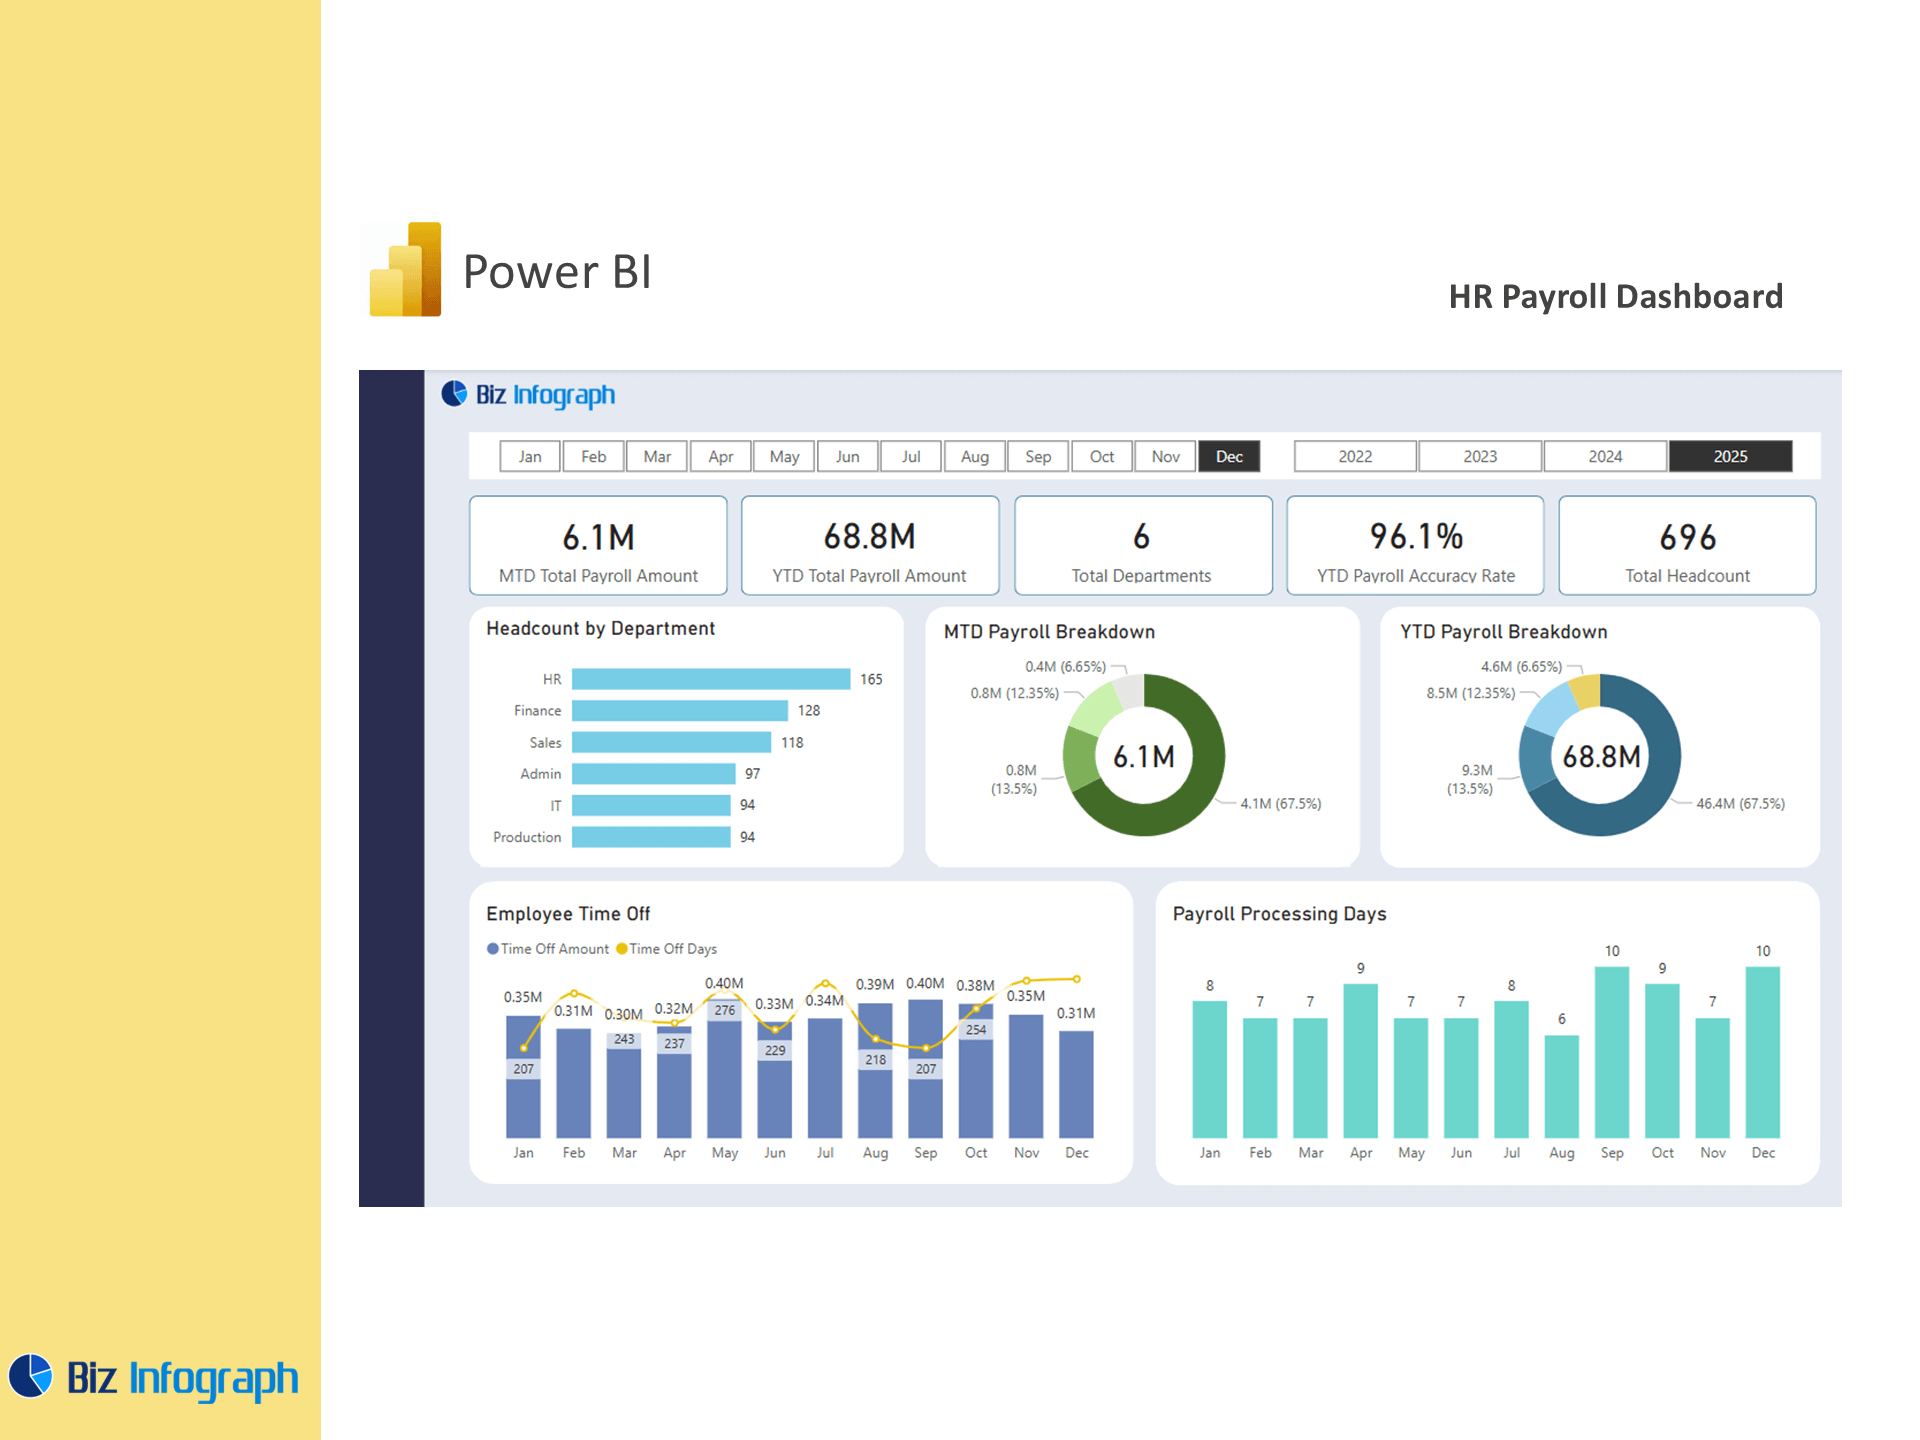
Data Automation and Visualization in HR Power BI Dashboards
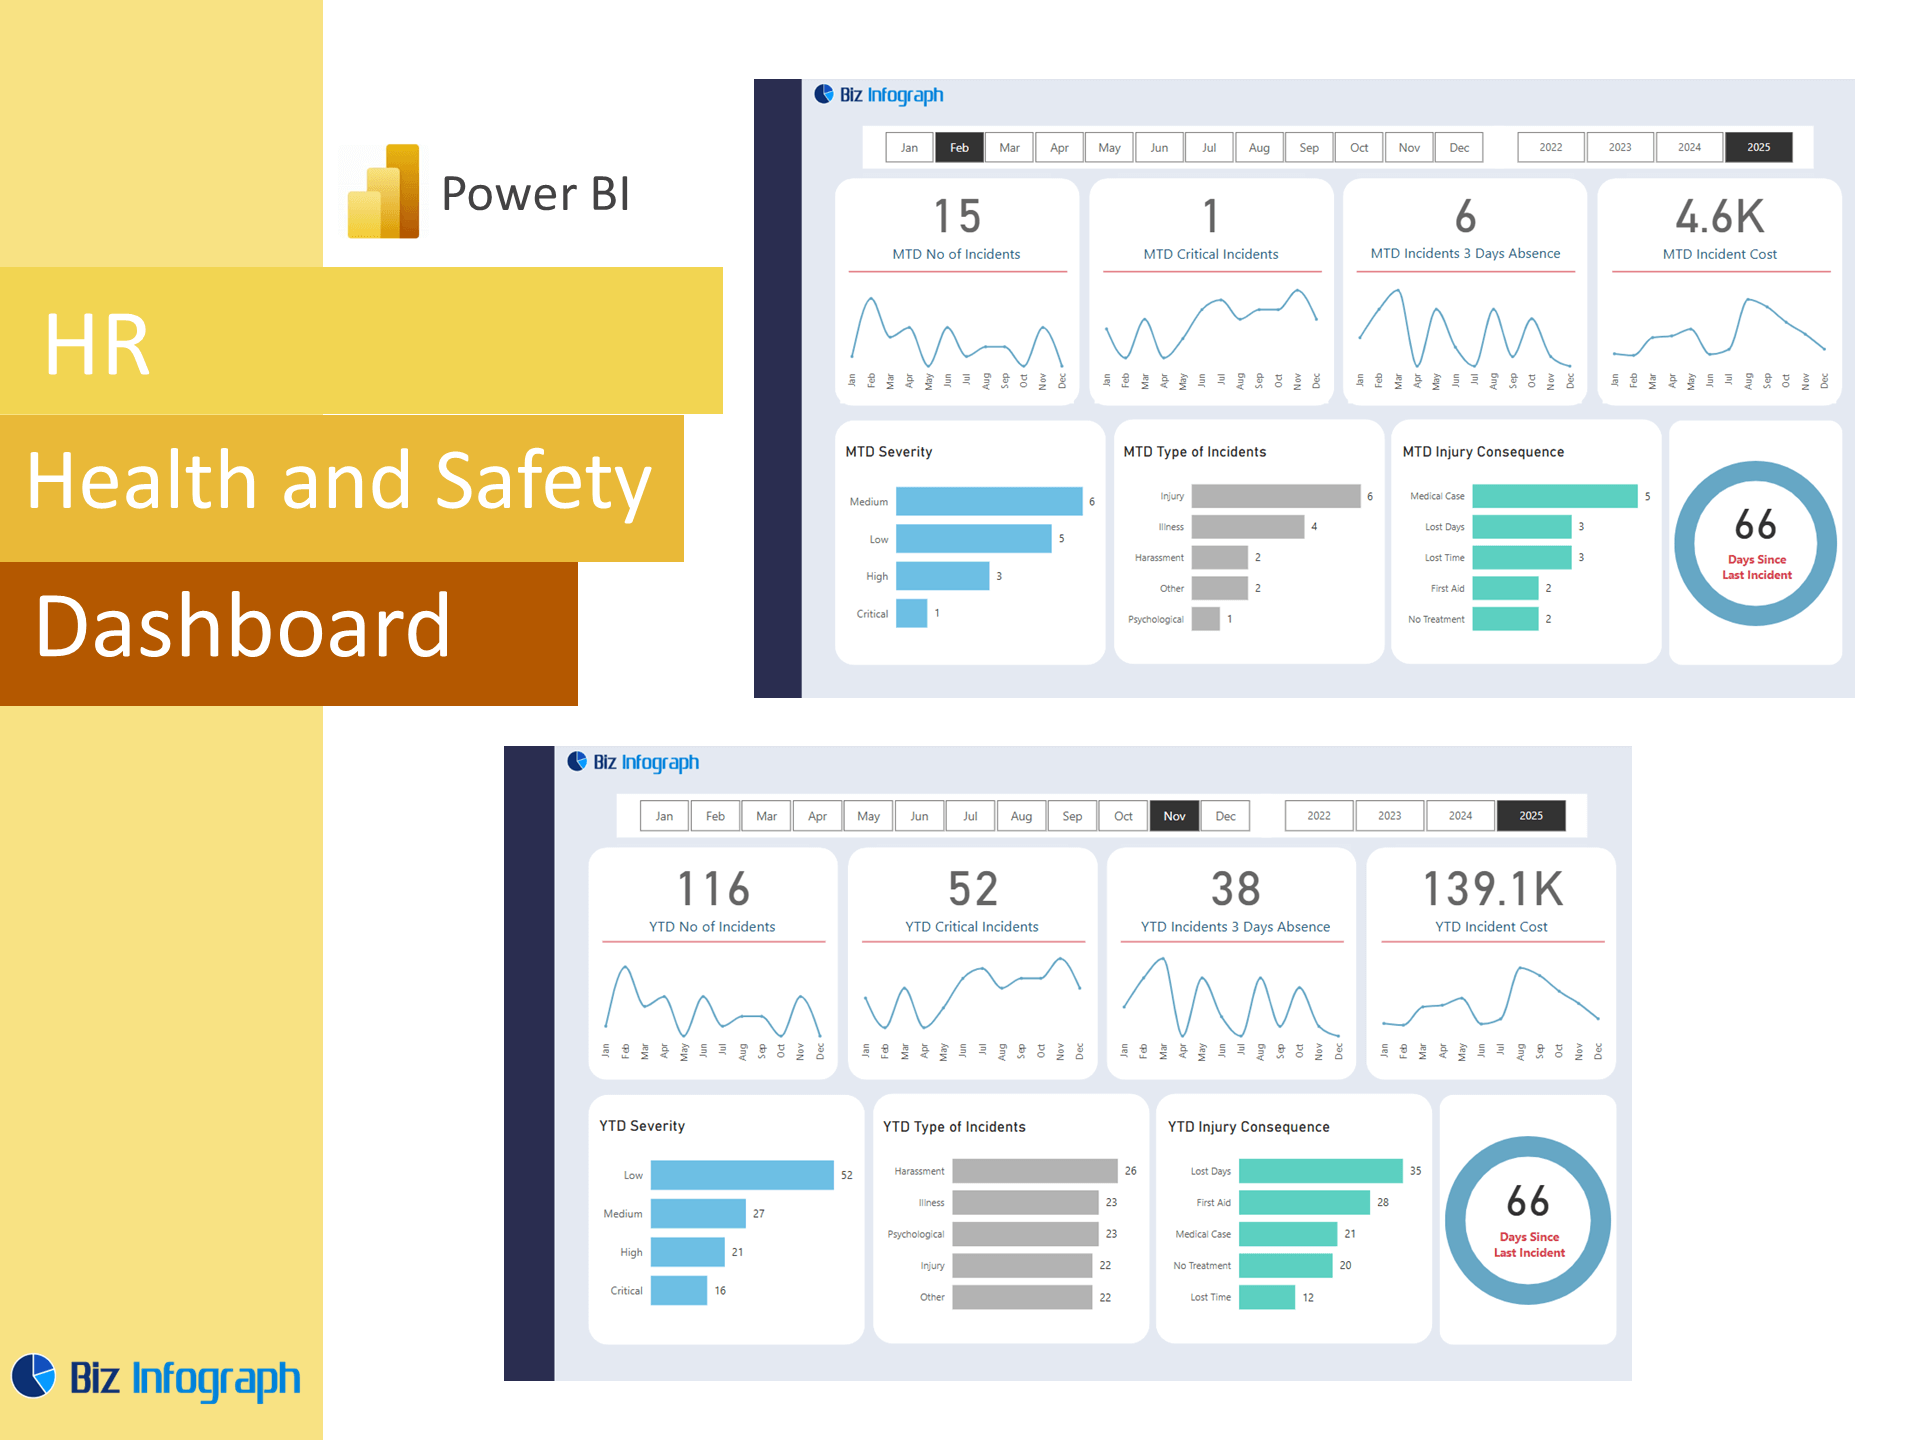
One of the key strengths of Power BI is its ability to support data automation and presentation through real-time updates and seamless integration. Payroll dashboards benefit from automated data pulls via APIs, Excel, or HR systems, minimizing the need for manual uploads. Using data visualization tools within Power BI, users can present complex data such as compensation breakdowns, HR training investment returns, and budget variance in digestible formats. Dashboard allows HR to visually analyze patterns, detect anomalies, and data effectively communicate payroll insights to finance or executive teams. Data insights and HR insights generated through this process lead to faster, more accurate data to make strategic workforce decisions.
Optimizing Workforce Management Through Analytics
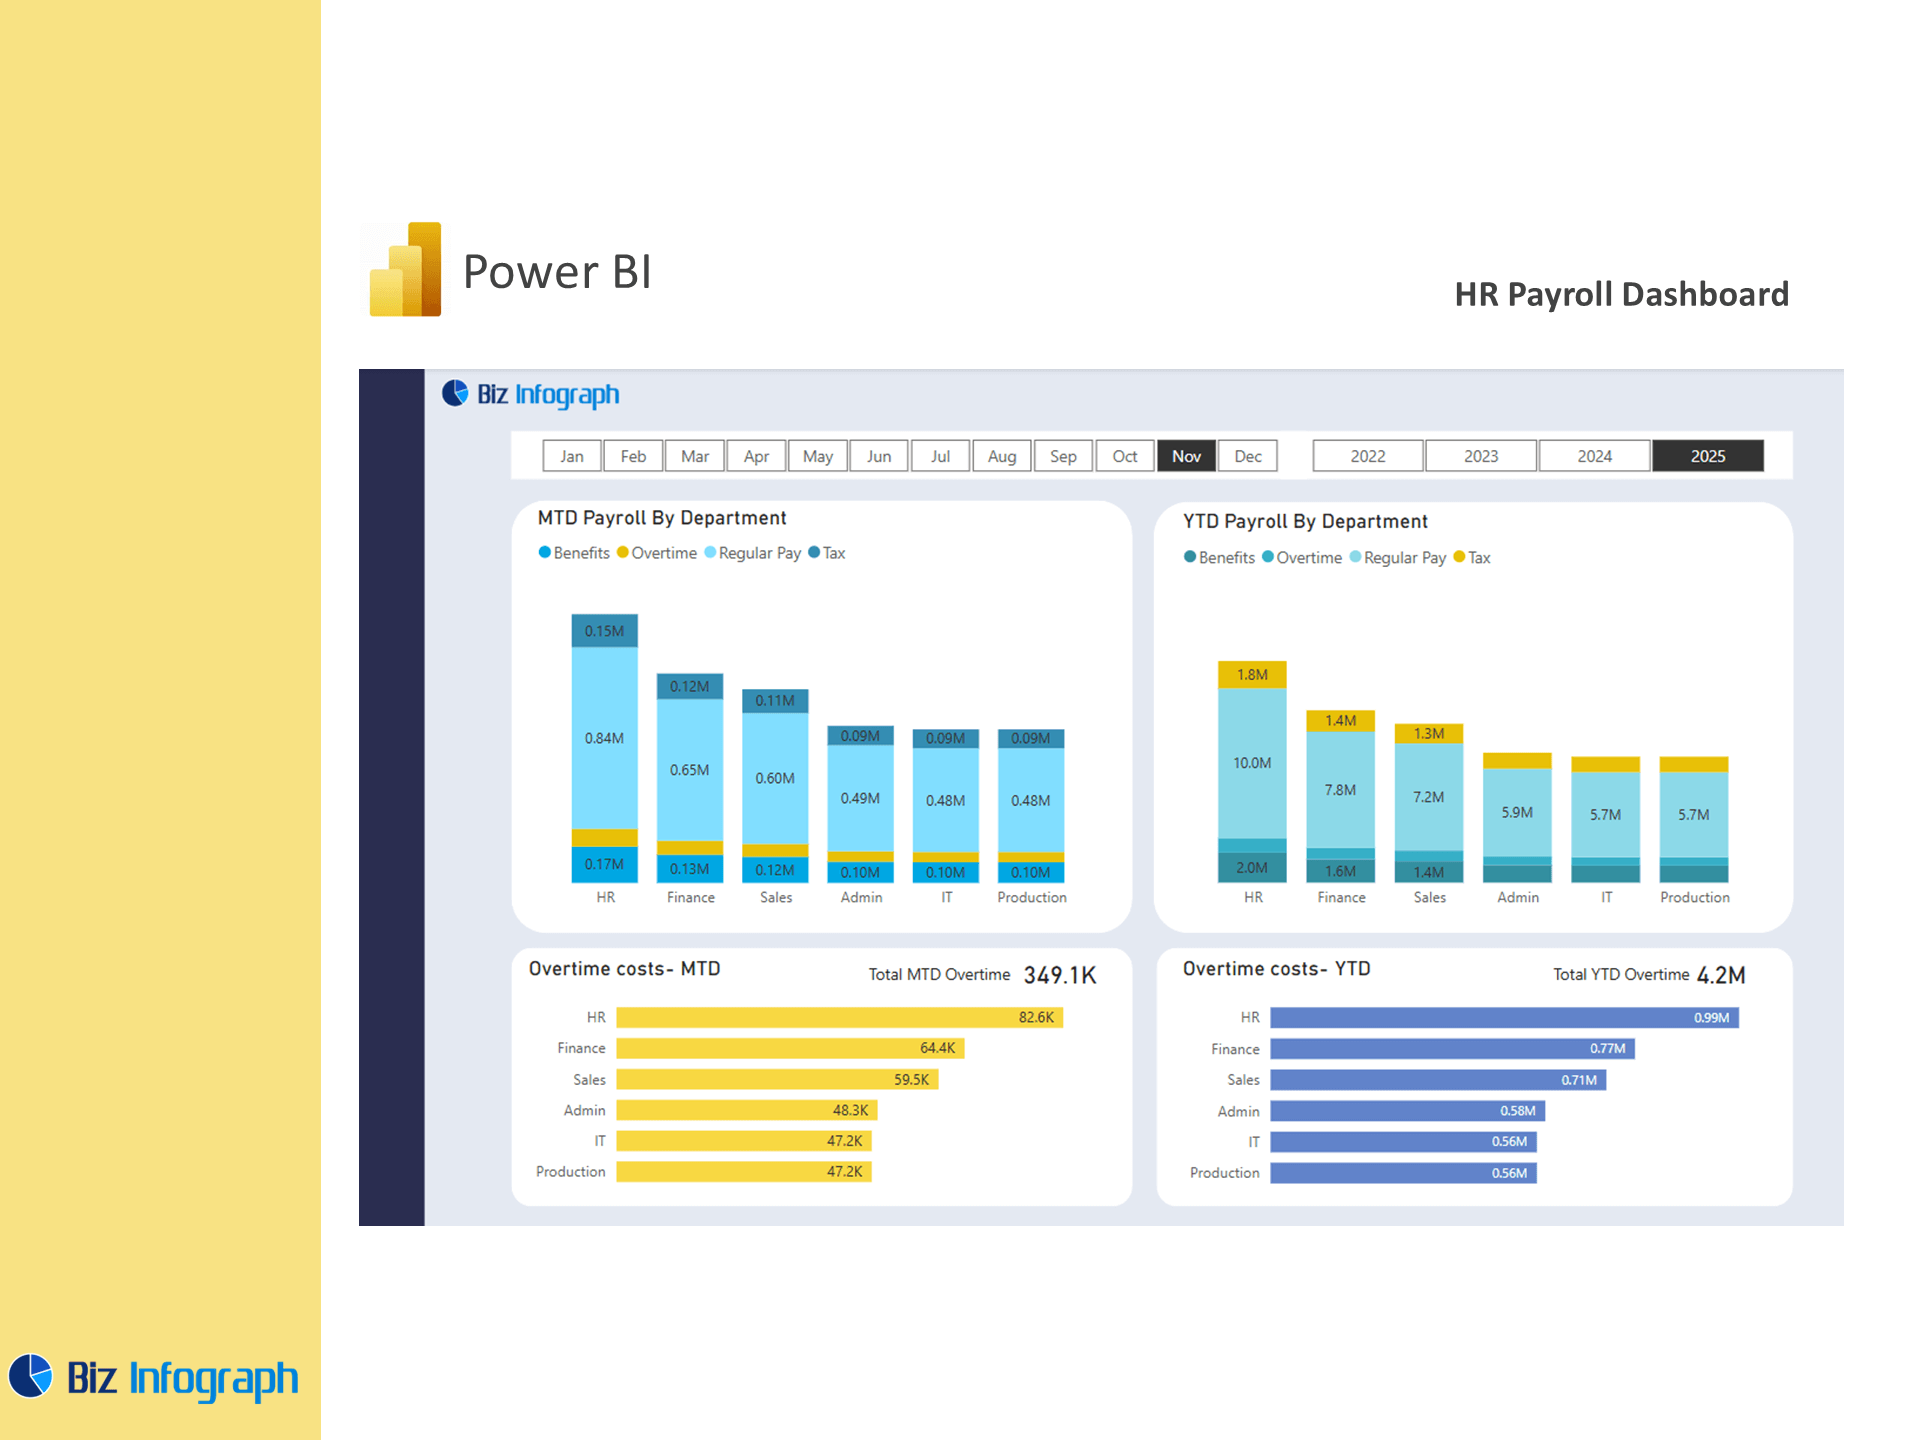
Improving HR Management with Key Performance Indicators
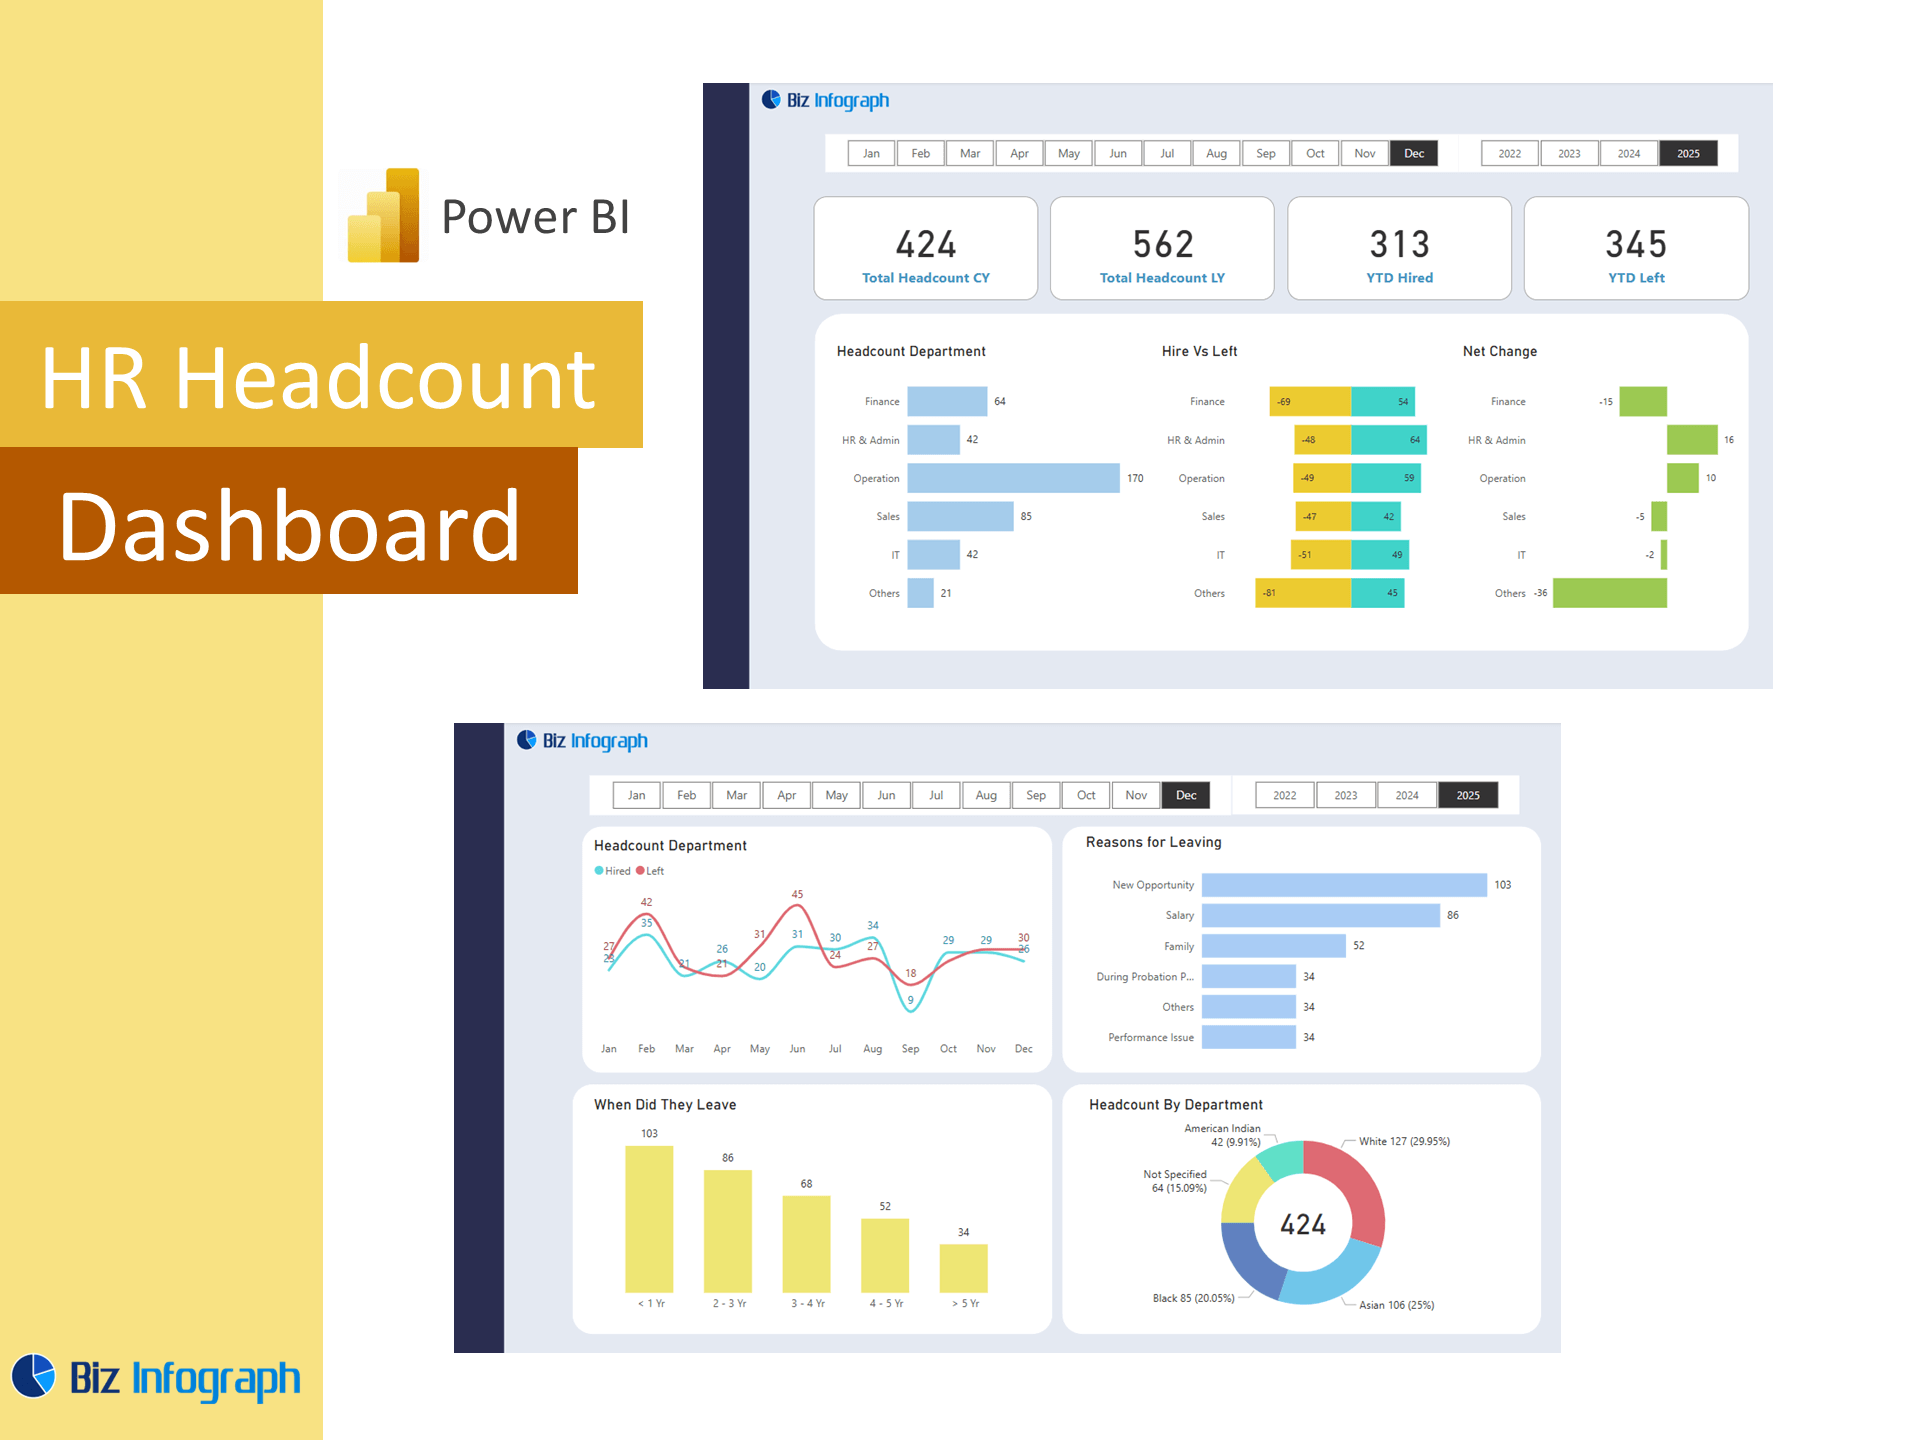
For HR management to be truly effective, it must be built on reliable, measurable key performance indicators. Dashboards using Power BI allow teams to track KPIs such as new employee salary impact, cost of employee churn, and payroll-to-revenue ratios. The HR kpi dashboard is also useful in monitoring employee overtime trends, compensation parity, and departmental payroll spend. By leveraging a dashboard designed for both real-time and historical analysis, HR managers can ensure that payroll decisions support broader strategic goals. These insights become particularly useful when paired with recruitment tracker dashboards or employee onboarding timelines to provide full context for compensation outcomes.
Using HR Payroll Dashboards to Support Employee Performance and Retention
A payroll dashboard integrated with employee performance dashboards can highlight the connection between compensation, rewards, and long-term employee retention. For instance, viewing salary data alongside performance review outcomes or promotion history enables HR professionals to assess if pay is aligned with contributions. Dashboards that include employee satisfaction or feedback dashboards further enrich the analysis by showing how compensation affects morale and engagement. These tools help HR teams take a more proactive approach to reward strategy, identifying gaps and ensuring that high performers are recognized and retained. This ultimately improves workforce motivation and helps organizations reduce turnover-related costs.
Templates and Tools to Help HR Teams Visualize Payroll Insights
For HR teams to succeed, access to the right dashboard templates, tools, and automation processes is essential. Whether using a google sheet template, a tracker excel template, or a fully developed power bi dashboard report – axis, visualization tools make it easier to interpret and share important HR data. Prebuilt HR dashboard packages often come with KPI layouts, data connections, and formatting rules, enabling faster deployment. Combining employee dashboard templates with recruitment and training data gives the team a complete picture of payroll’s role in overall planning. This visualization capability empowers teams to take ownership of insights and lead data tracking initiatives confidently.
For ready-to-use Dashboard Templates: