HR Training Power BI Dashboard
Introduction to HR Training Dashboards in Power BI
What Is an HR Training Dashboard in Power BI?
An HR Training Dashboard in Power BI is an analytics dashboard designed specifically for the HR department to track, measure, and improve training and development efforts across the organization. Built with Power BI HR Dashboard capabilities, it allows HR professionals to monitor training initiatives by job role, department, or tenure, and assess their impact on employee performance, retention, and employee satisfaction. By integrating data sources like LMS platforms, internal HR systems, or Excel files, the dashboard in Power BI consolidates all relevant information into a single view. This dashboard is a powerful tool for aligning learning with business goals and ensuring that HR strategies are built on data rather than intuition.
Why Microsoft Power BI Is Ideal for HR Training Analytics
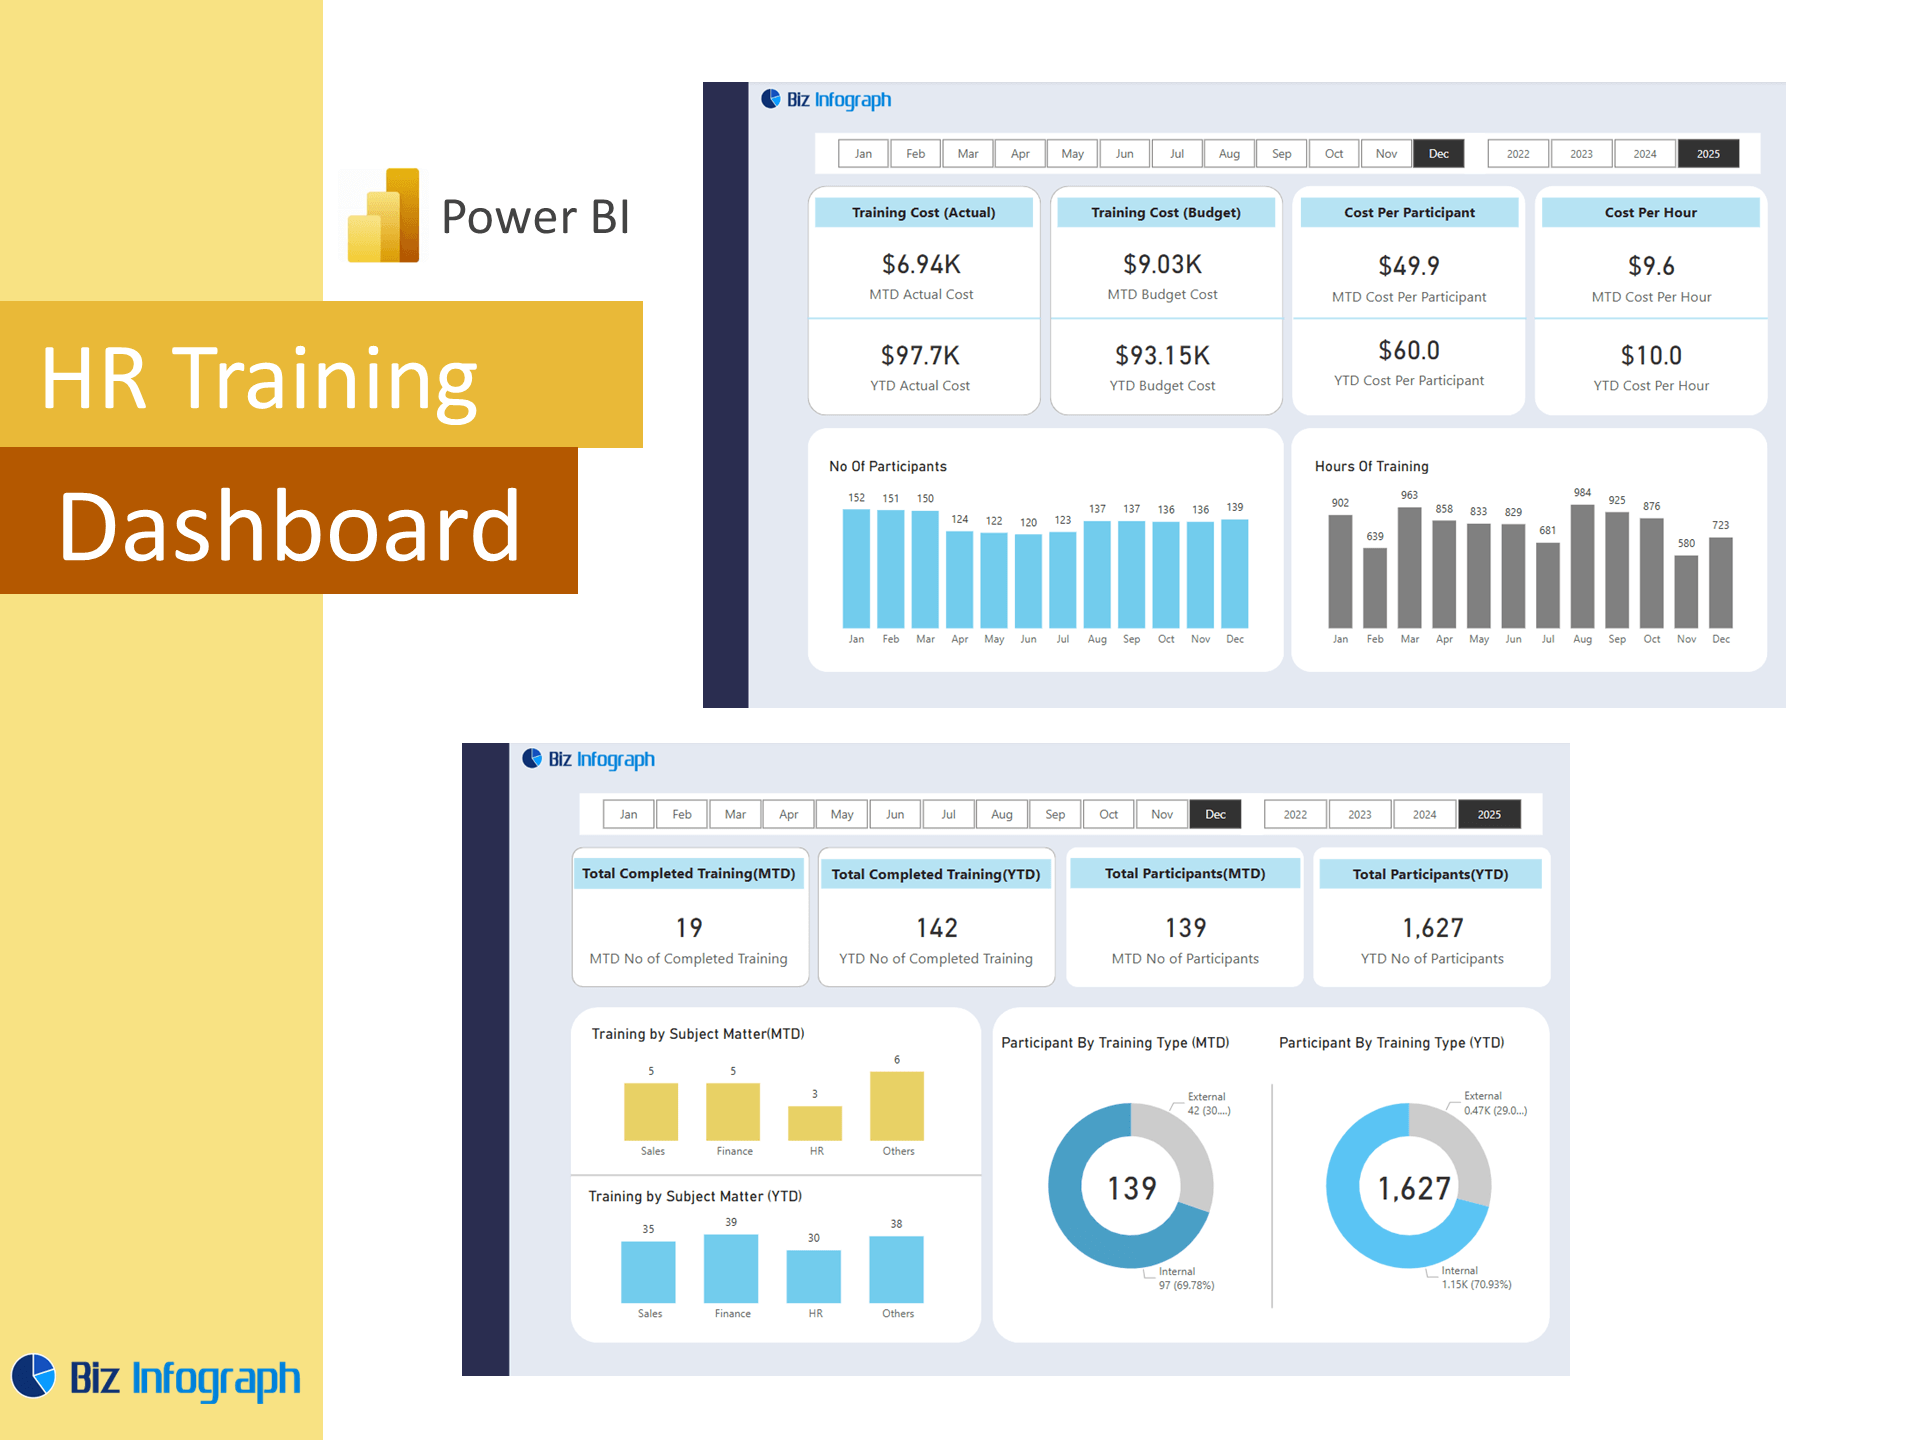
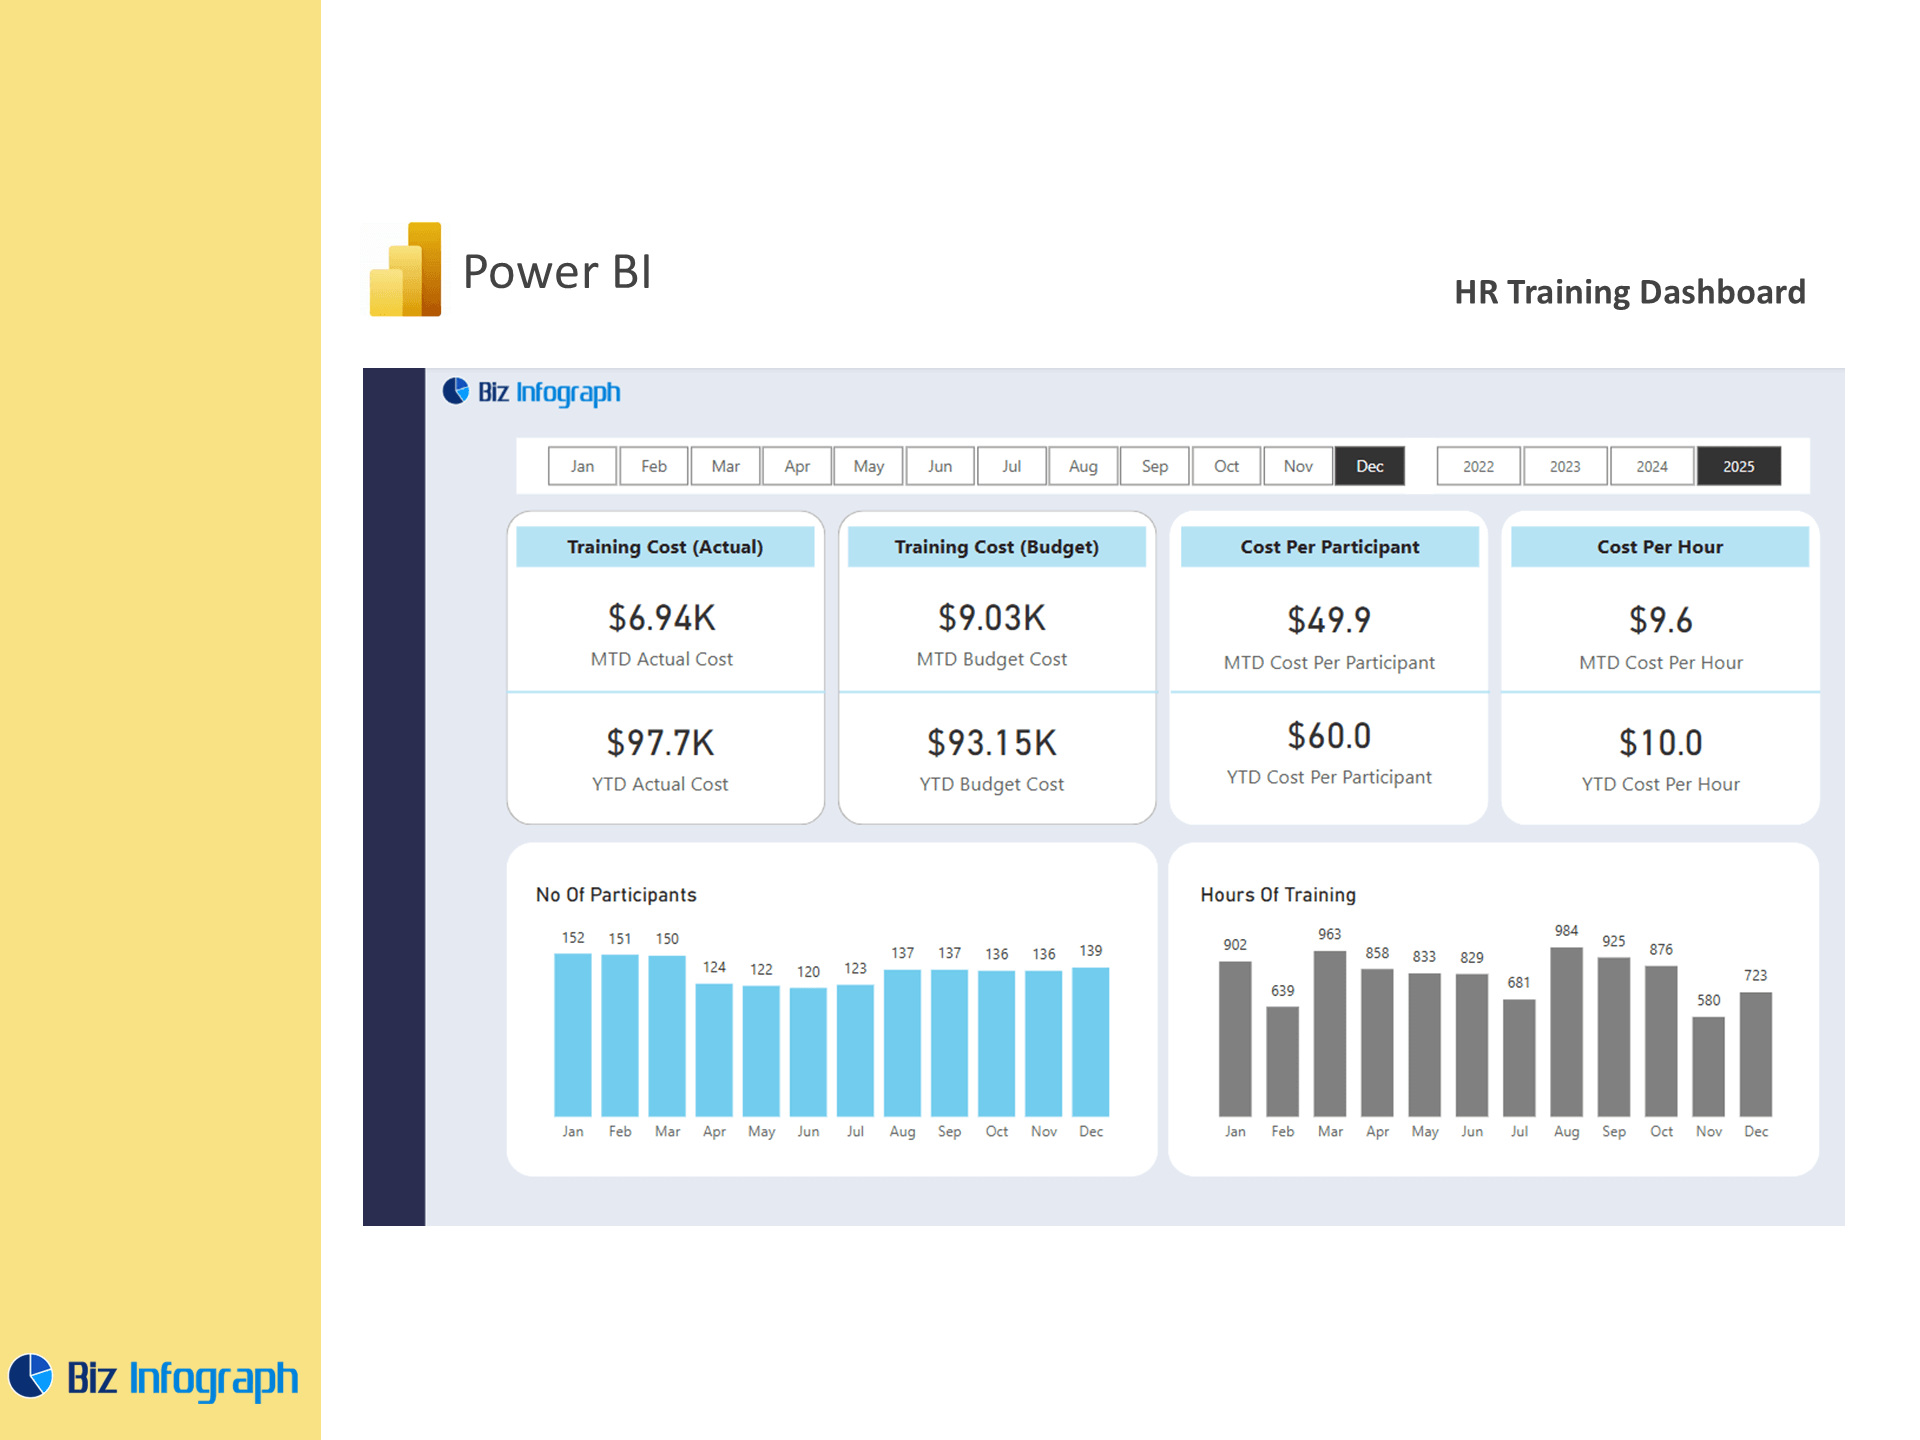
Microsoft Power BI offers a feature-rich, scalable environment perfect for HR training analytics. Its robust HR data analysis and data visualization capabilities help HR teams convert raw data into valuable insights that improve decision-making. With tools like Power BI Desktop and Power BI Service, teams can build interactive dashboards that track training hours, participation rates, course completions, and skill development over time. Power BI for HR also supports seamless data using Power Query, allowing for accurate, real-time metrics even from complex, multi-source datasets. These features enable HR departments to spot training gaps, optimize content, and demonstrate the measurable value of training programs to executives.
Key Benefits of Using Power BI Dashboards for HR Training
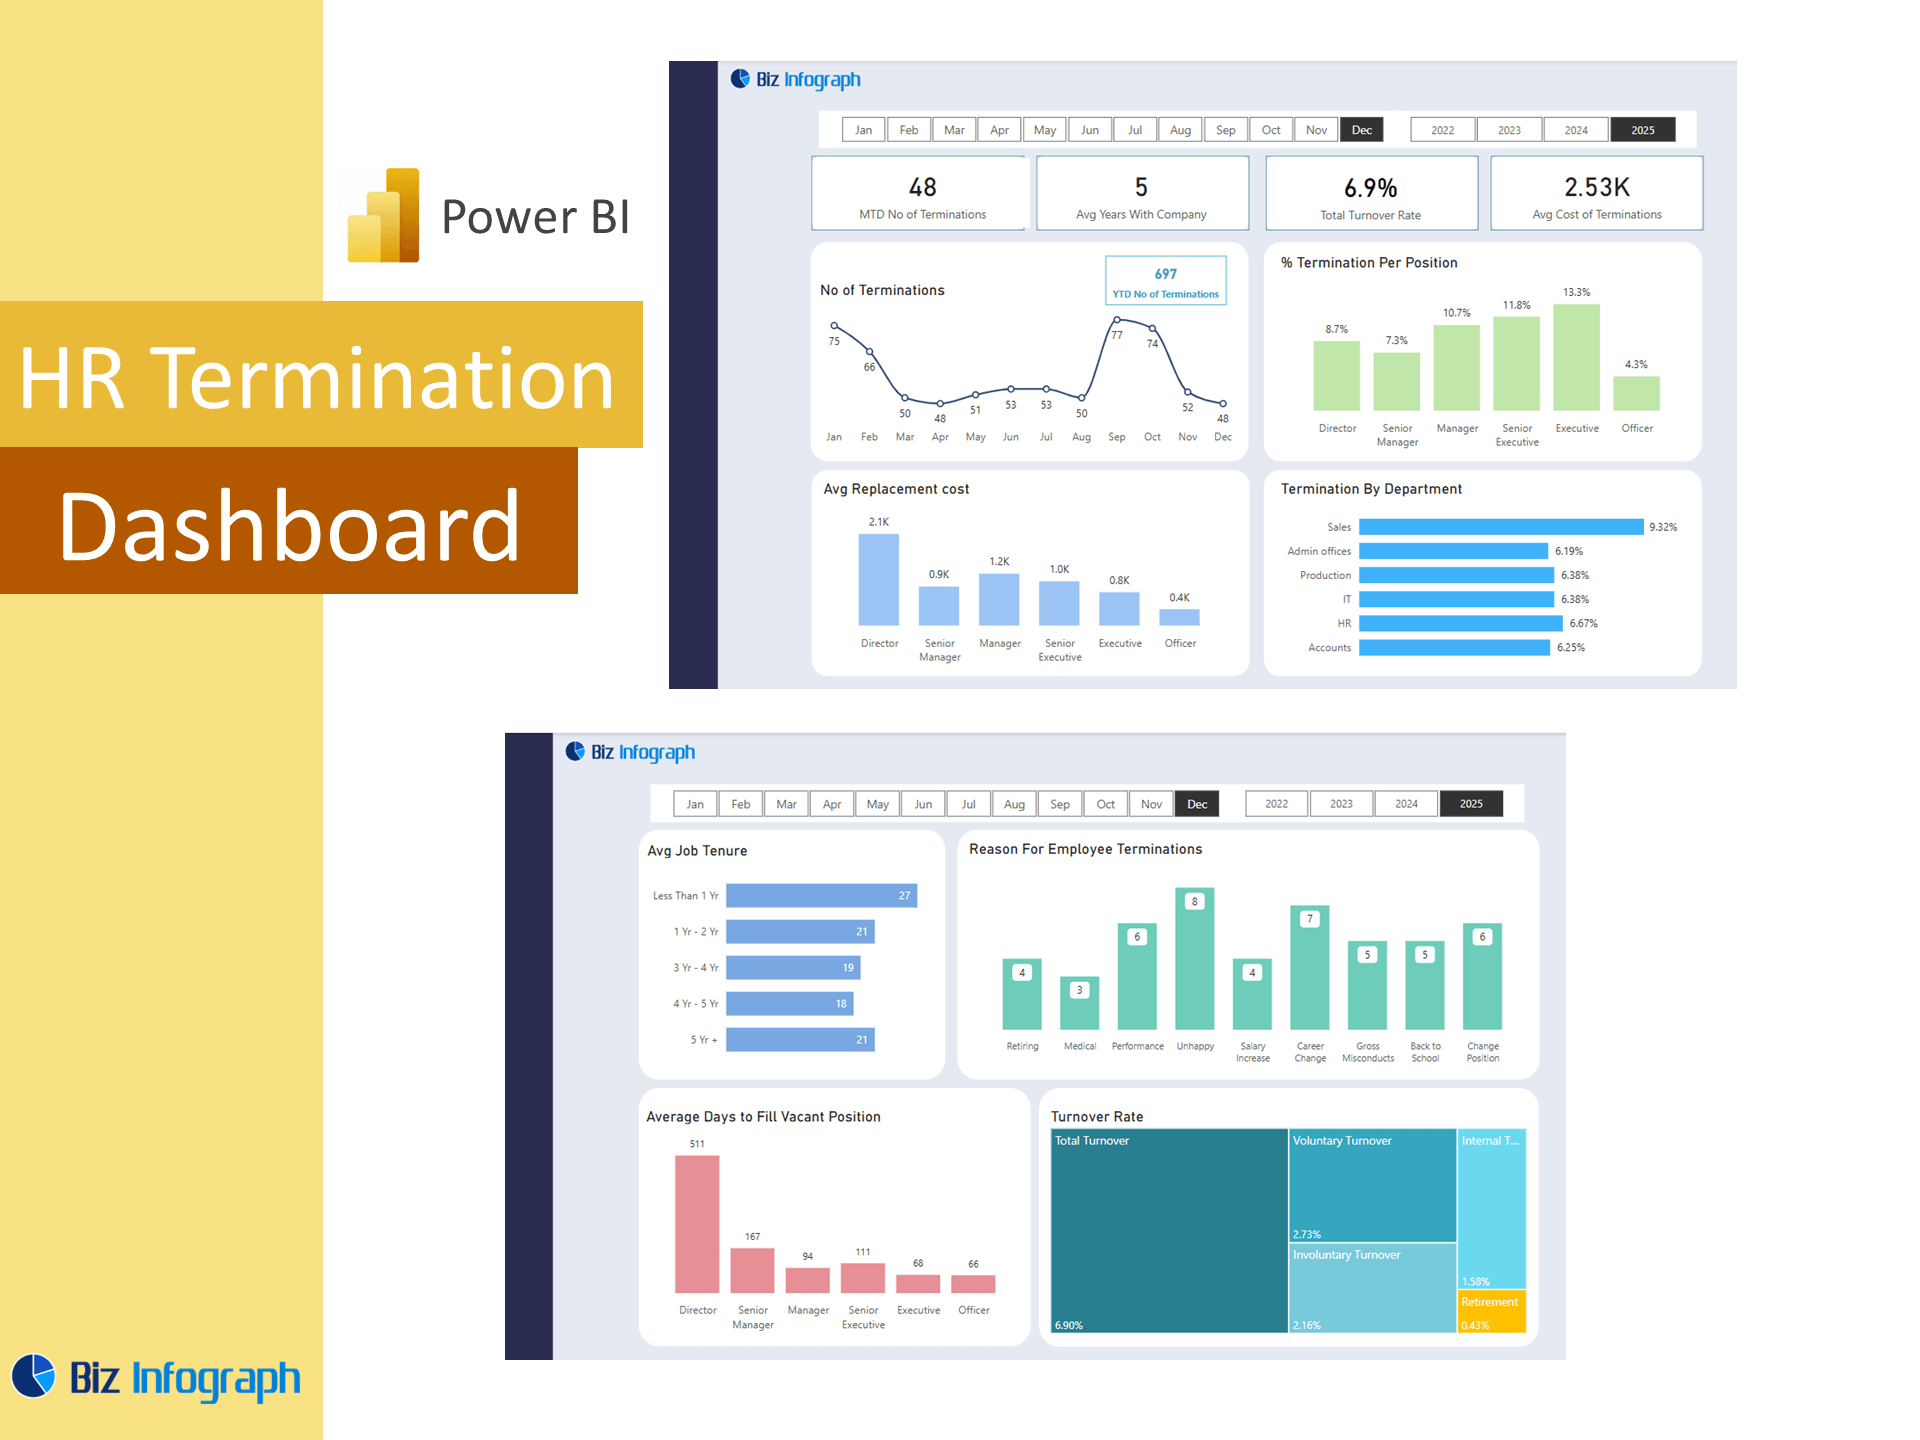
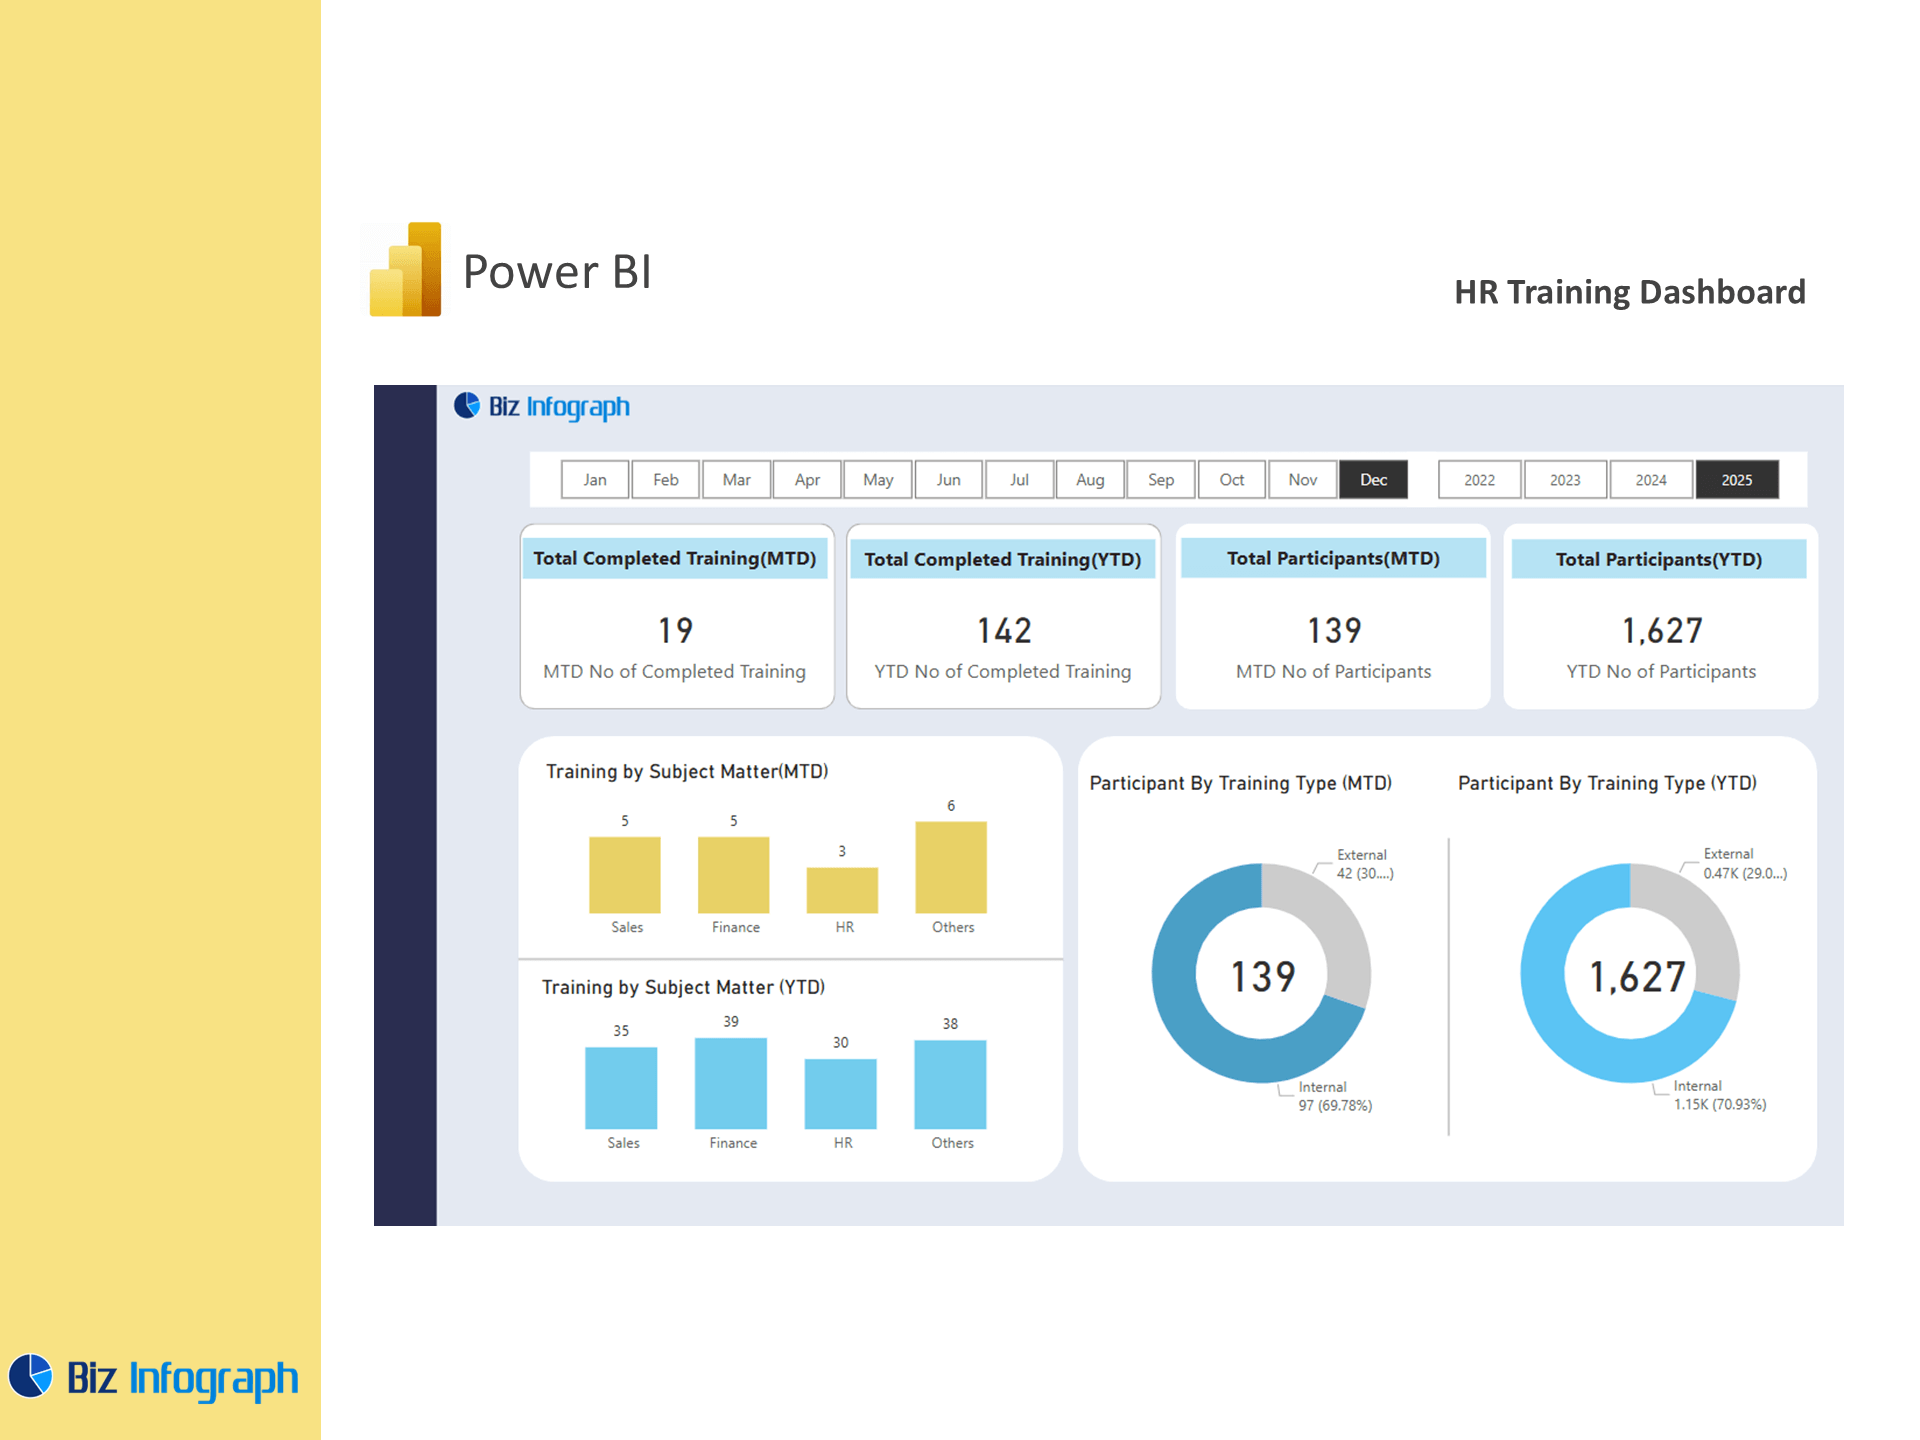
One of the core advantages of dashboard using Power BI is the ability to create tailored, intuitive visuals that support HR management with Power BI. These dashboards allow HR managers to track the total number of employees enrolled in training, analyze completion rates, Employee turnover rate, and correlate course outcomes with employee performance dashboards. Unlike static reports, Power BI dashboards update in real time and are accessible through the cloud-based Power BI Service, ensuring that insights are always current. The platform’s flexibility makes it easy to adapt dashboards to specific HR needs, such as leadership development tracking or compliance training performance, supporting a more agile and efficient approach to learning.
Designing and Building the HR Training Dashboard
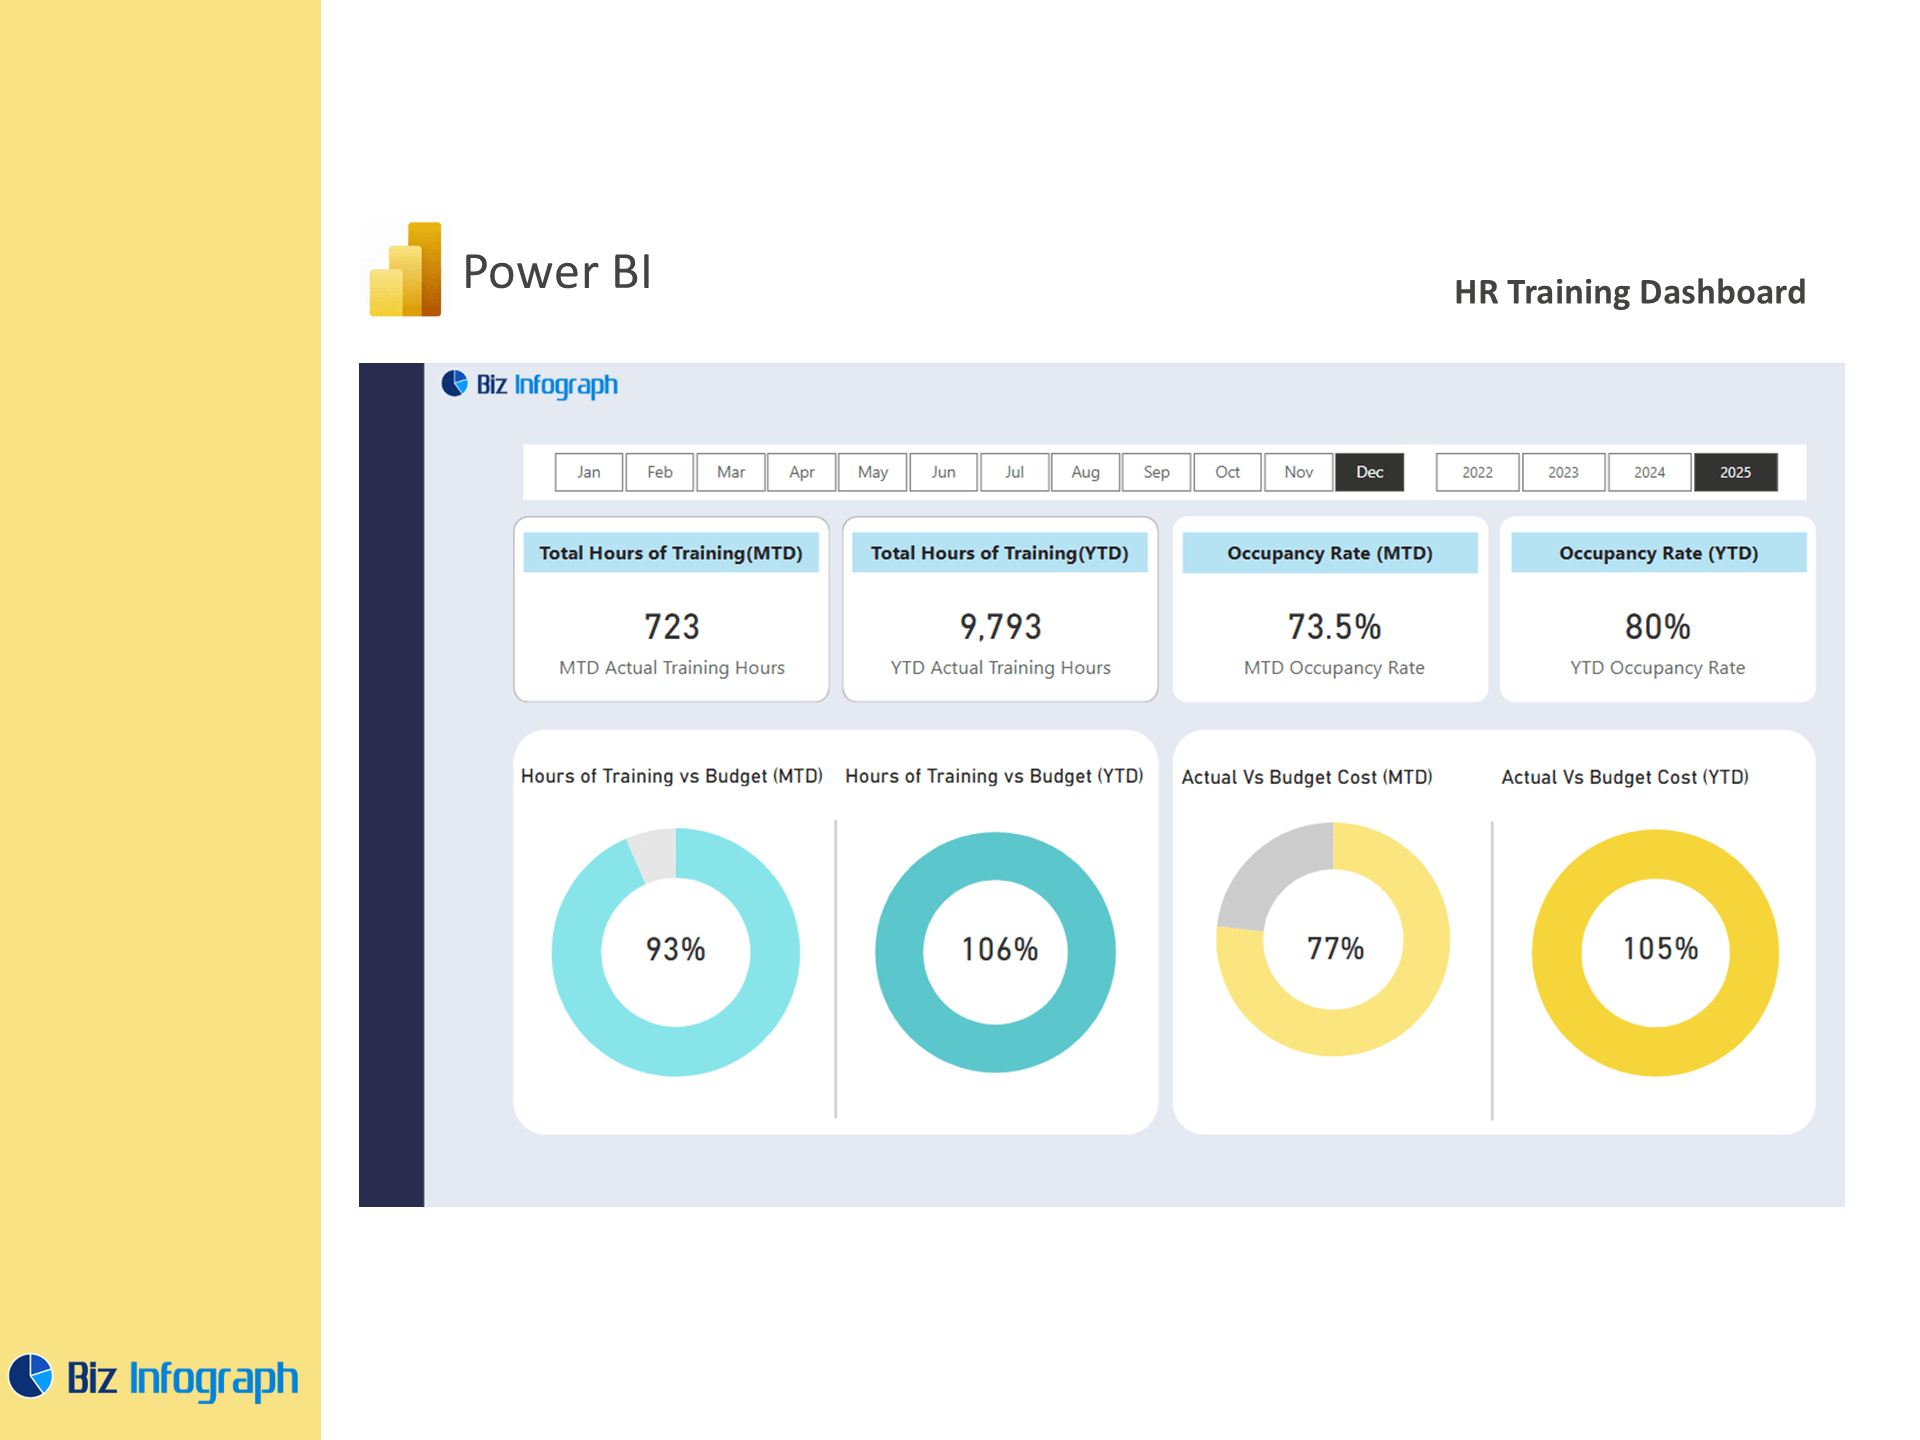
Essential Metrics and KPIs to Track Training Performance
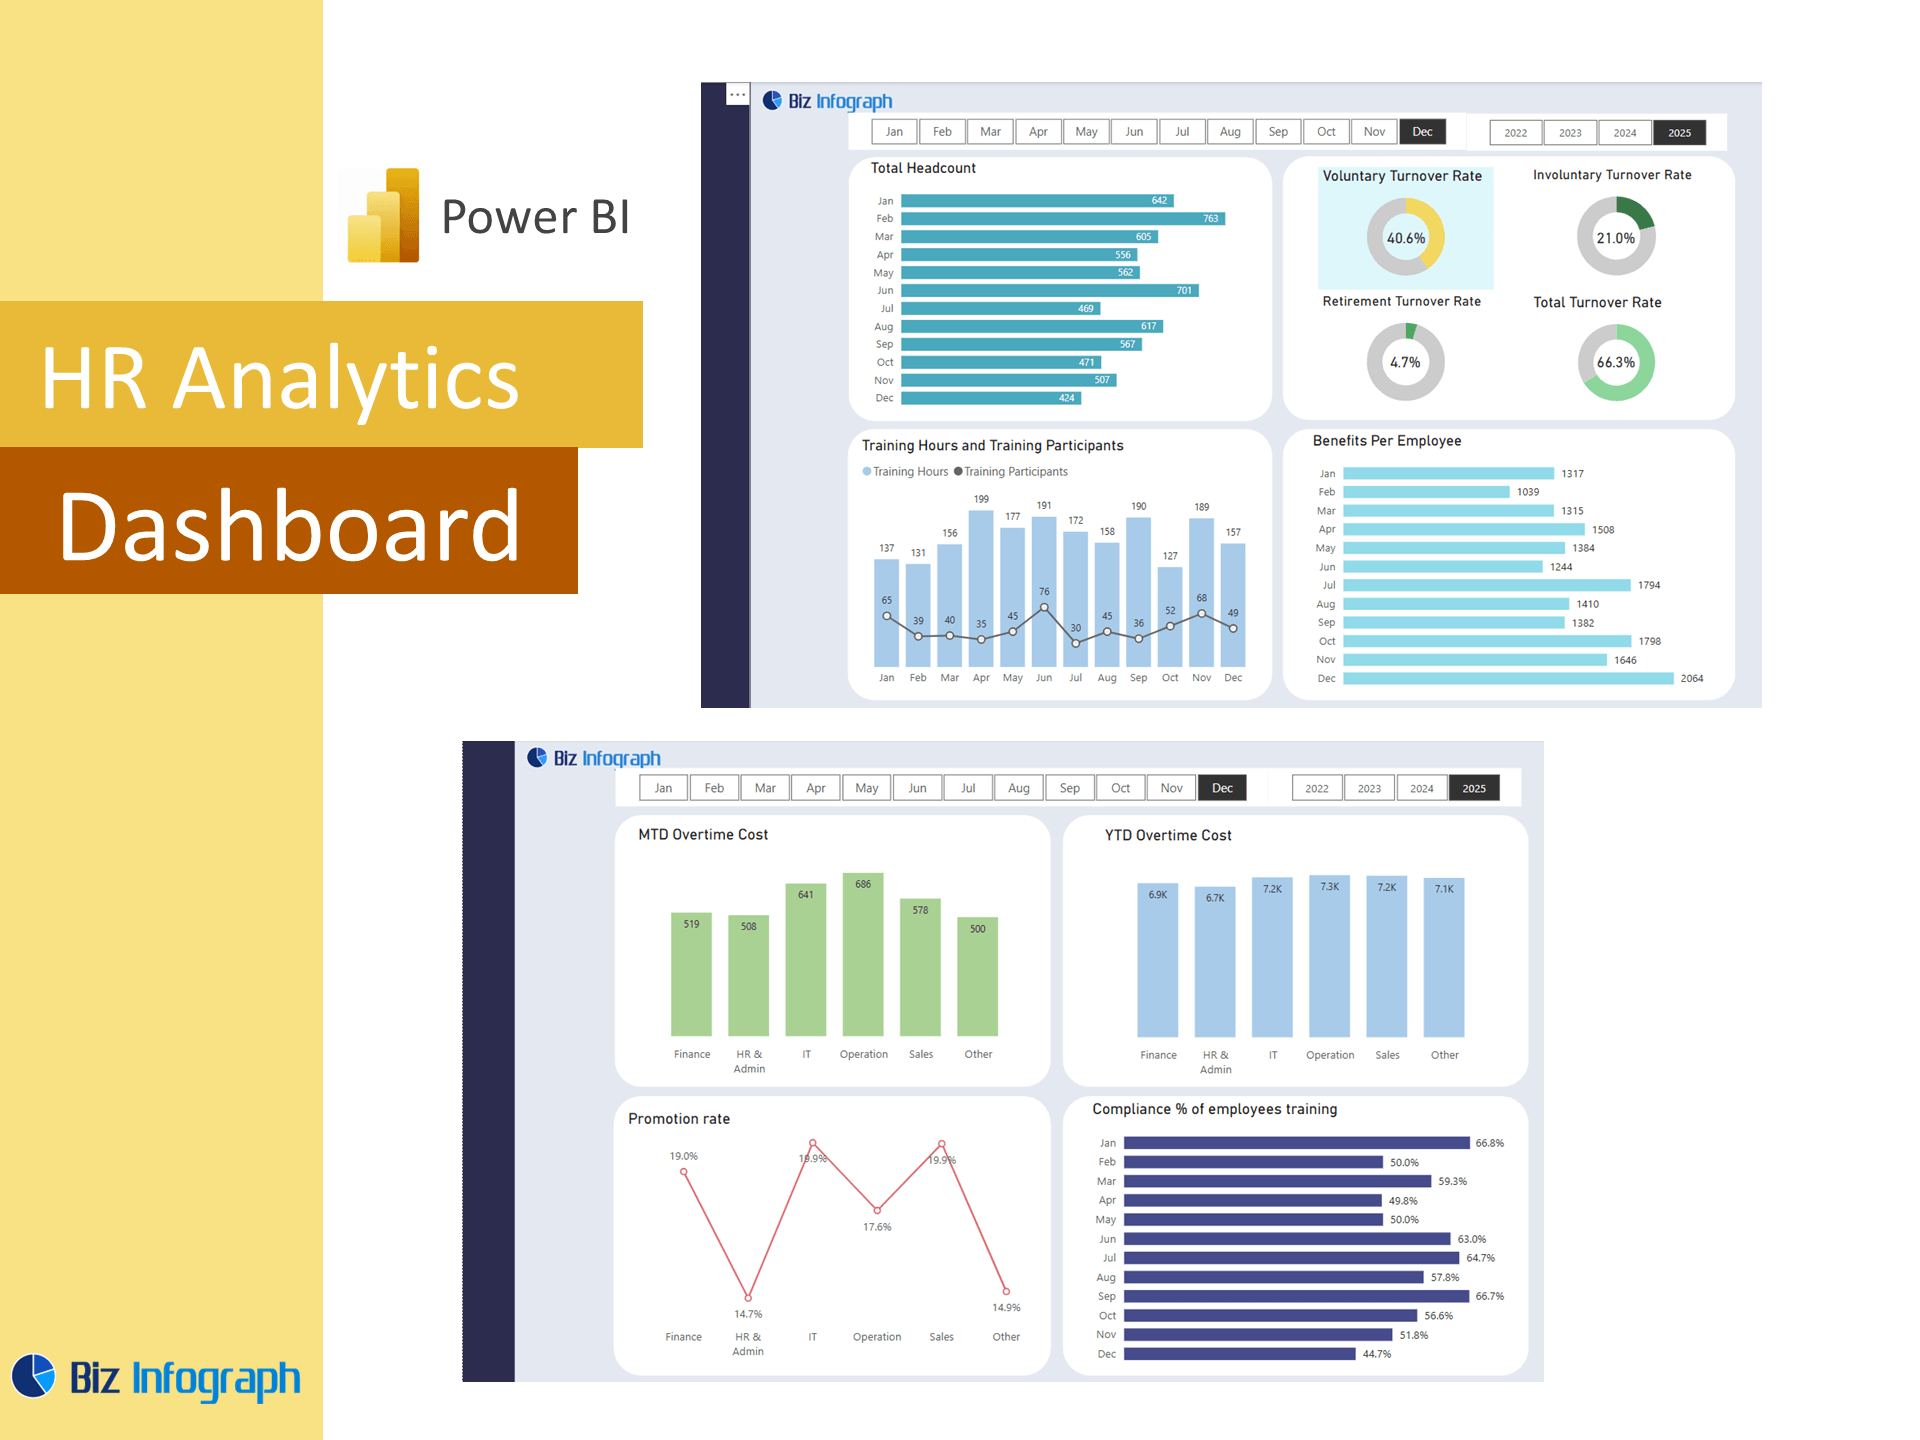
Effective HR training dashboards are driven by clear, measurable HR metrics. These include training participation rates, time spent learning, course completion rates, post-training assessment scores, and knowledge retention over time. By integrating this data with HR employee data profiles, teams can further analyze performance by role, seniority, or department. These key performance indicators (KPIs) help HR professionals evaluate the true impact of HR initiatives and align training investments with organizational priorities. When tracked via a powerful Power BI interface, these metrics not only support compliance tracking but also improve workforce agility and preparedness by identifying learning gaps and performance bottlenecks early.
Data Analysis and Visualization for Training Dashboards
Power BI’s data analytics and visualization features allow HR teams to explore training performance with clarity and precision. Dashboards can be configured with interactive charts, filters, and heat maps that show trends by region, course, or timeframe. By applying data modeling techniques, HR managers can link training data with workforce data such as turnover, engagement, and promotions—turning raw stats into data to make smarter workforce decisions. These visuals help Human resource R professionals to make faster, more informed choices around content design, frequency, and targeting. As part of an analysis dashboard, training metrics become a strategic asset, delivering continuous improvement to HR processes and talent development.
Features of Power BI That Support Comprehensive HR Dashboards
Power BI is packed with features that make it the ideal platform for building HR analytics dashboards. From built-in DAX formulas for custom calculations to dashboard templates and bi reports, Power BI enables proficiency in data without requiring advanced coding skills. The ability to pull from diverse data sources like Excel, SQL, SharePoint, or sales data ensures that HR teams can consolidate everything into a single reporting environment. Its interactivity makes it ideal for scenario planning, what-if analysis, and forecasting outcomes of training investments. With Power BI for HR, dashboards become living tools—easy to update, share, and scale—helping organizations achieve a comprehensive Power BI approach to human capital development.
Power BI in Action for HR Teams
Real HR Power BI Dashboard Examples and Use Cases
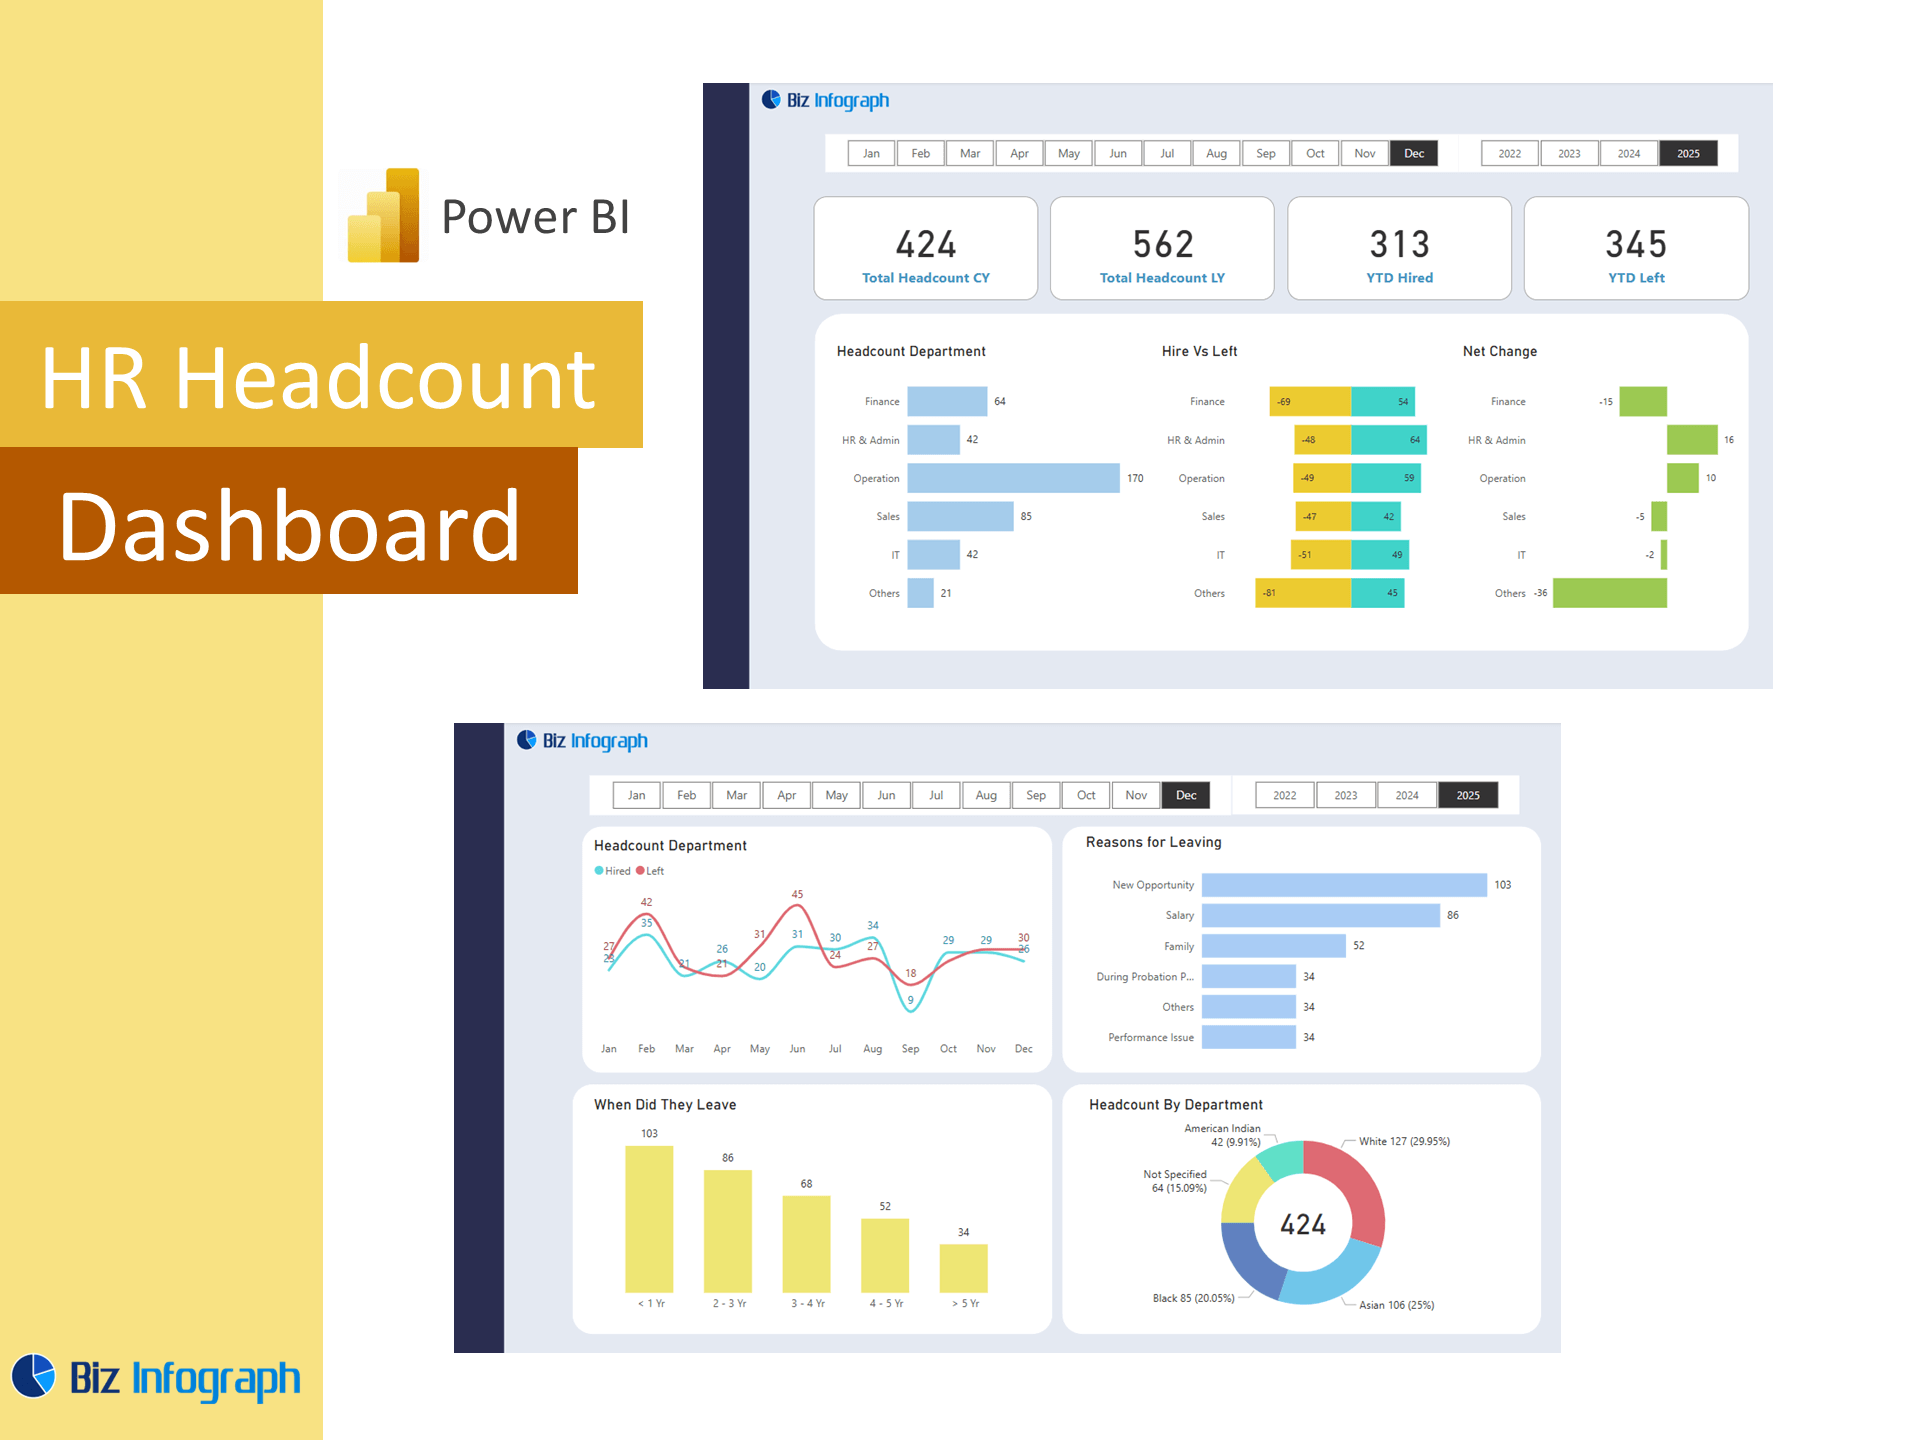
Successful Power BI dashboard examples in HR training include dashboards that monitor onboarding training completion, leadership program performance, and technical upskilling initiatives. For instance, a dashboard using Power BI might visualize the percentage of new hires completing orientation within their first week, with filters for department and manager. Another use case integrates a training dashboard with a recruitment tracker dashboard to see if onboarding affects retention. Advanced dashboards even link to employee satisfaction scores or 360° feedback dashboards to gauge how training impacts engagement. These examples show how dashboard offers actionable outcomes, improving HR management and supporting a culture of continuous learning.
Delivering Actionable Insights with HR Power BI Dashboards
The goal of an HR Power BI dashboard is to provide insights that lead to meaningful action. Dashboards are configured to send alerts when KPIs fall below target—such as declining participation or overdue mandatory training. Using Power BI service, these alerts can be delivered directly to stakeholders' inboxes or Teams channels. Dashboards help HR managers to identify skill shortages, mismatches in training allocation, or underperforming content. By combining metrics from multiple sources, Power BI generates data insights that help HR professionals make smart adjustments in real time. With ongoing usage, these dashboards fuel a feedback loop that supports high-impact learning strategies.
How People Analytics Enhances HR Training Through Power BI Projects
By integrating people analytics into your Power BI project, training data becomes more than just attendance logs—it becomes a lens through which to understand workforce capability and readiness. For example, cross-referencing training with employee performance dashboards or HR analytics dashboards can reveal which programs most strongly influence promotions or retention. These insights support data-driven HR strategies and encourage HR professionals to take a more strategic role in workforce planning. A well-executed HR analytics Power BI dashboard report aligns training with talent outcomes, allowing leadership to invest confidently in programs that show measurable impact. Ultimately, it’s the power of data that elevates HR from operational to transformational.
For ready-to-use Dashboard Templates: