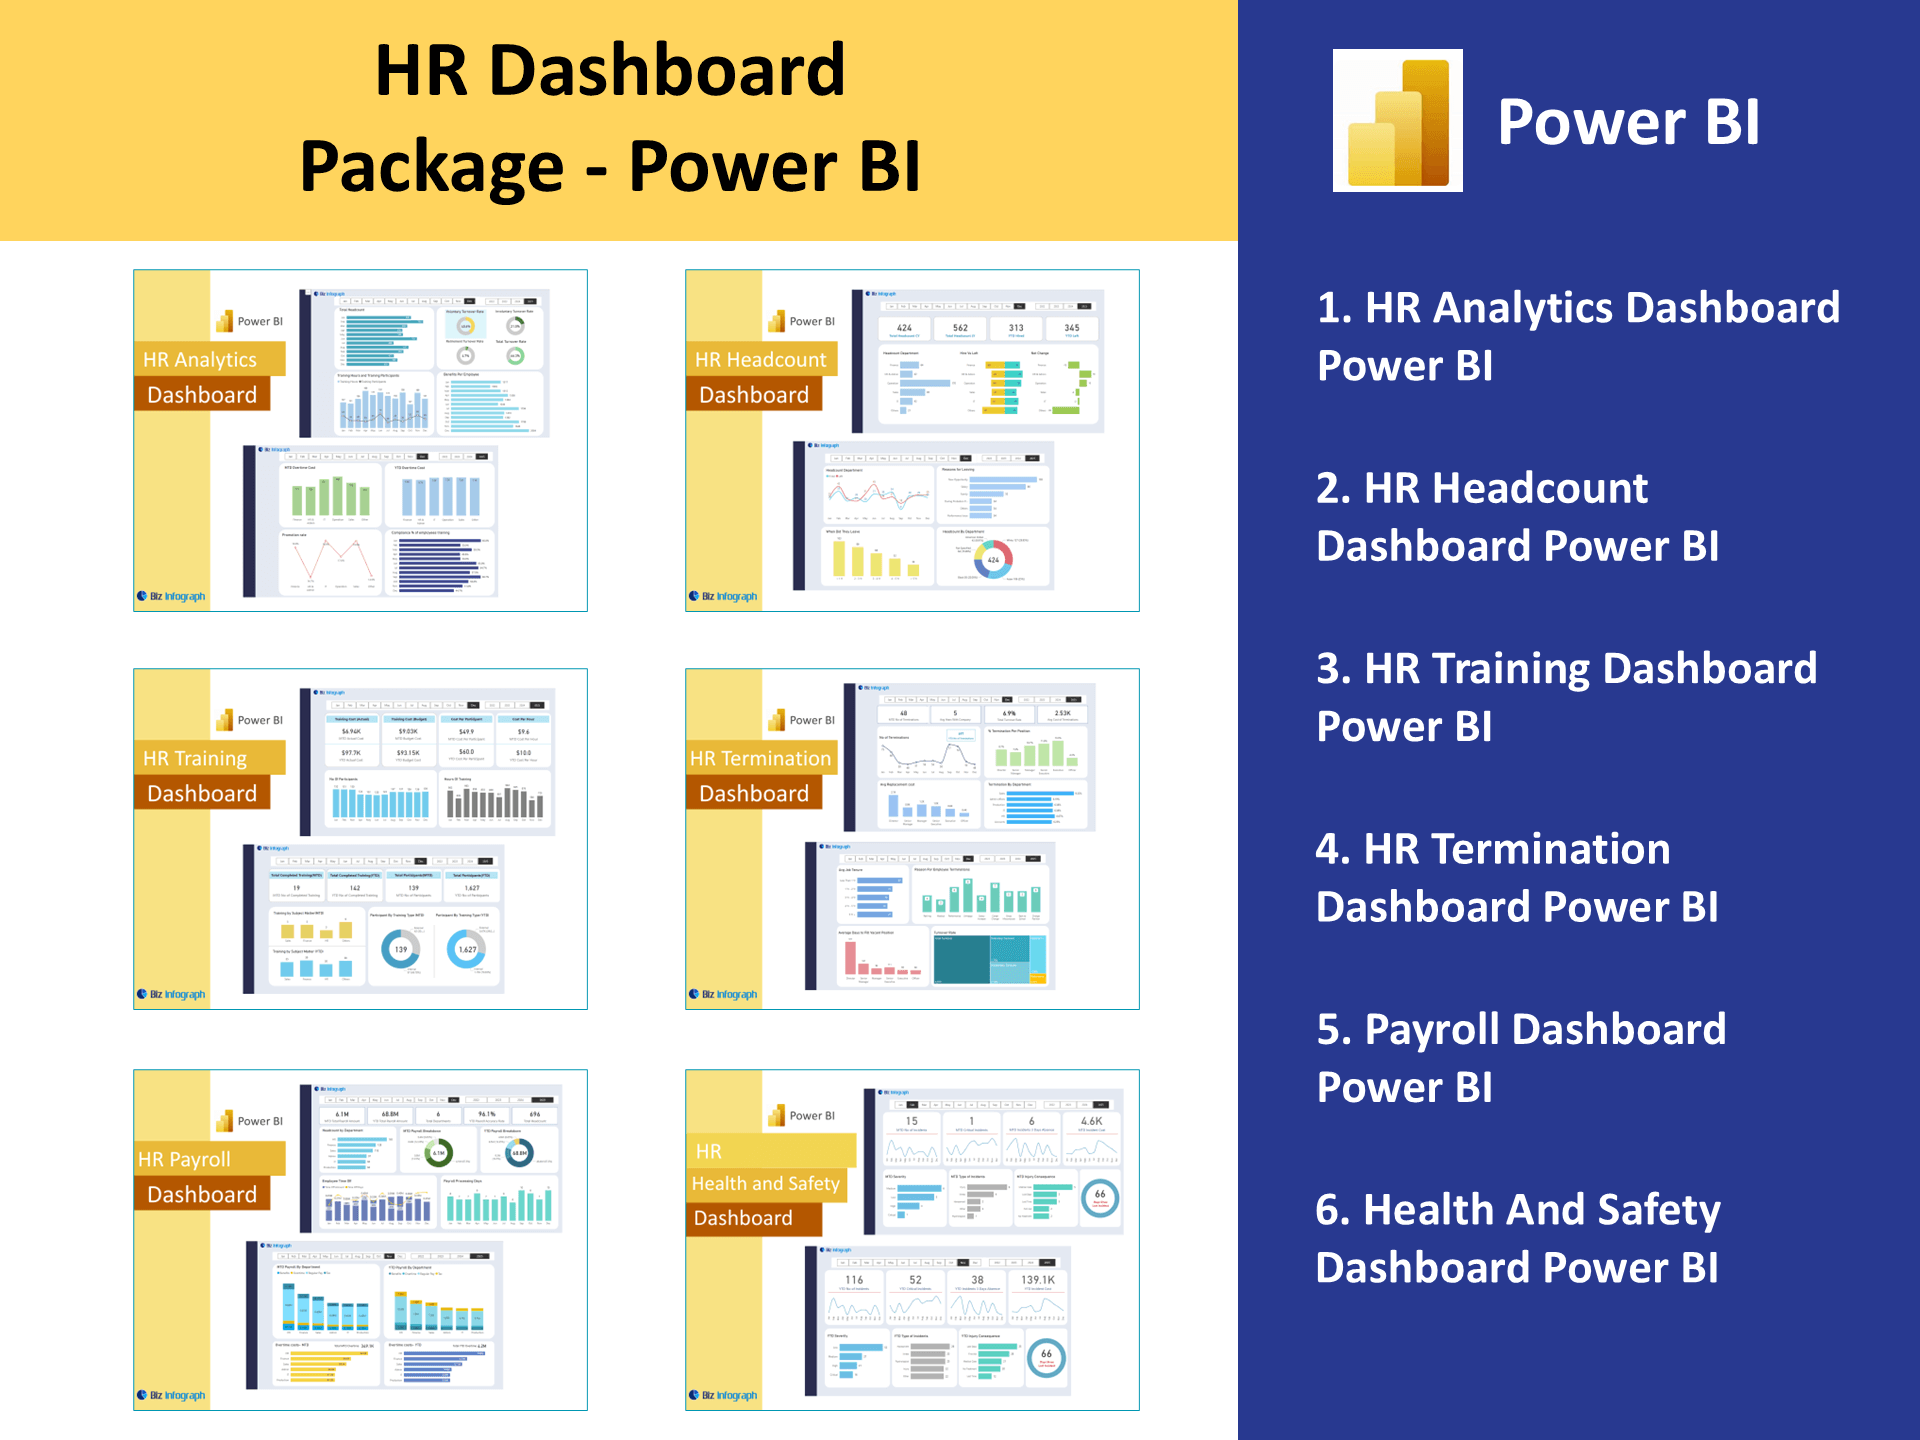
HR Termination Power BI Dashboard
Understanding the HR Termination Dashboard in Power BI
What Is an HR Termination Dashboard?
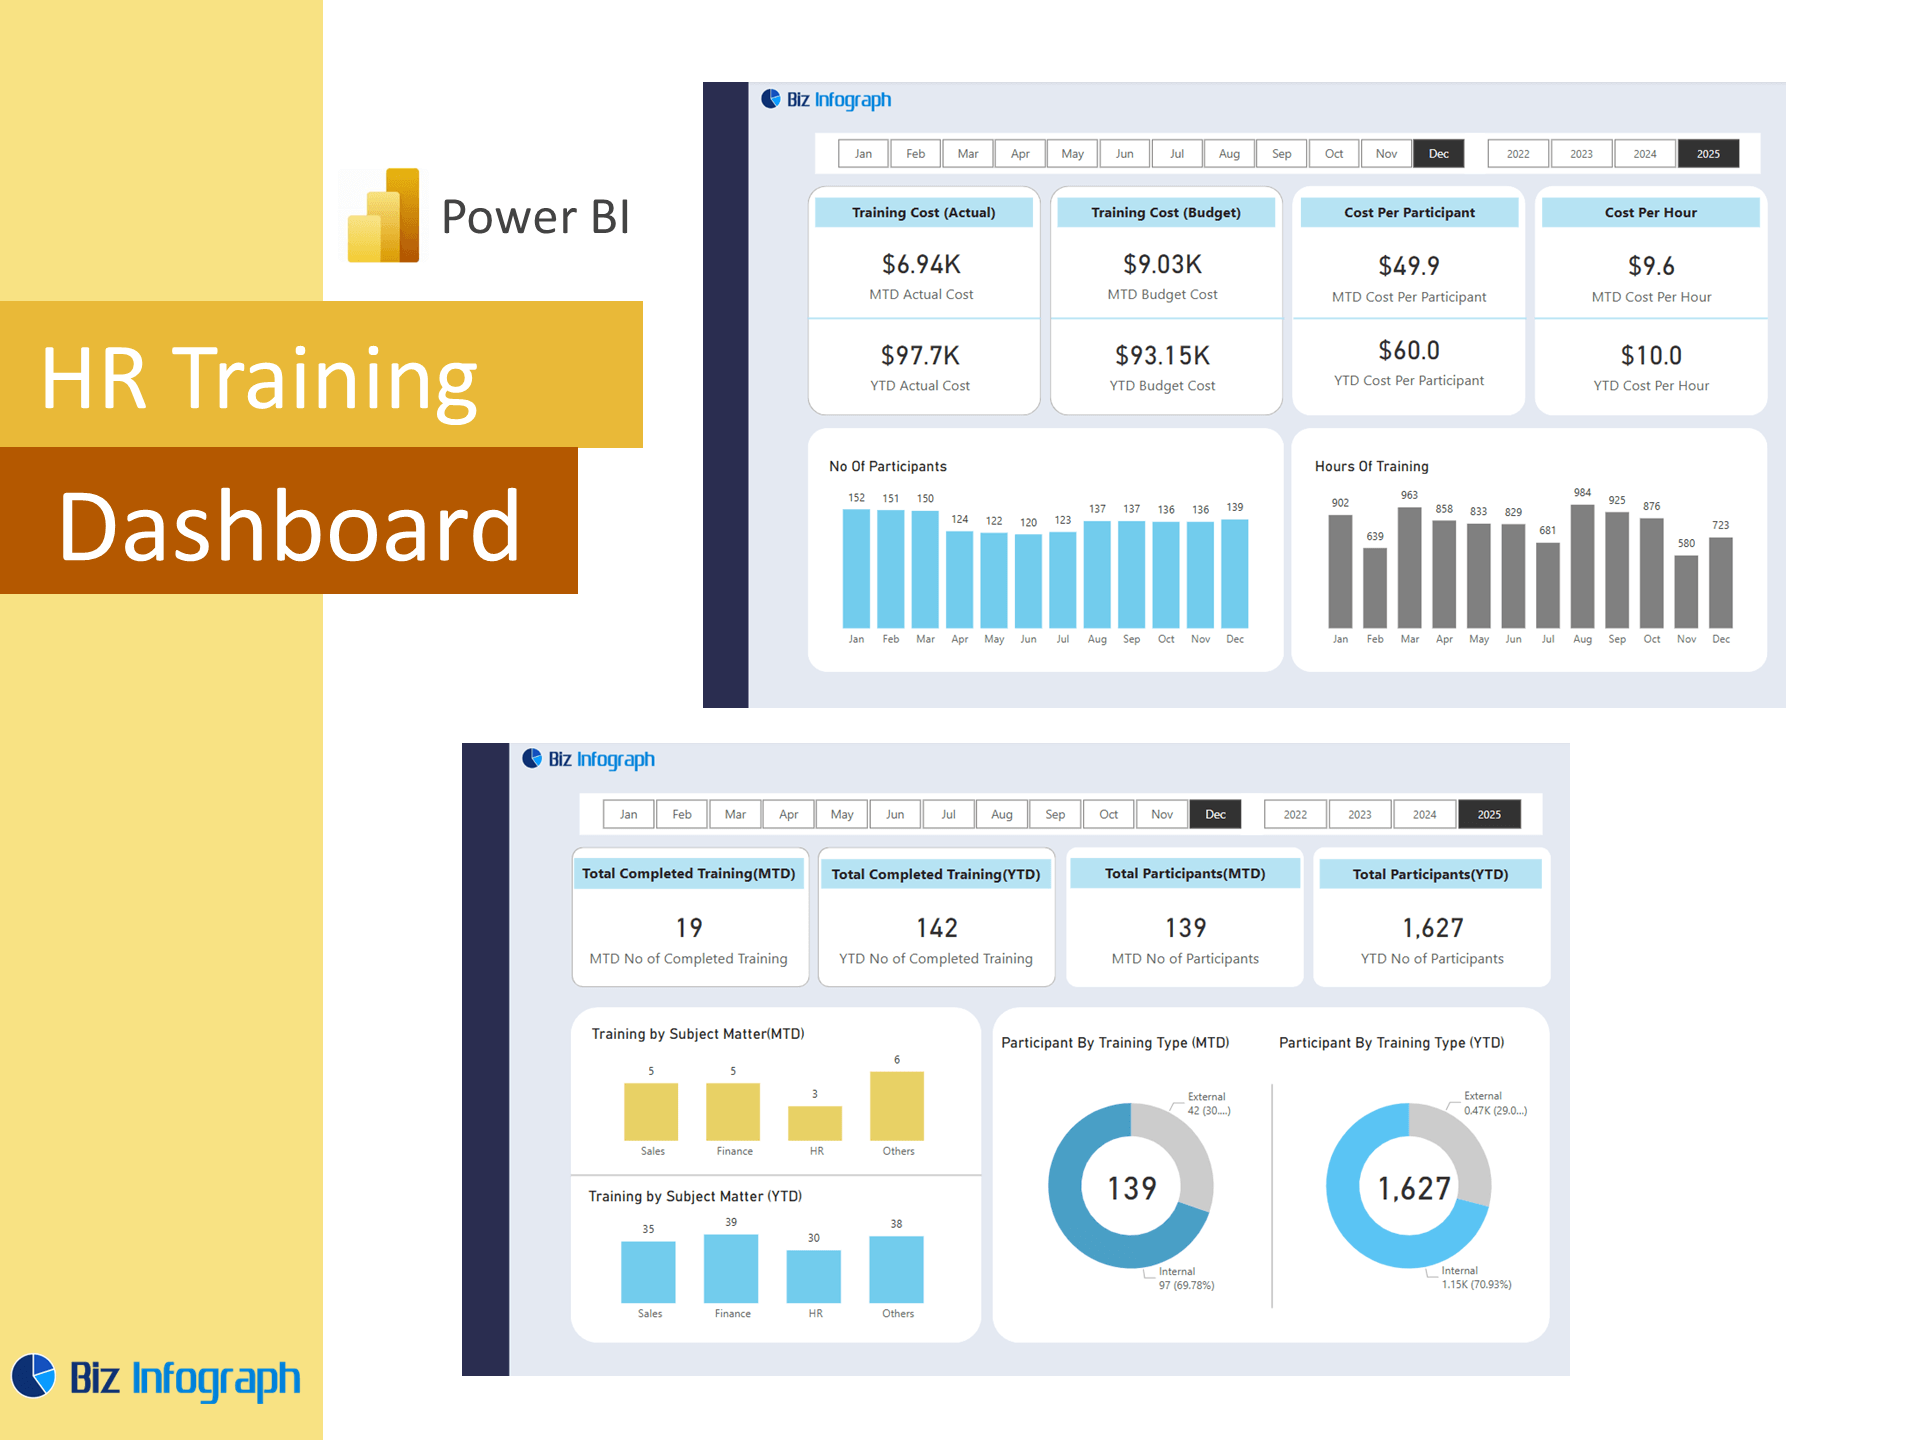
An HR Termination Dashboard built with Microsoft Power BI is a powerful tool designed to help HR professionals monitor and understand trends related to employee exits. It provides a comprehensive view of key variables such as attrition, turnover rates, reasons for departure, employee satisfaction, employee engagement, and department-level resignations. Using dashboards that visualize data from multiple data sources, HR teams gain clarity into patterns behind employee exits. These dashboards support termination analysis, allowing for faster detection of organizational issues like low morale, poor management, or inefficient recruitment strategies. A well-designed Power BI HR dashboard makes data-driven decision-making a daily HR capability, helping companies retain talent and optimize workforce planning.
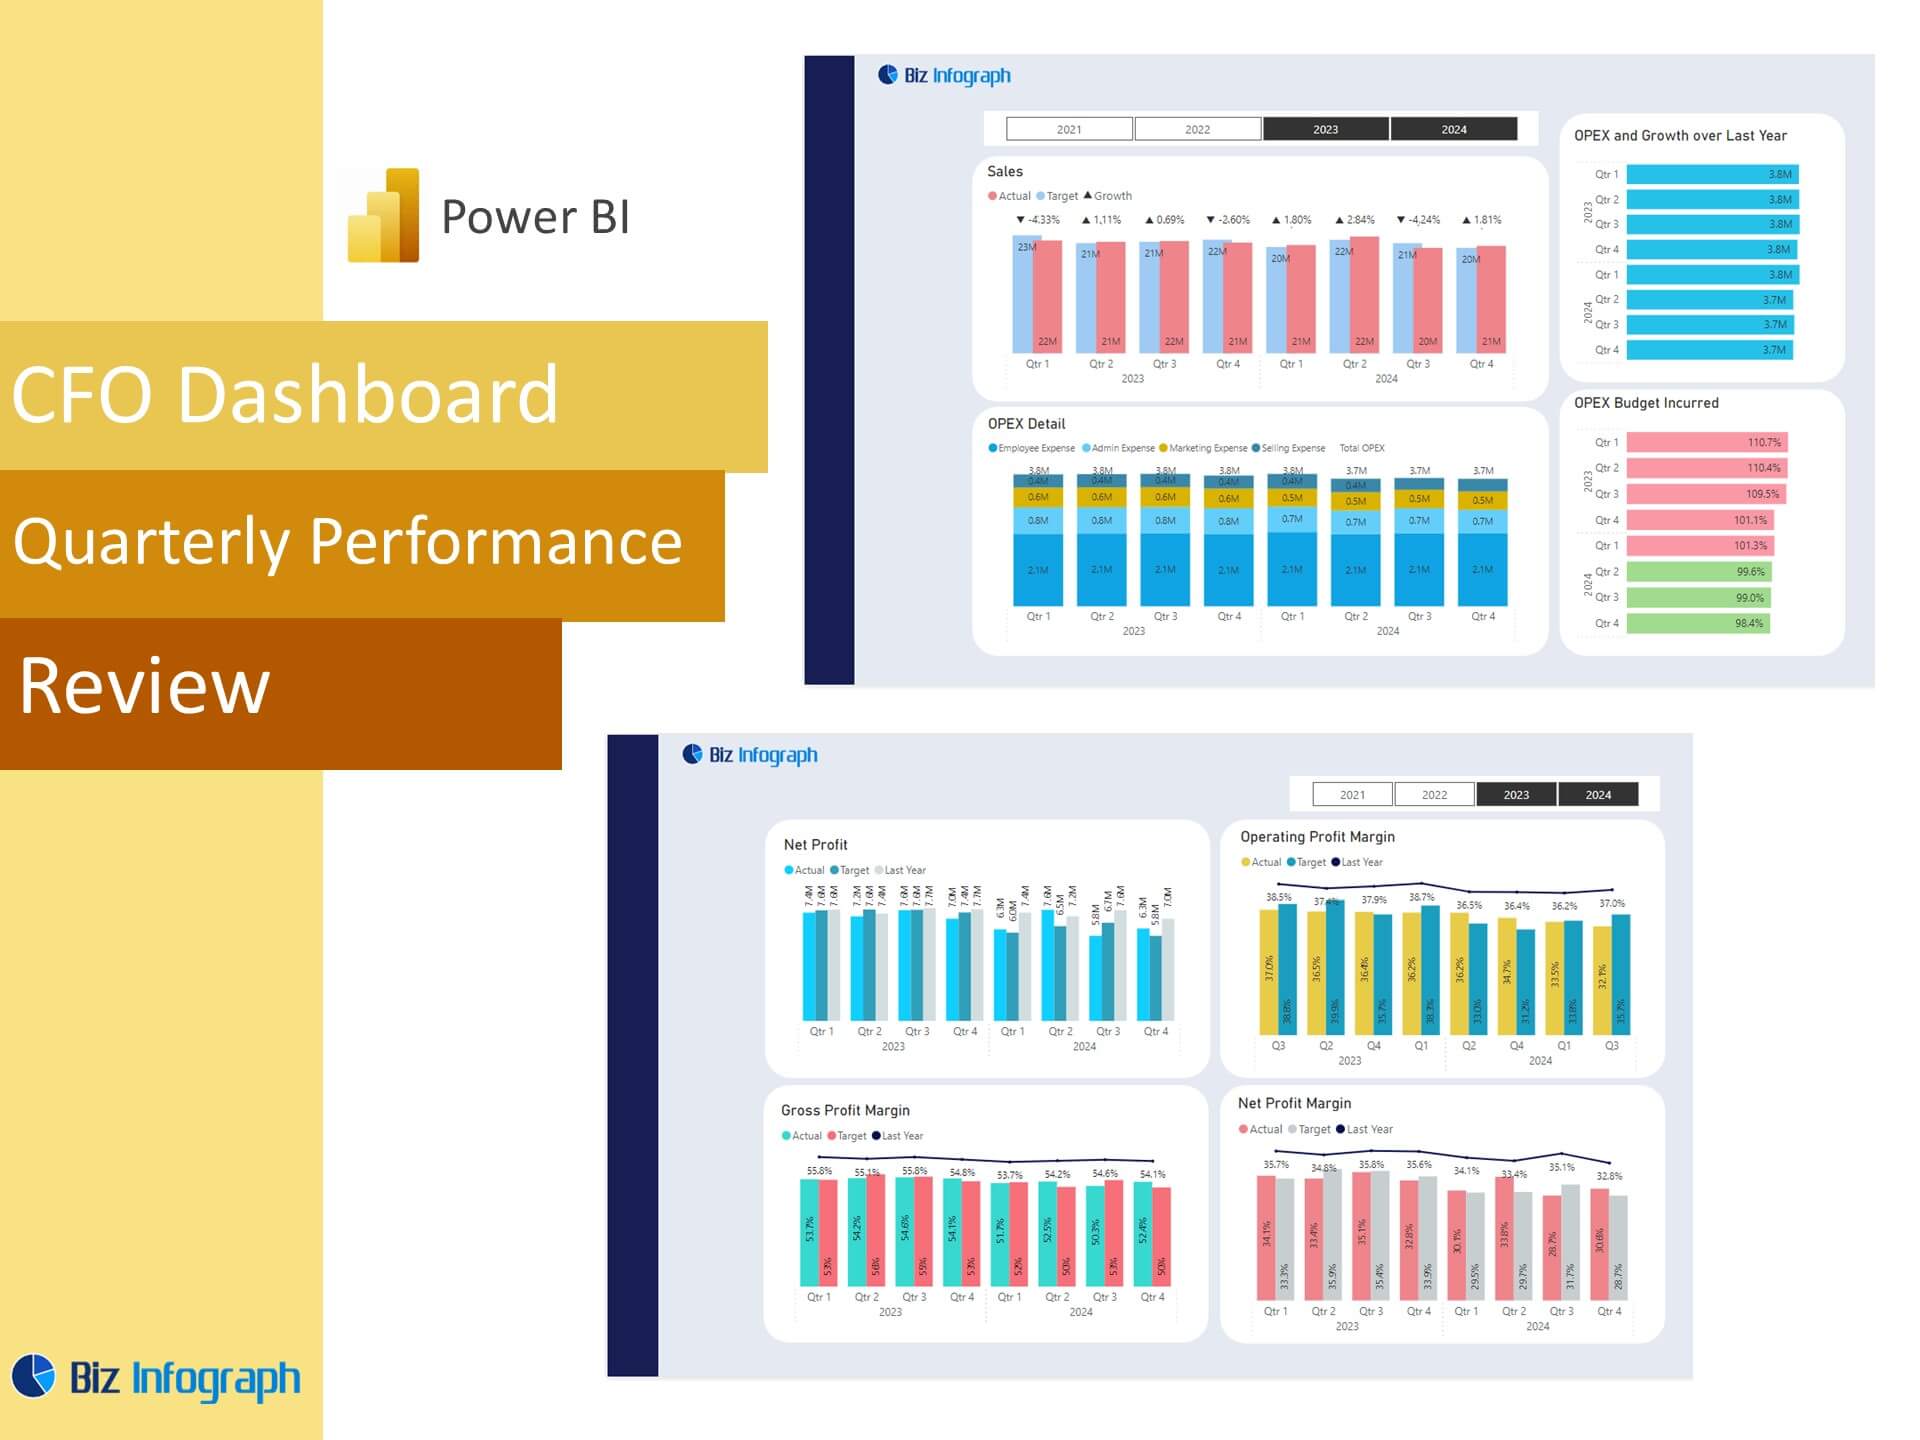
Importance of Termination Analytics for HR Leaders
For HR leaders, understanding why employees leave is crucial for shaping HR strategies, improving workforce planning, and driving meaningful change. A termination dashboard enables leadership to evaluate critical KPIs like absenteeism, satisfaction levels, and employee productivity before and after an exit. It also offers deeper insight into demographics, salary distribution, and tenure, helping leaders identify patterns and areas for improvement. With people analytics integrated into the dashboard, organizations can connect terminations with performance reviews, training gaps, or poor culture fit. These insights help make better decisions, reduce costly turnover, and create better employee experiences across all departments.
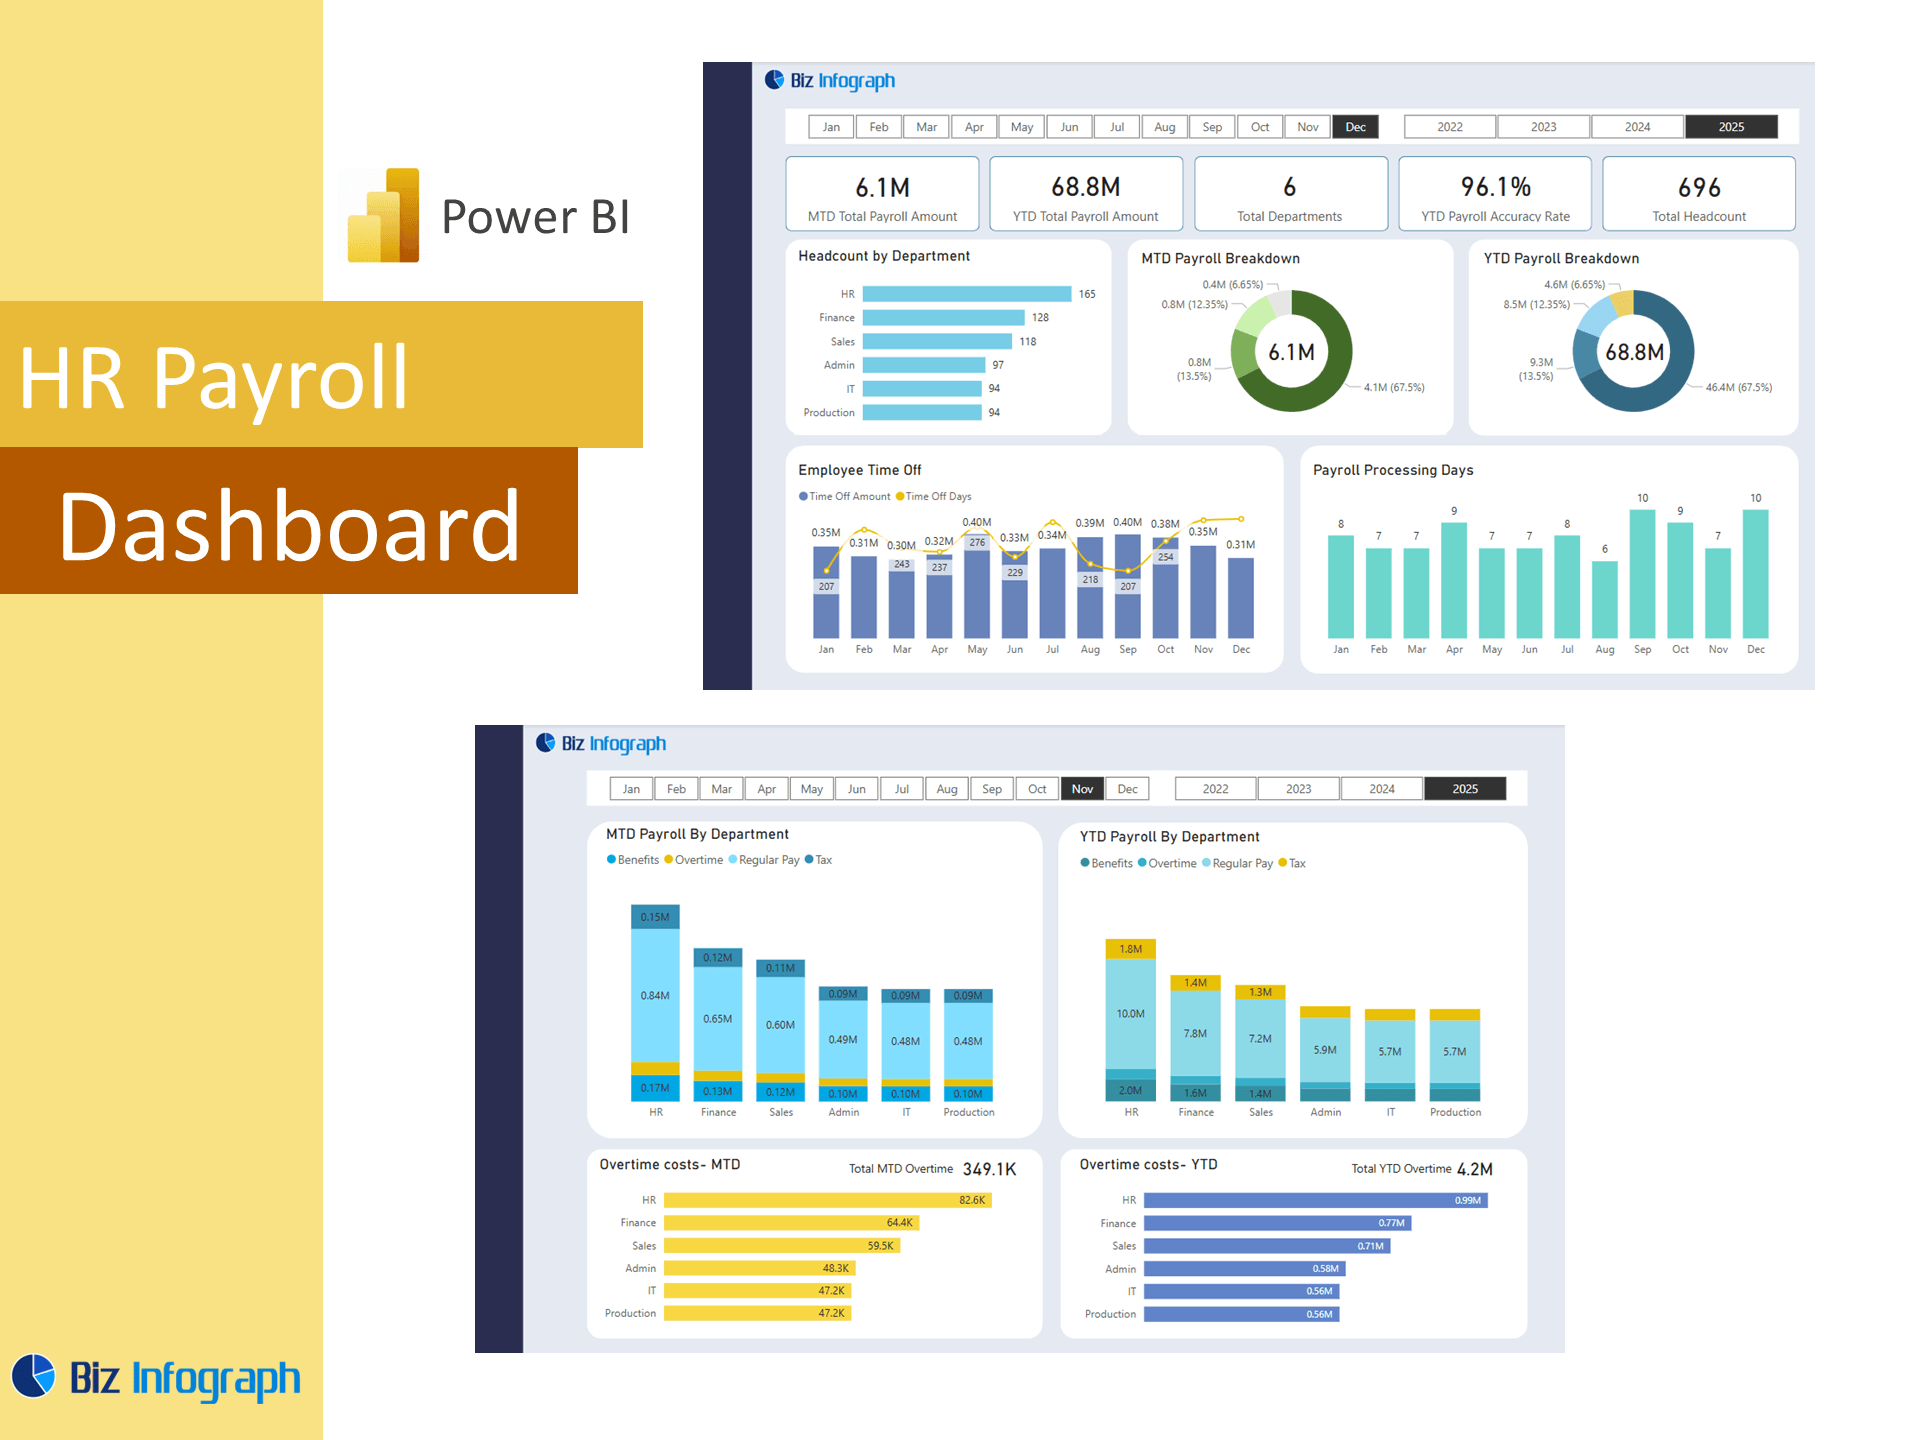
Benefits of Power BI for Workforce Analytics and Reporting
Using Power BI for workforce analytics provides HR with an interactive and user-friendly platform for monitoring termination data in real time. Unlike static reports, Power BI dashboards allow dynamic filtering by department, role, or employee details, supporting a more customized view of exit trends. By incorporating analytics dashboards into everyday HR workflows, companies can gain insights that influence everything from recruitment strategies to leadership development. Power BI HR dashboards combine data analytics with robust visualization tools, ensuring that every HR professional can deliver accurate, timely, and actionable insights to stakeholders. It's one of the best Power BI use cases in HR analytics for proactive workforce management.
Building an Effective HR Termination Dashboard
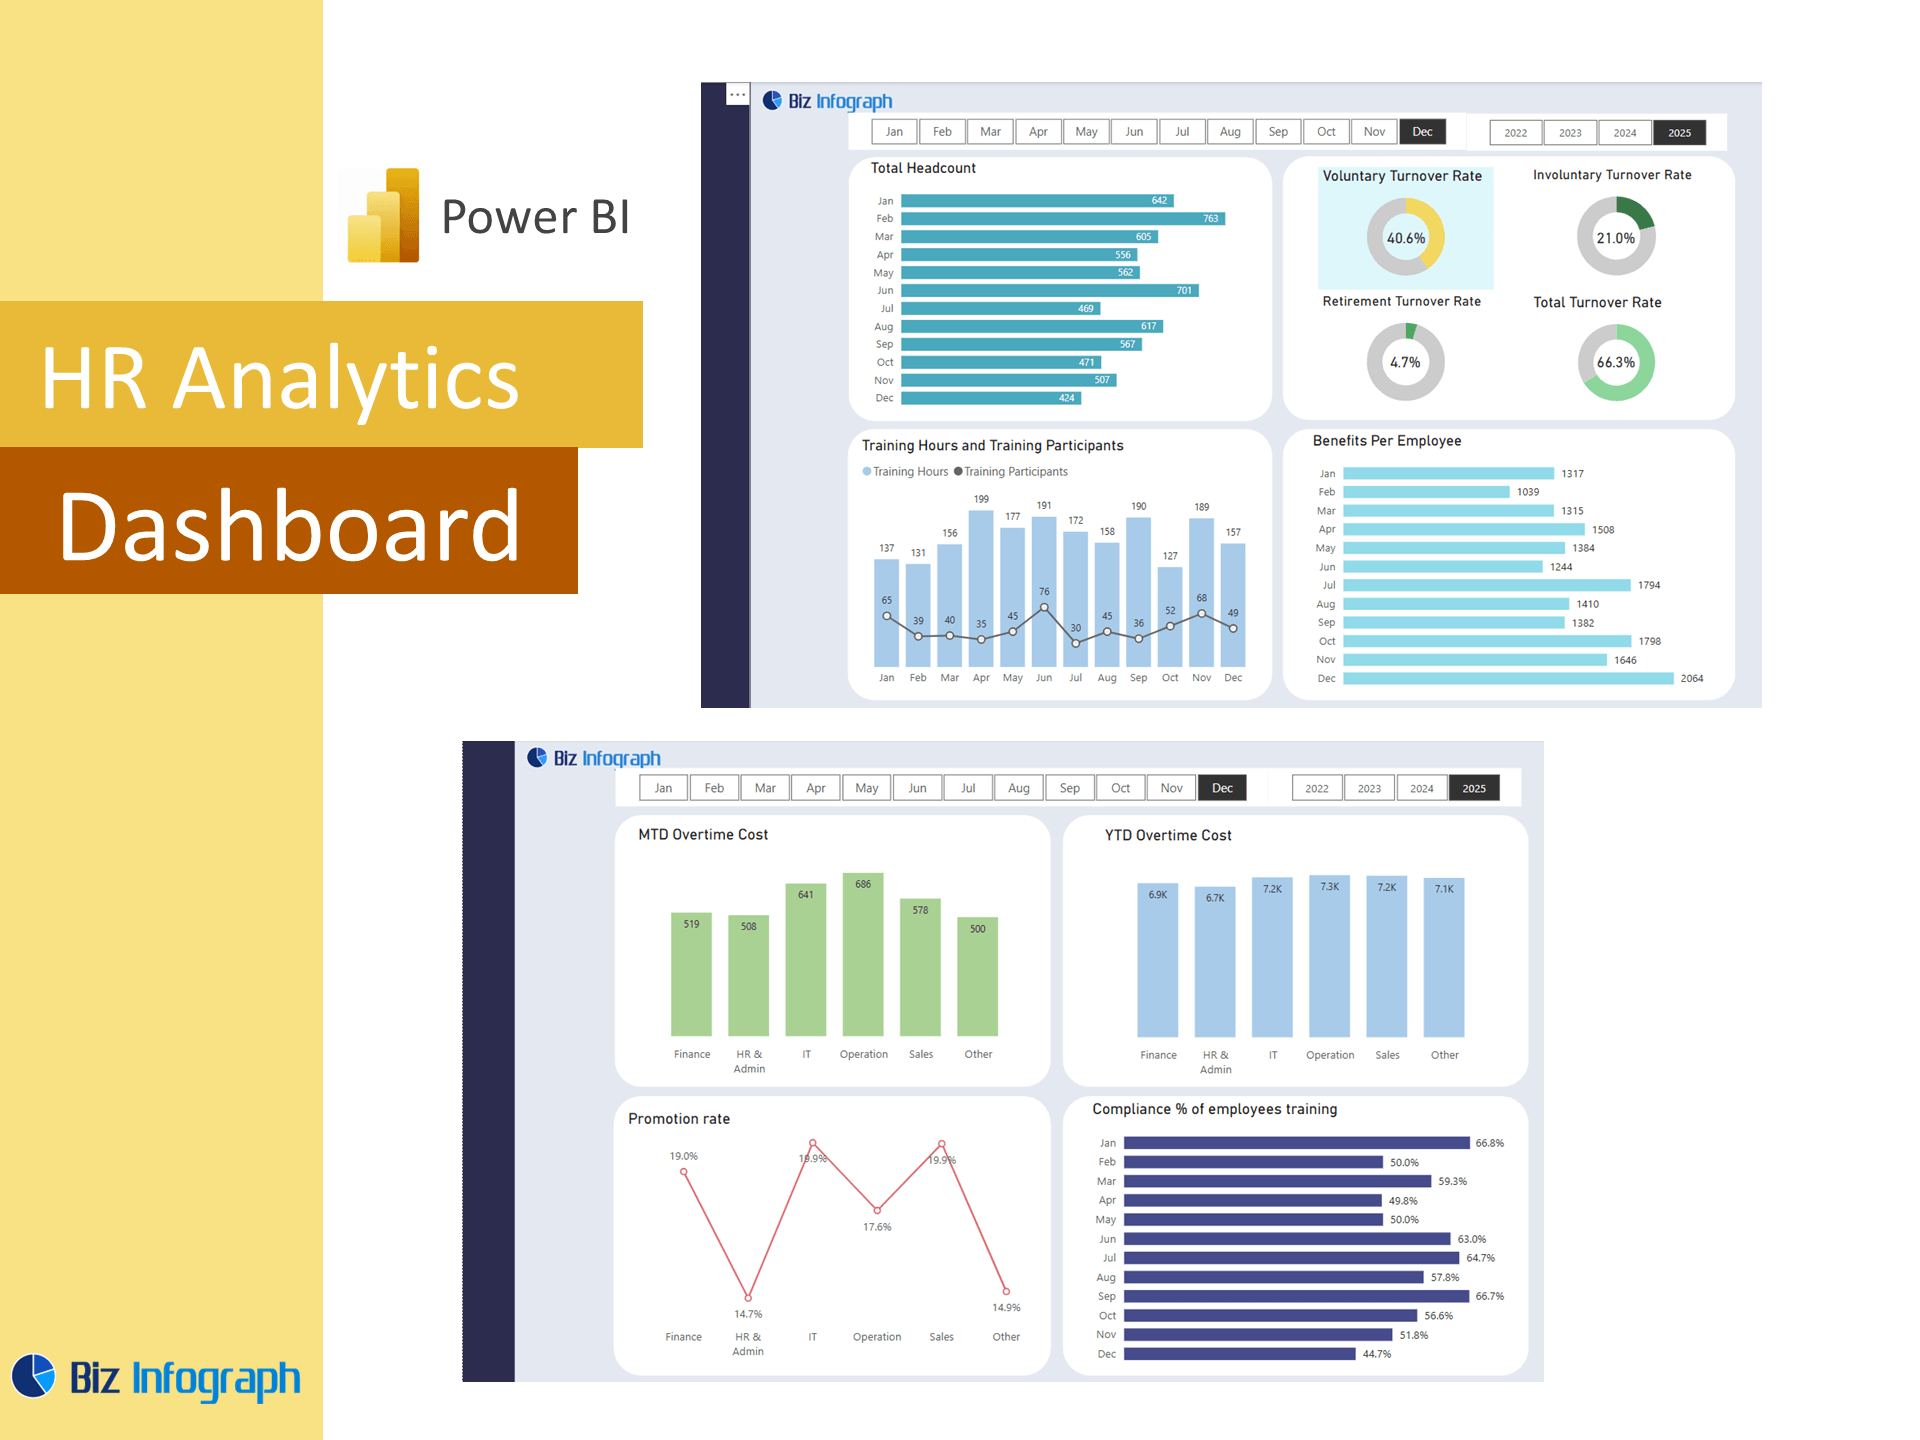
Key Features of an HR Termination Power BI Dashboard
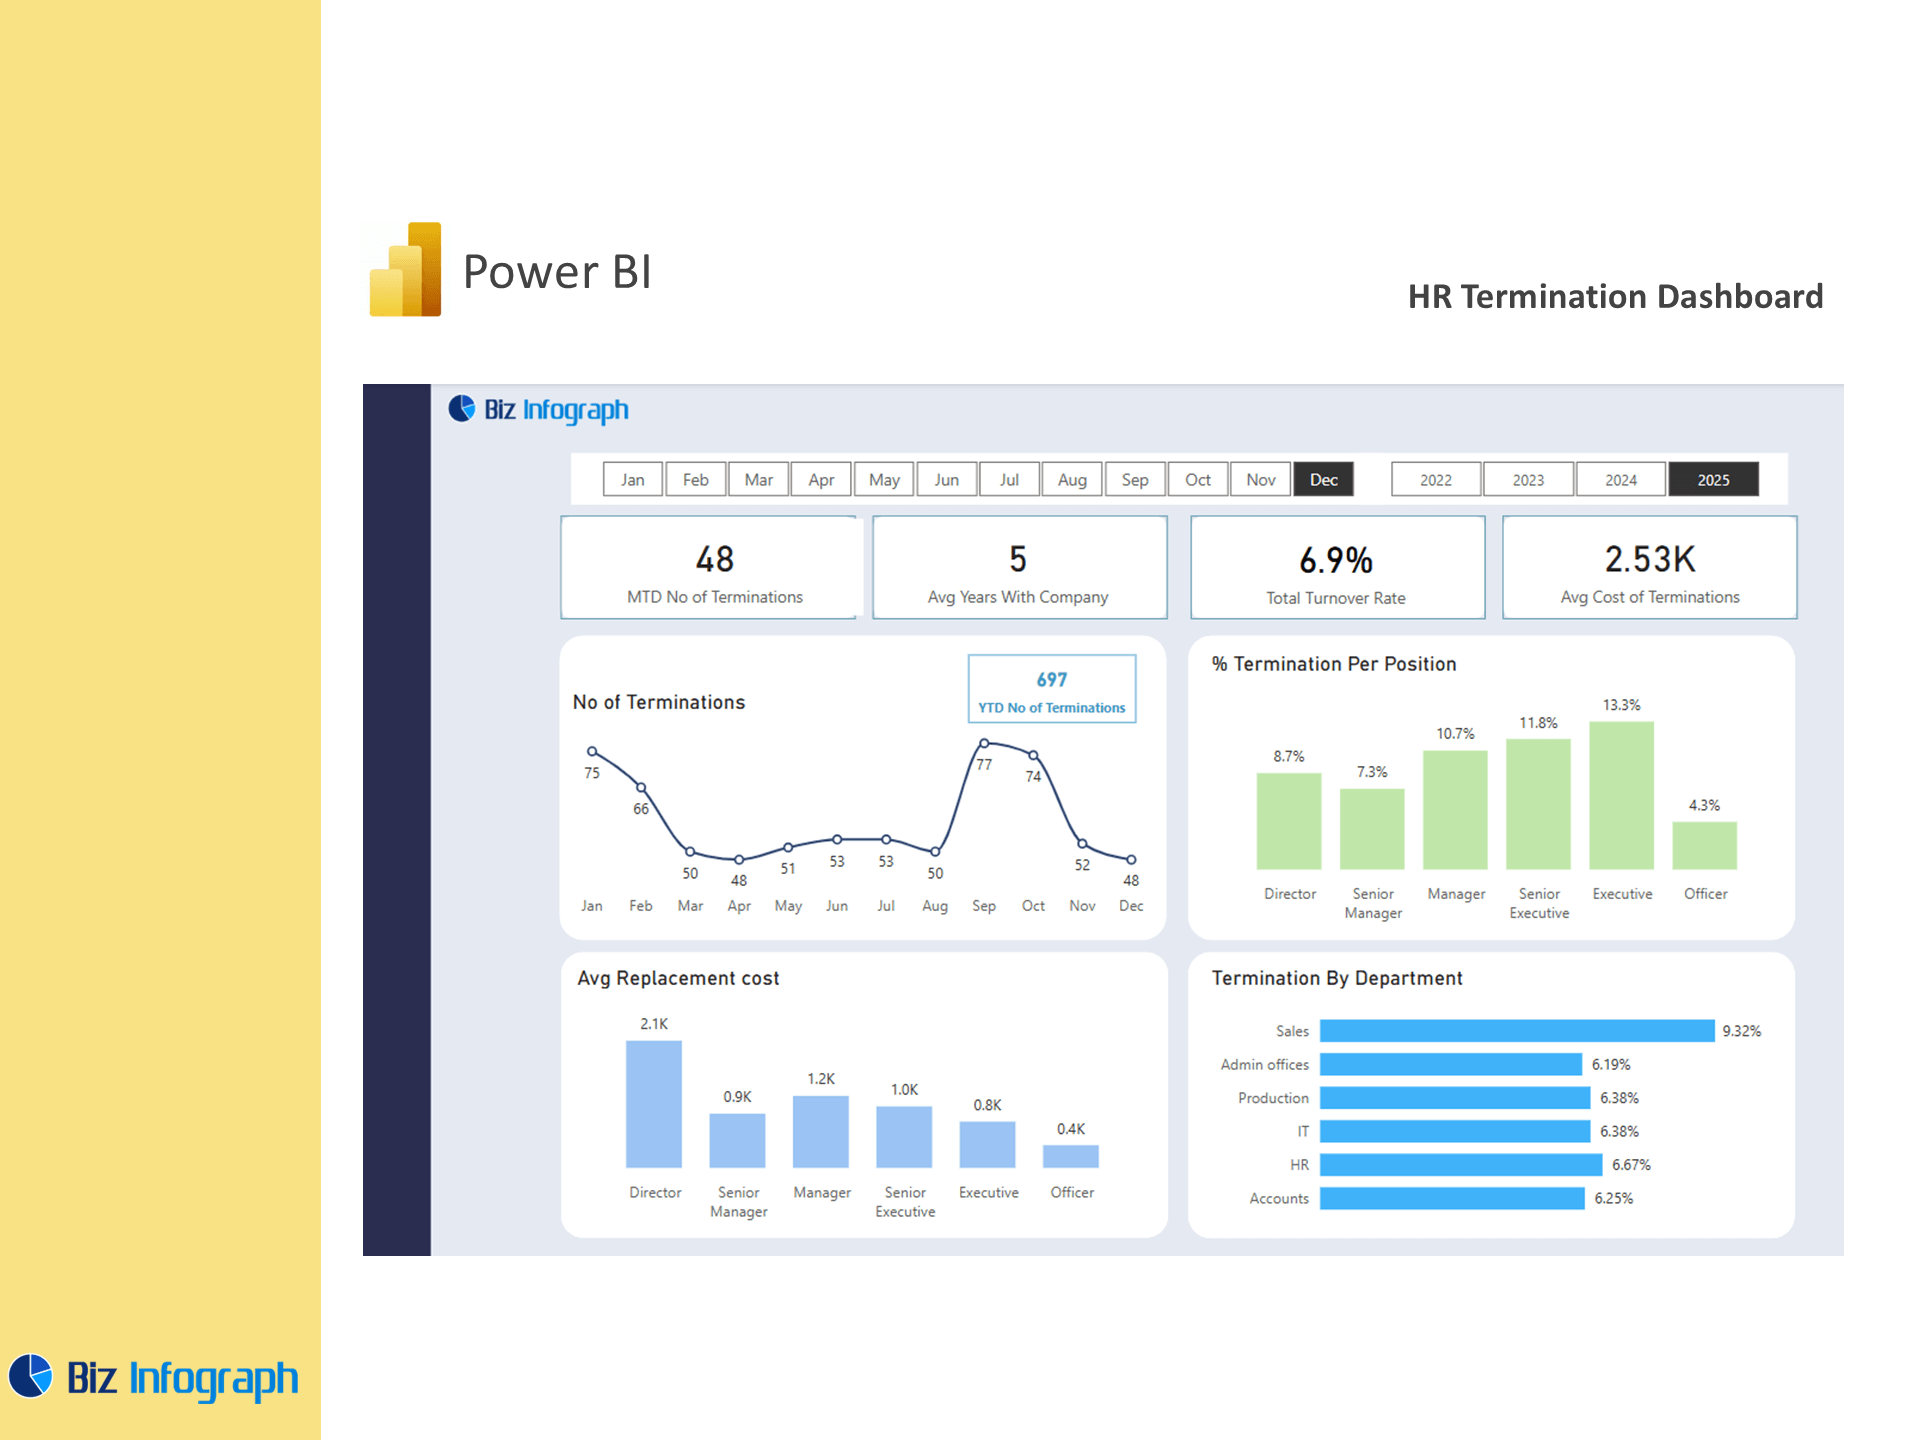
An effective Power BI HR dashboard focused on terminations should include key dashboard features such as visual trendlines, real-time filtering, and breakdowns by location, manager, or job function. Essential elements also include metrics like time-to-hire for replacements, open positions, and cost of turnover. Integrating employee performance dashboards into the termination view helps correlate poor performance or low engagement initiatives with exits. Dashboards should also visualize financials, such as salary analysis and severance costs, to support HR’s alignment with finance teams. With built-in filters and intuitive layouts, these dashboards become central to HR analytics solutions, offering valuable insights for every decision-maker.
KPIs and Metrics to Track Employee Exits and Turnover
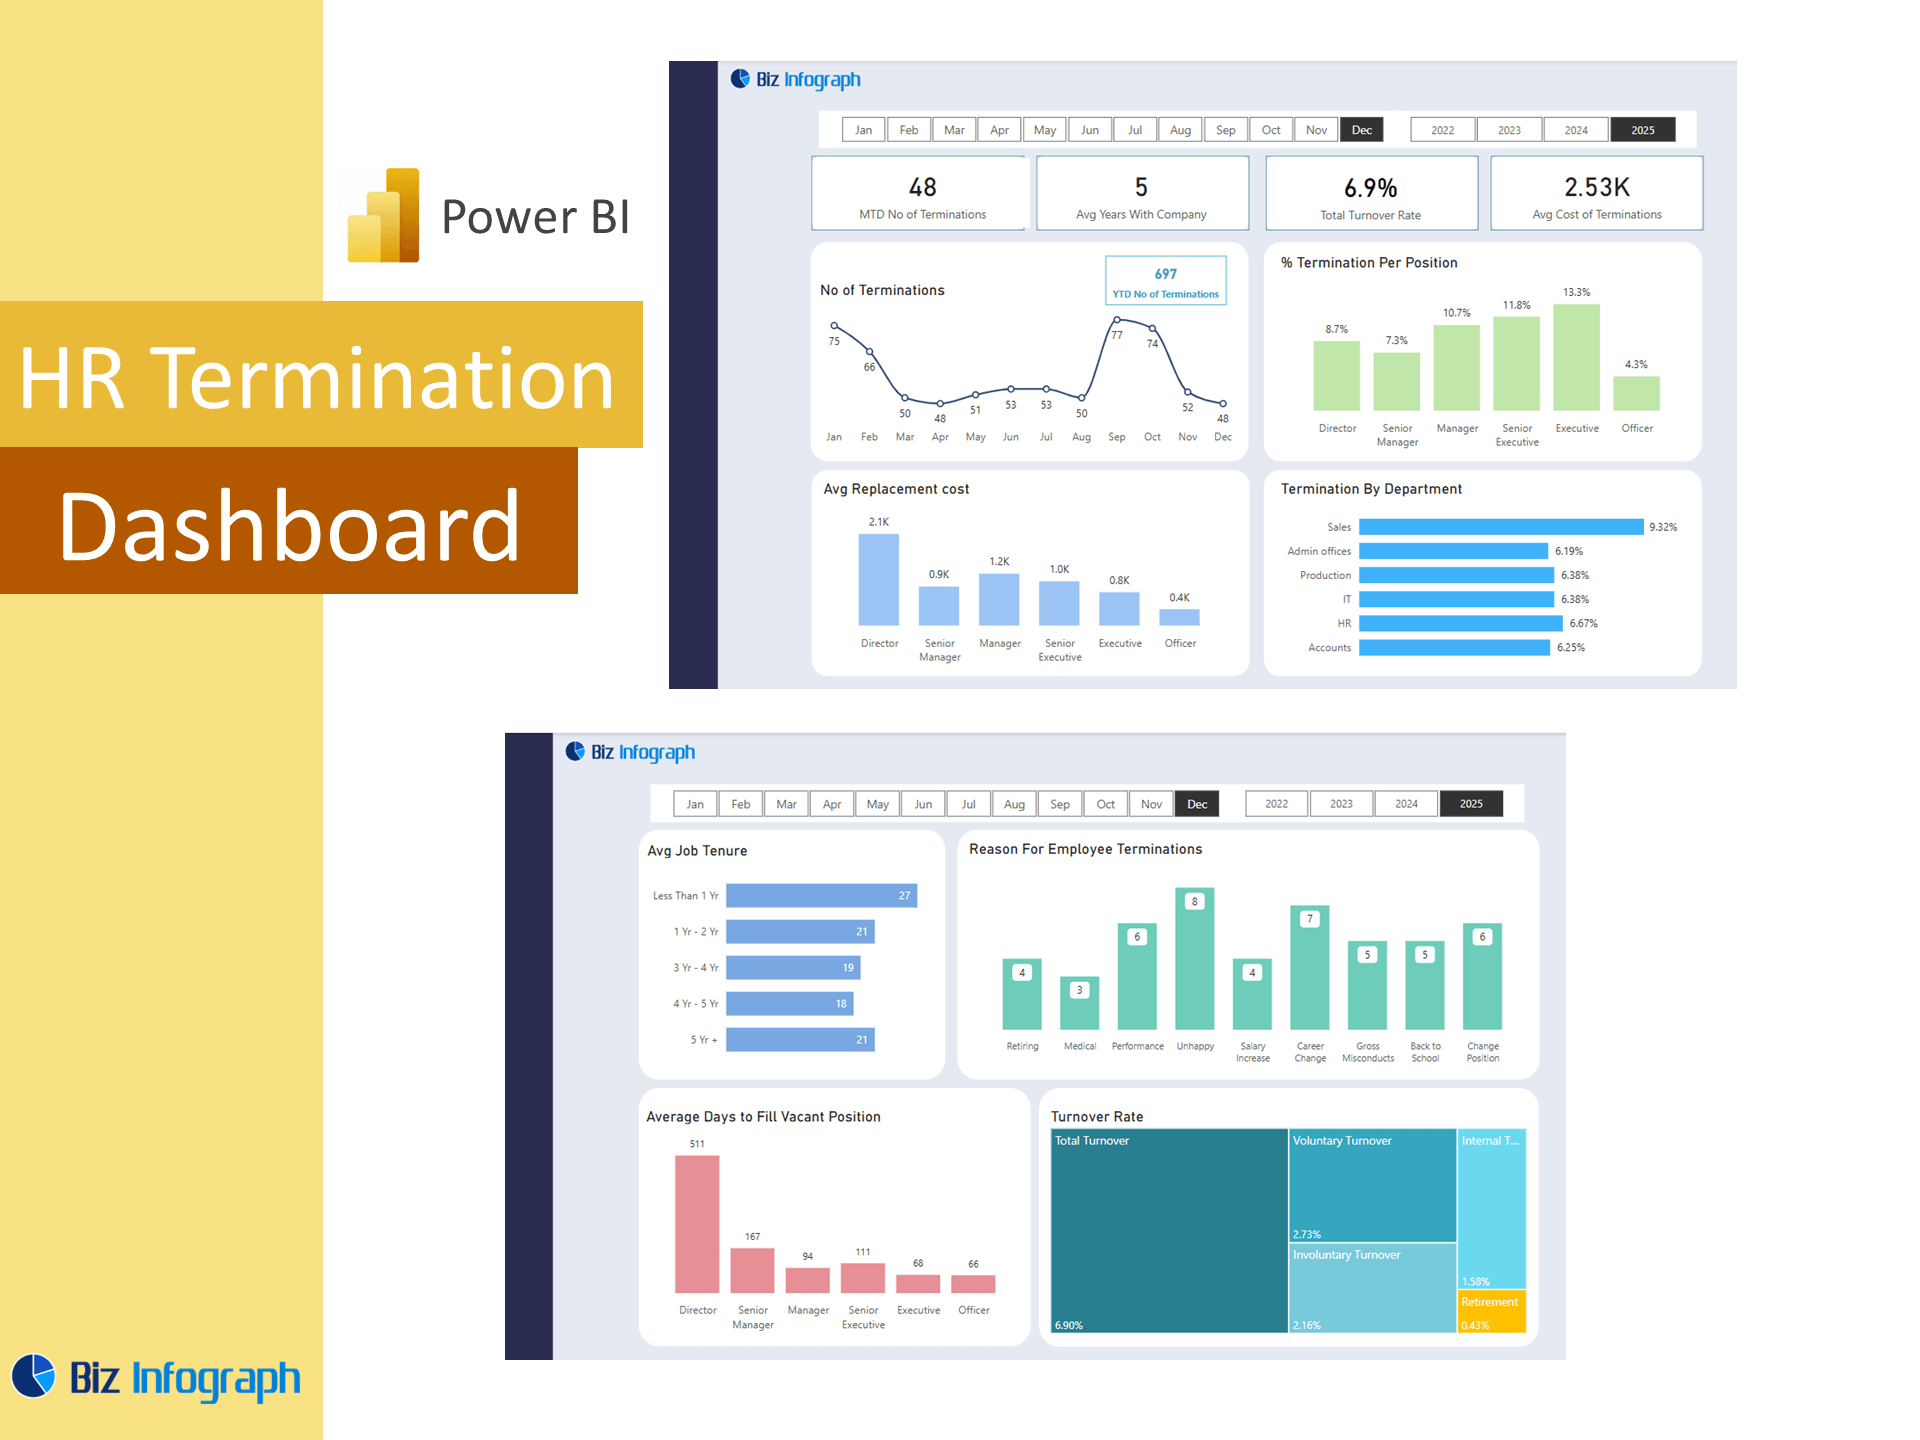
Tracking the right HR metrics is essential for understanding workforce health. A termination dashboard should monitor turnover rates, attrition by role or department, satisfaction levels before exit, and replacement timelines. These performance metrics not only provide a lens into the present but also serve as predictive indicators of future workforce risk. Dashboards visualize data trends, such as sudden turnover spikes or repeated exits from a single team. Combined with salary distribution and headcount changes, HR can plan for growth or downsizing with confidence. The inclusion of such data within a unified Power BI solution supports informed decision-making for both tactical and strategic HR goals.
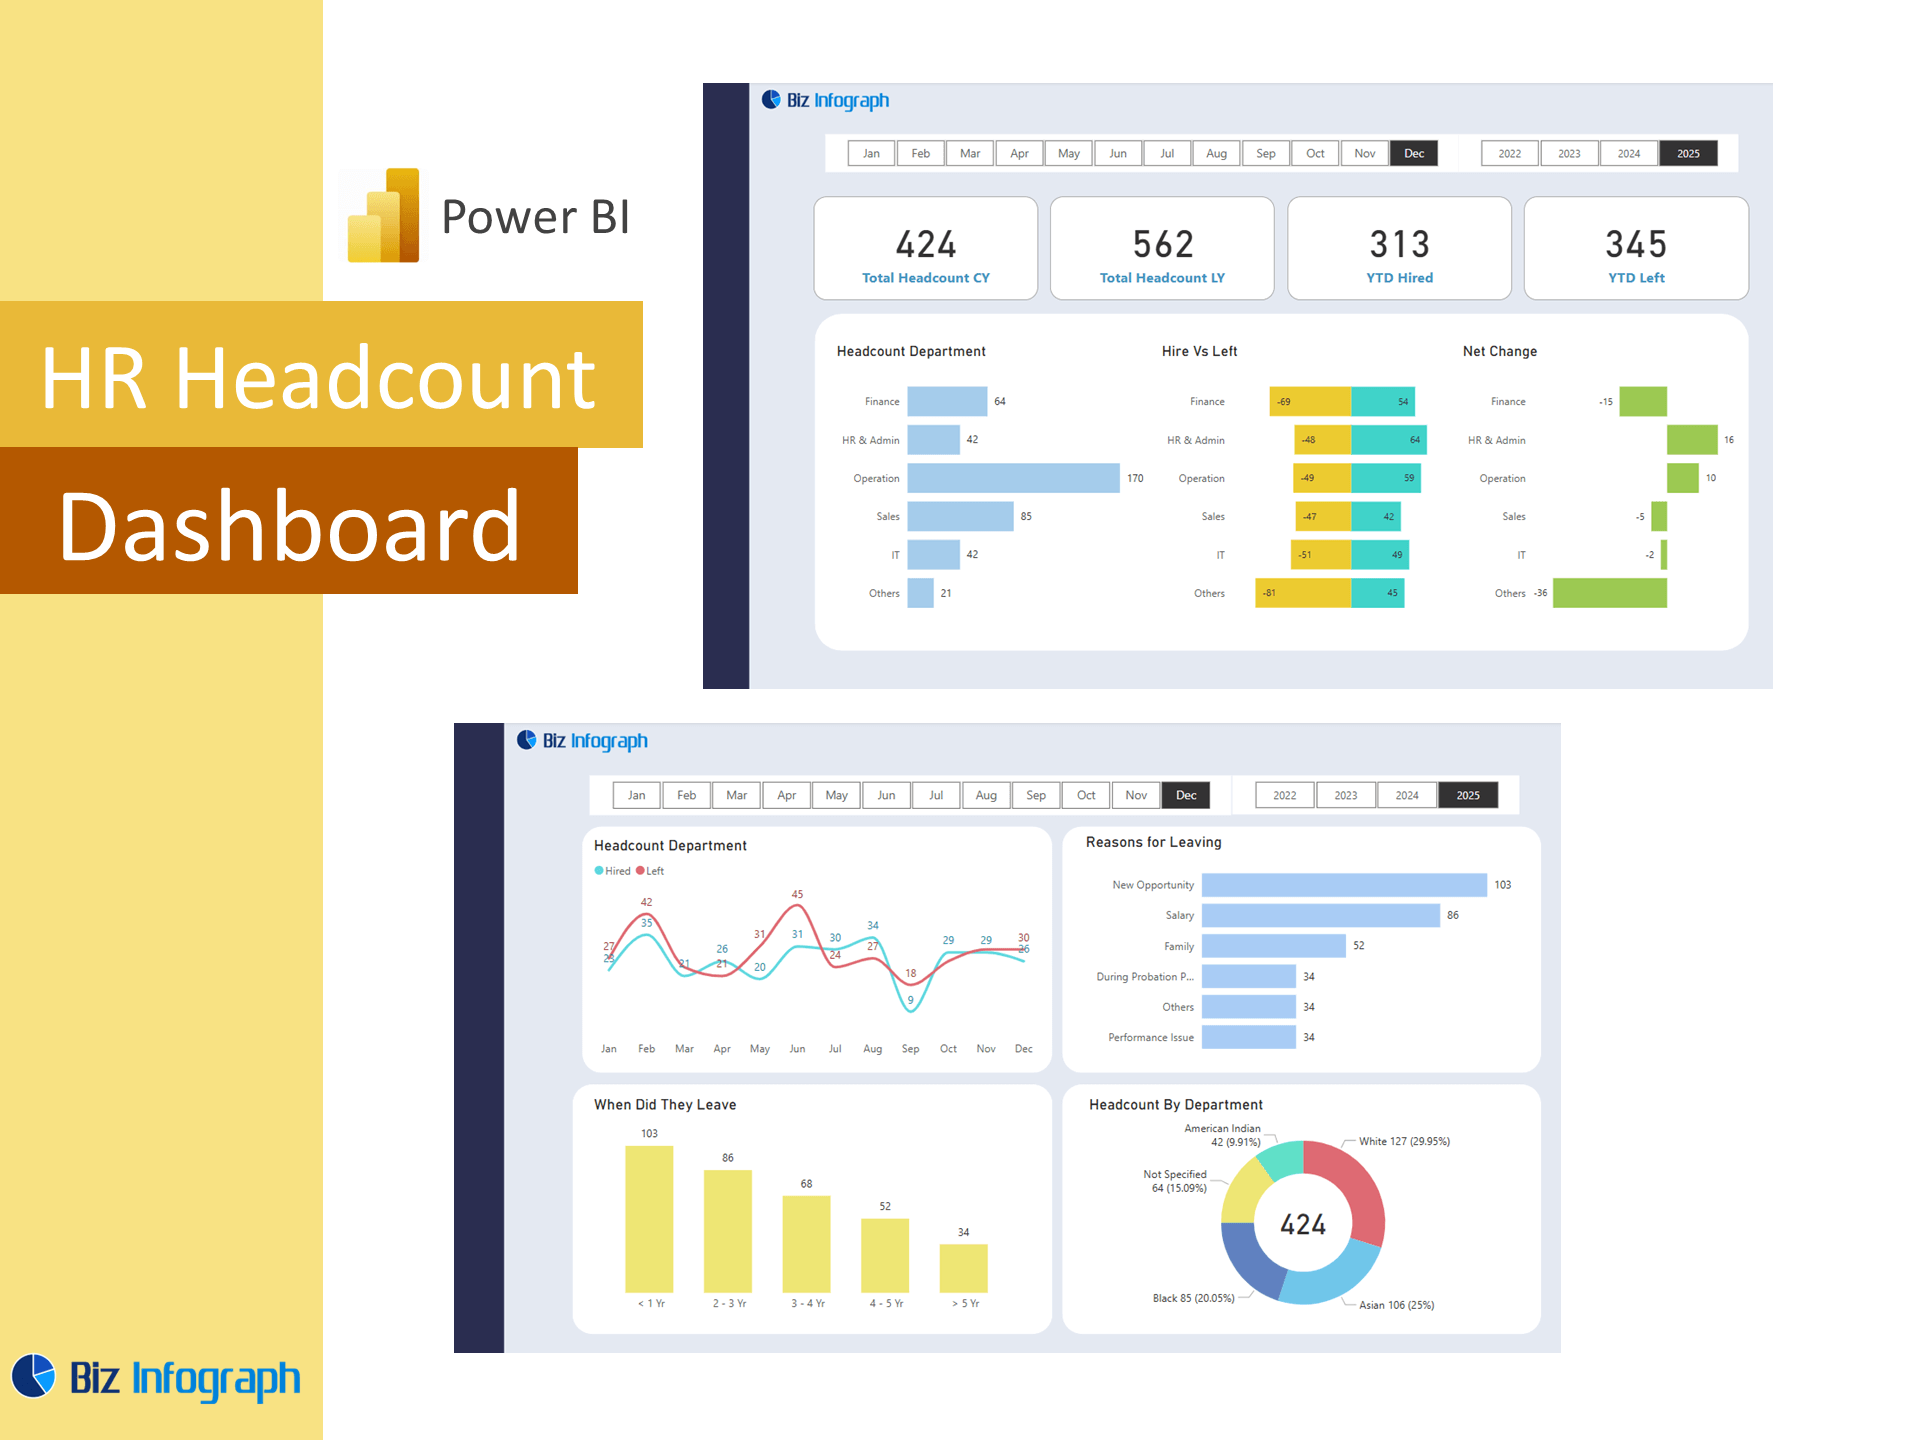
Integrating HR Data for a Comprehensive Analytics Solution
To develop a truly comprehensive Power BI termination dashboard, integration is key. Pulling from payroll systems, employee satisfaction surveys, exit interviews, and performance records creates a holistic picture of why employees leave. With Power BI Desktop, HR can prepare complex data using data modeling, while the Power BI Service allows for seamless sharing with leadership and line managers. This kind of data analytics helps hr managers to identify trends hidden within large volumes of information. By aggregating employee data and applying data transformation techniques, the dashboard empowers HR to respond to exit trends, refine HR strategies, and improve organizational stability.
Leveraging Insights for Better HR Decisions
Delivering Actionable Insights Through People Analytics
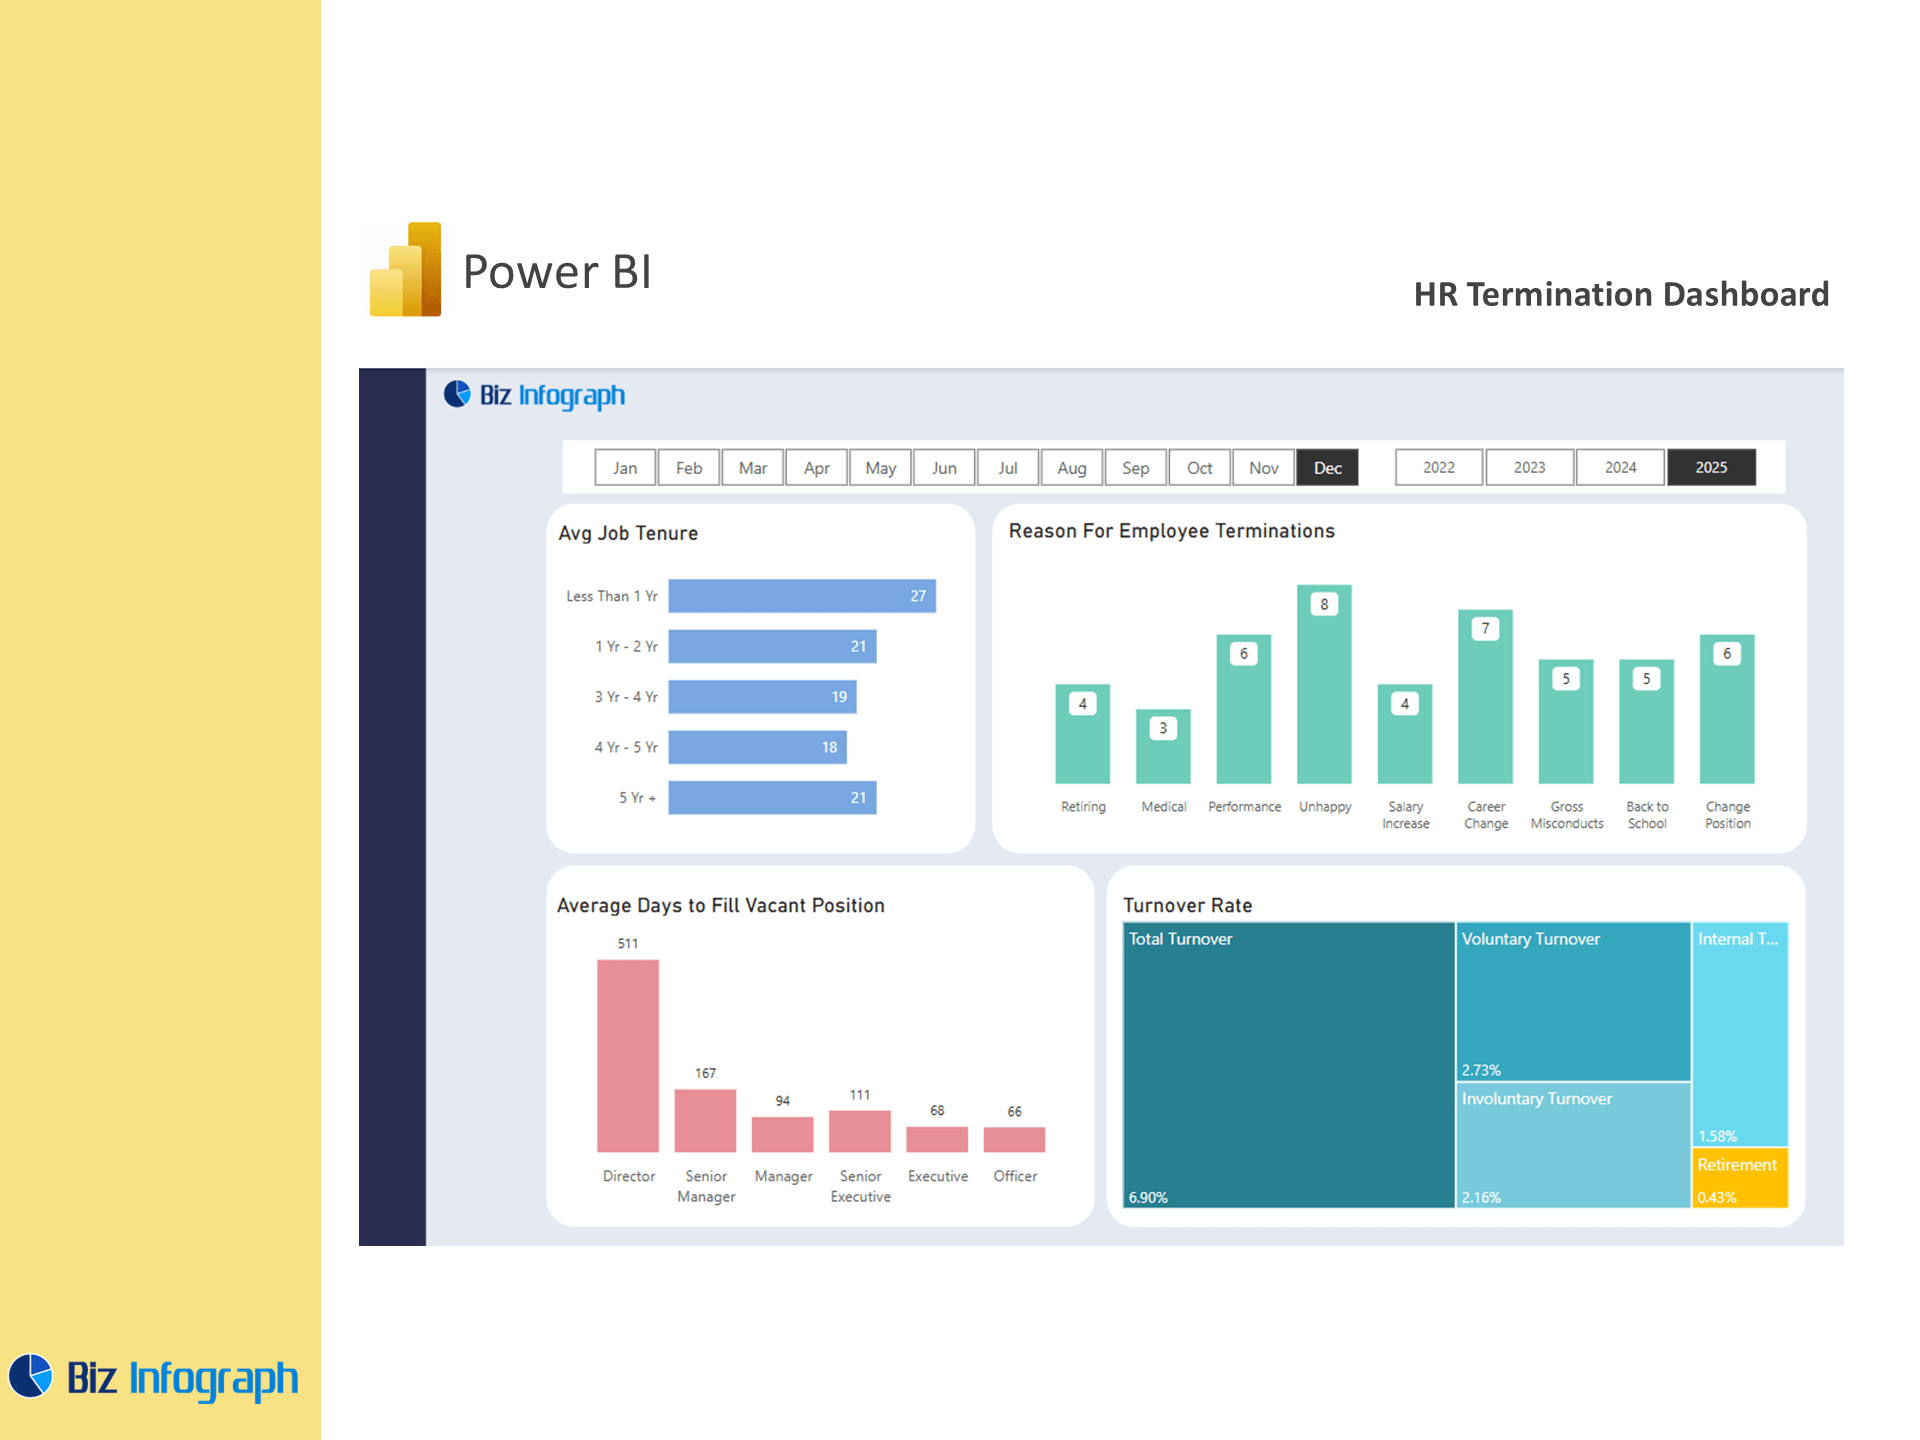
People analytics plays a critical role in converting data into actionable insights. A termination-focused analytics dashboard not only tracks exits but also uncovers underlying causes—such as lack of career progression or misalignment with company values. By linking exits with employee satisfaction, promotions, or employee performance, HR professionals can shape personalized retention strategies. These insights also help HR assess whether specific departments require additional support or leadership development. Power BI dashboards make these insights visual, interactive, and shareable—ensuring the data reaches decision-makers in time to take preventive action. In doing so, they help HR teams maintain business continuity and employee morale.
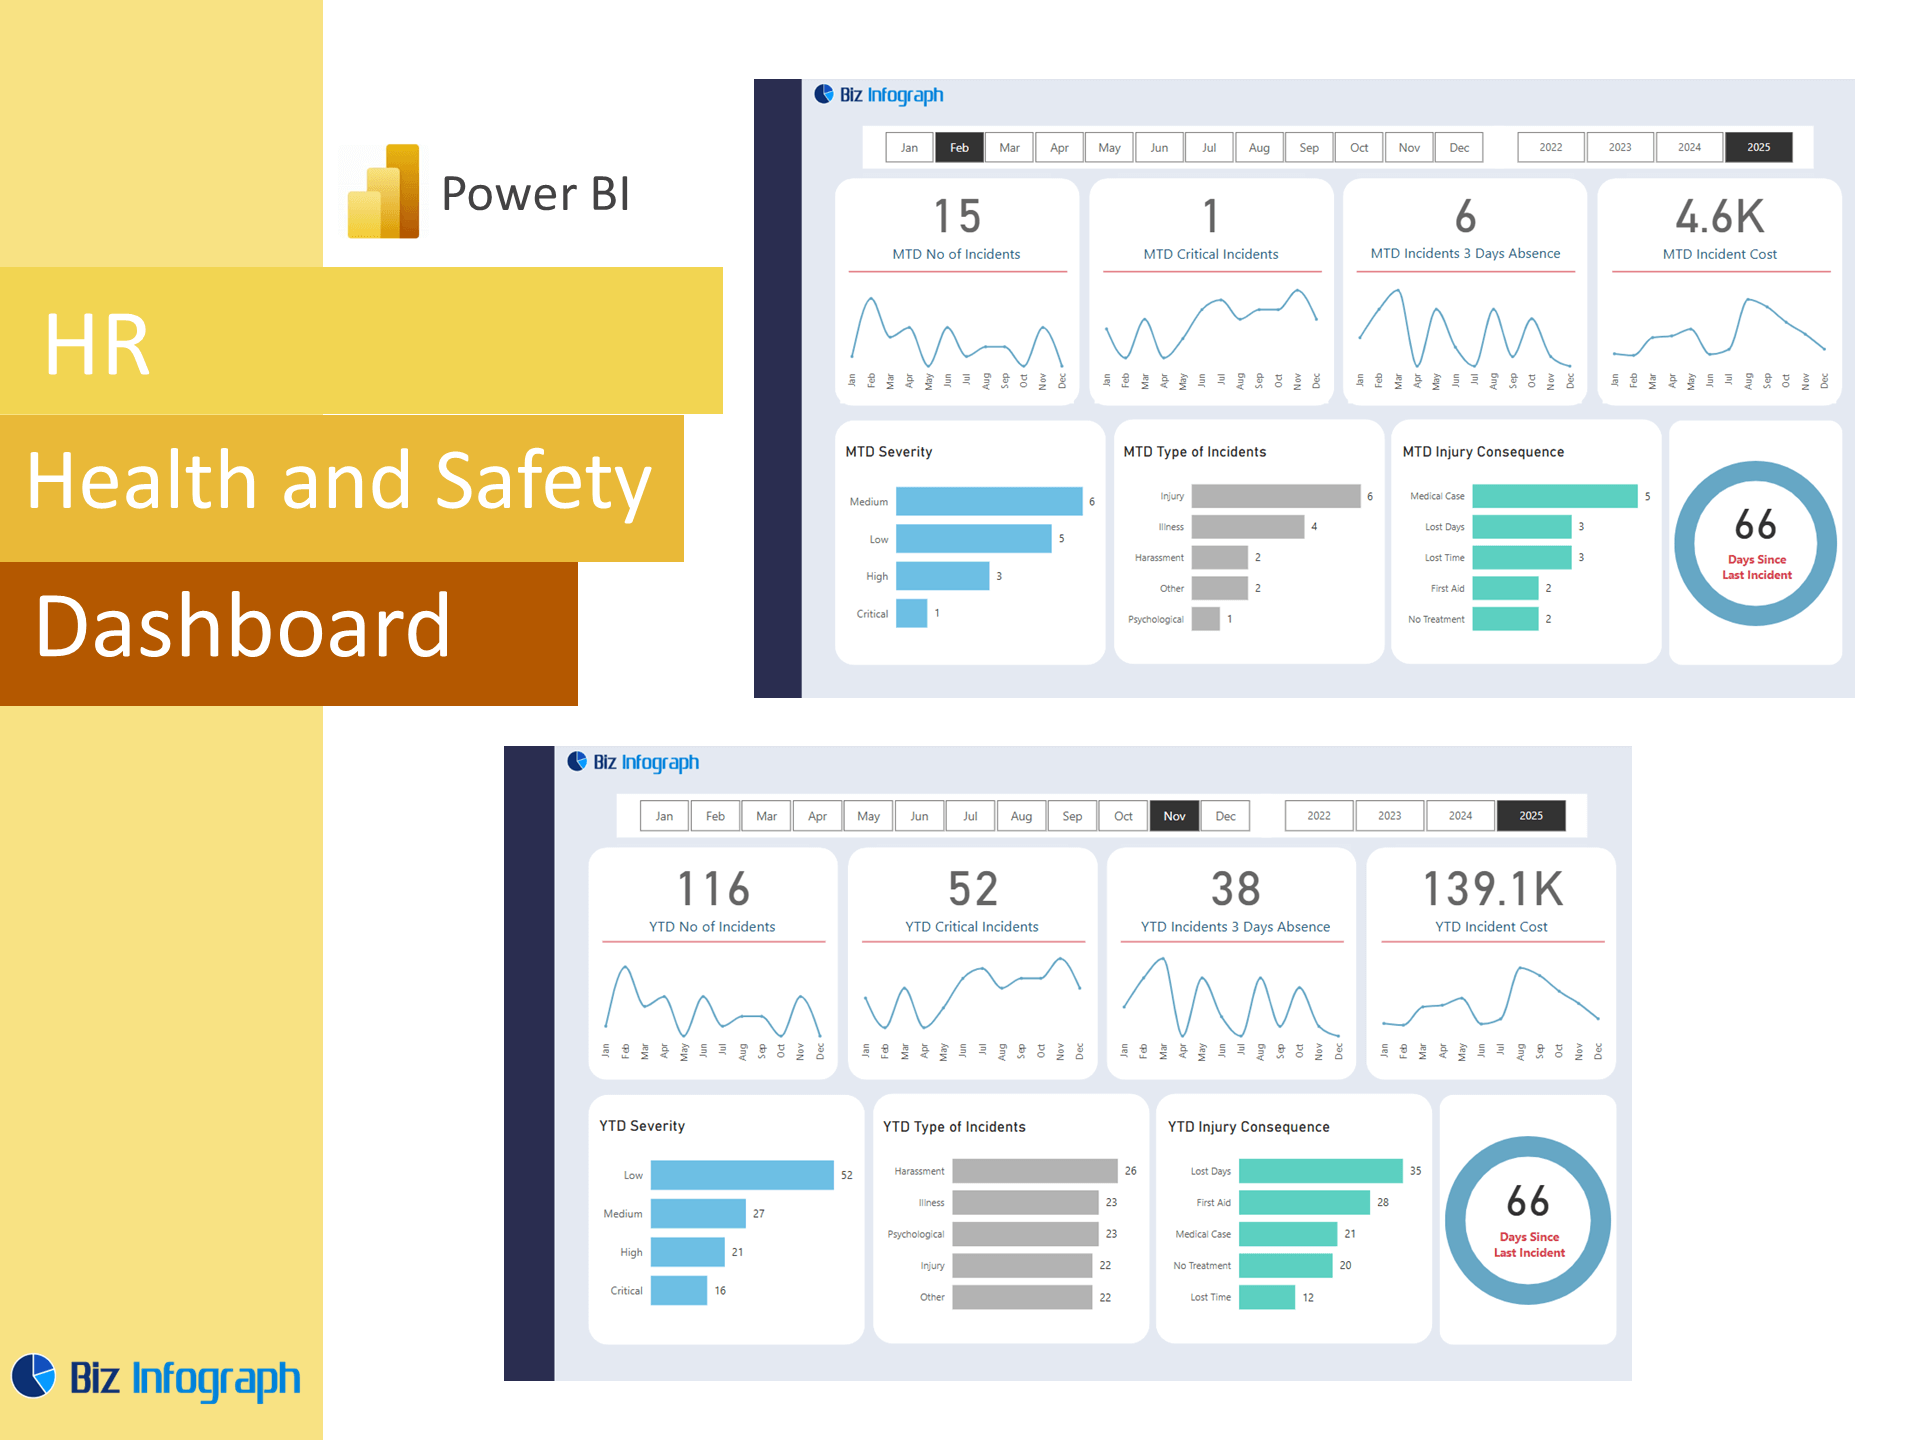
Effective Use of Workforce Analytics in Termination Trends
The effective use of workforce analytics enables organizations to move beyond reporting toward true predictive capability. A robust Power BI HR dashboard helps HR teams proactively identify risk areas and take corrective action. For example, tracking termination trends alongside absenteeism and employee satisfaction might reveal early signs of disengagement. By using these dashboards, HR professionals can also highlight the effectiveness of previous HR strategies—e.g., training programs, wellness initiatives, or leadership coaching—and their impact on retention. This kind of data-driven decision-making supports continuous improvement and encourages a culture of transparency and accountability across the human resources function.
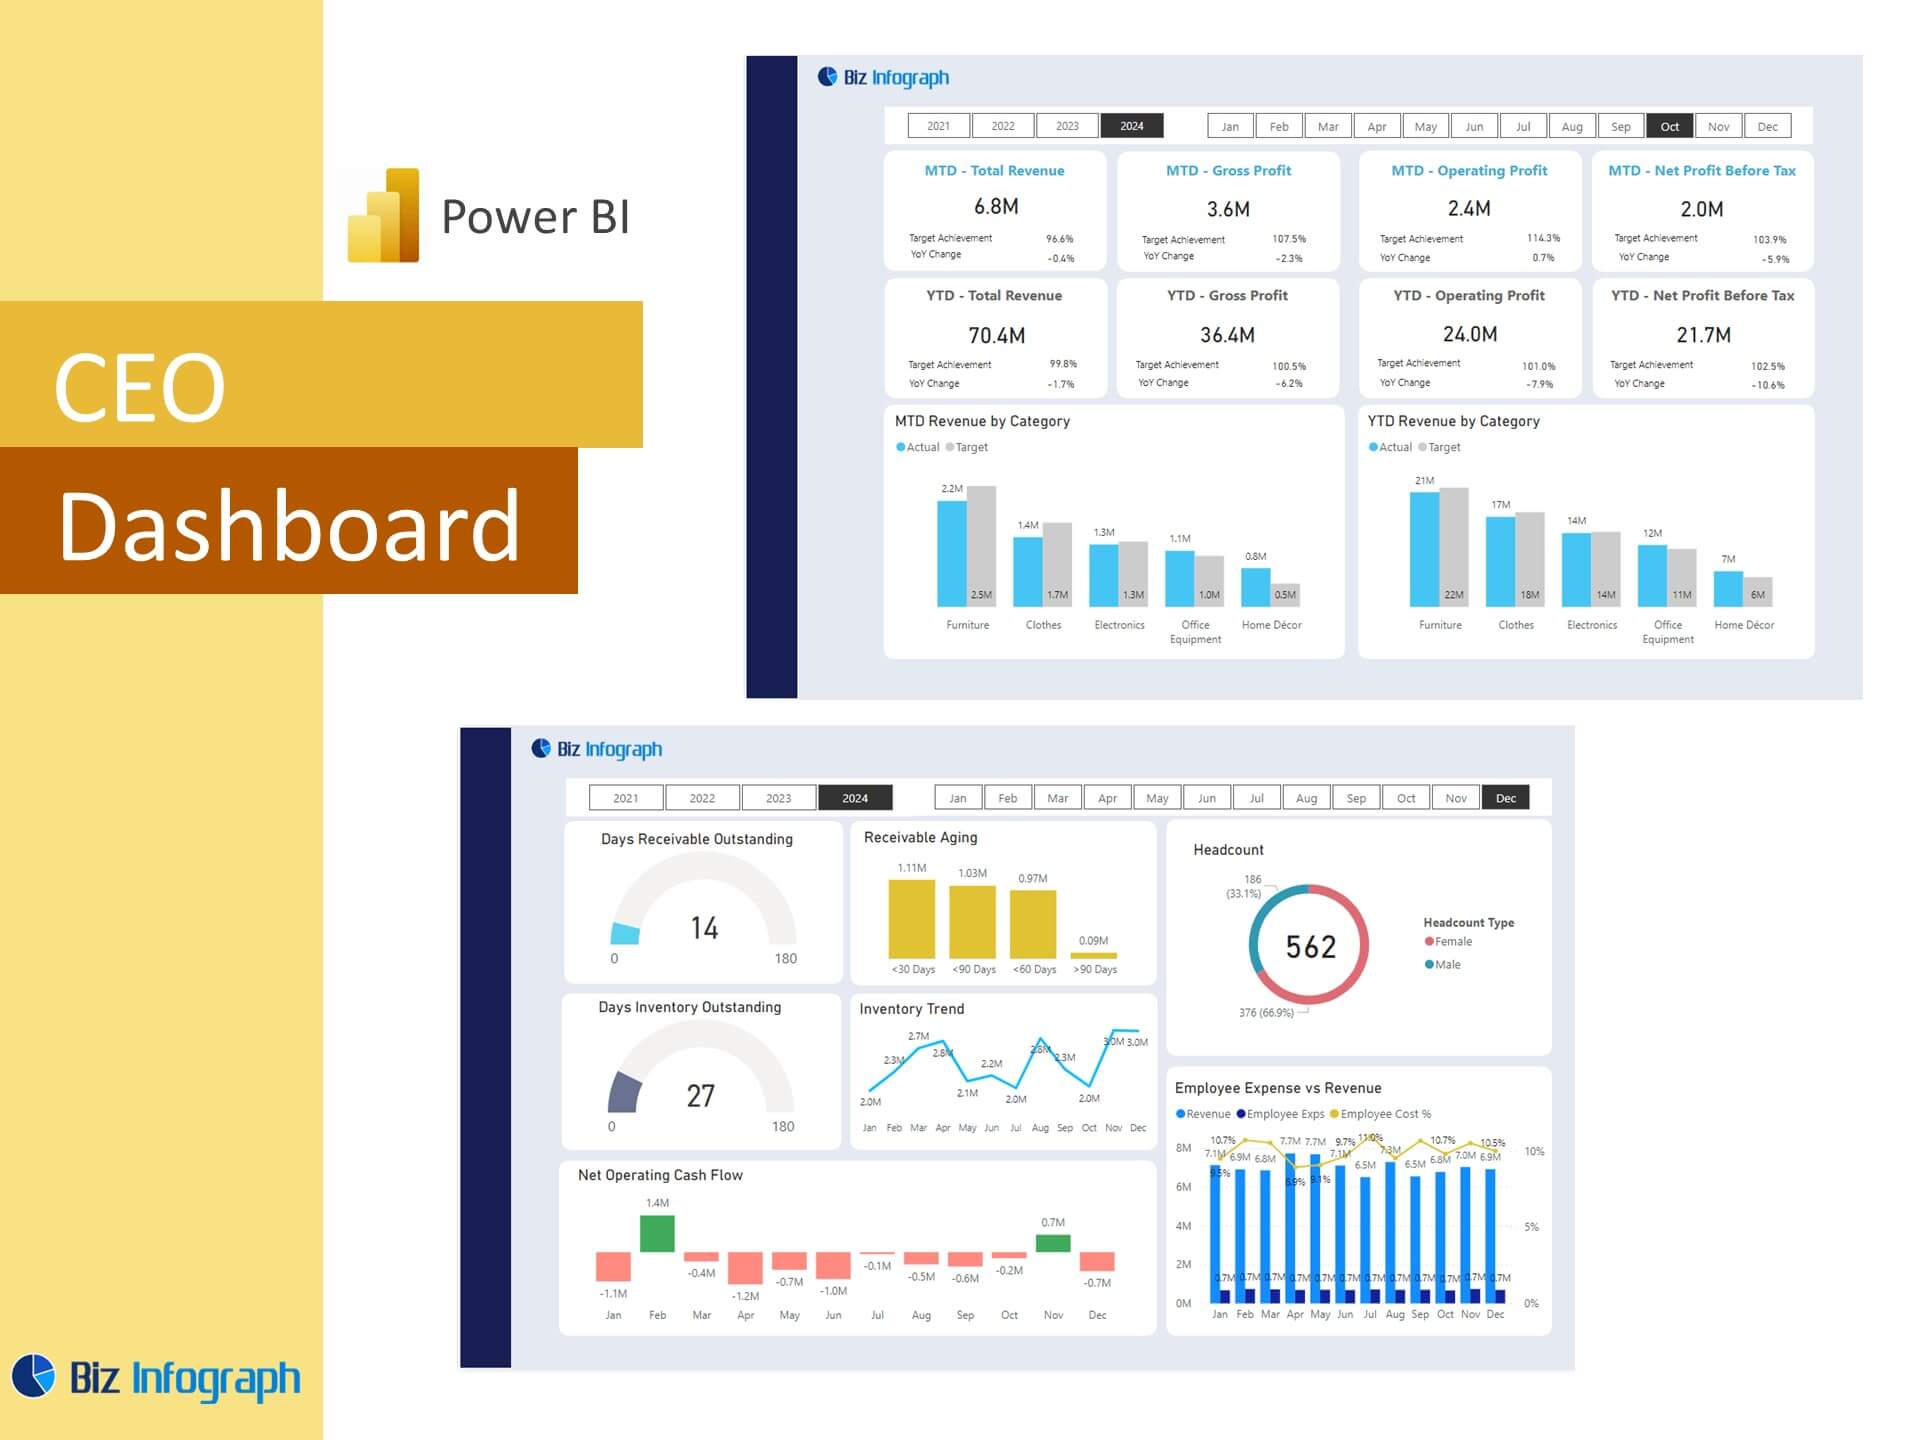
Empowering HR Leaders with Power BI Dashboards
Power BI HR dashboards serve as strategic enablers for HR leaders, equipping them with the data and tools needed to make evidence-based decisions. These dashboards allow executives to explore termination analysis, visualize the impact of HR interventions, and report progress to stakeholders with clarity. Through a combination of data-driven storytelling and real-time dashboard features, HR leaders can align workforce strategies with business objectives. The insights gained from these dashboards also support broader organizational goals such as diversity, inclusion, and employee retention. Ultimately, Power BI helps HR leaders transform insights into action, drive better outcomes, and elevate HR’s role as a business partner.
For ready-to-use Dashboard Templates: