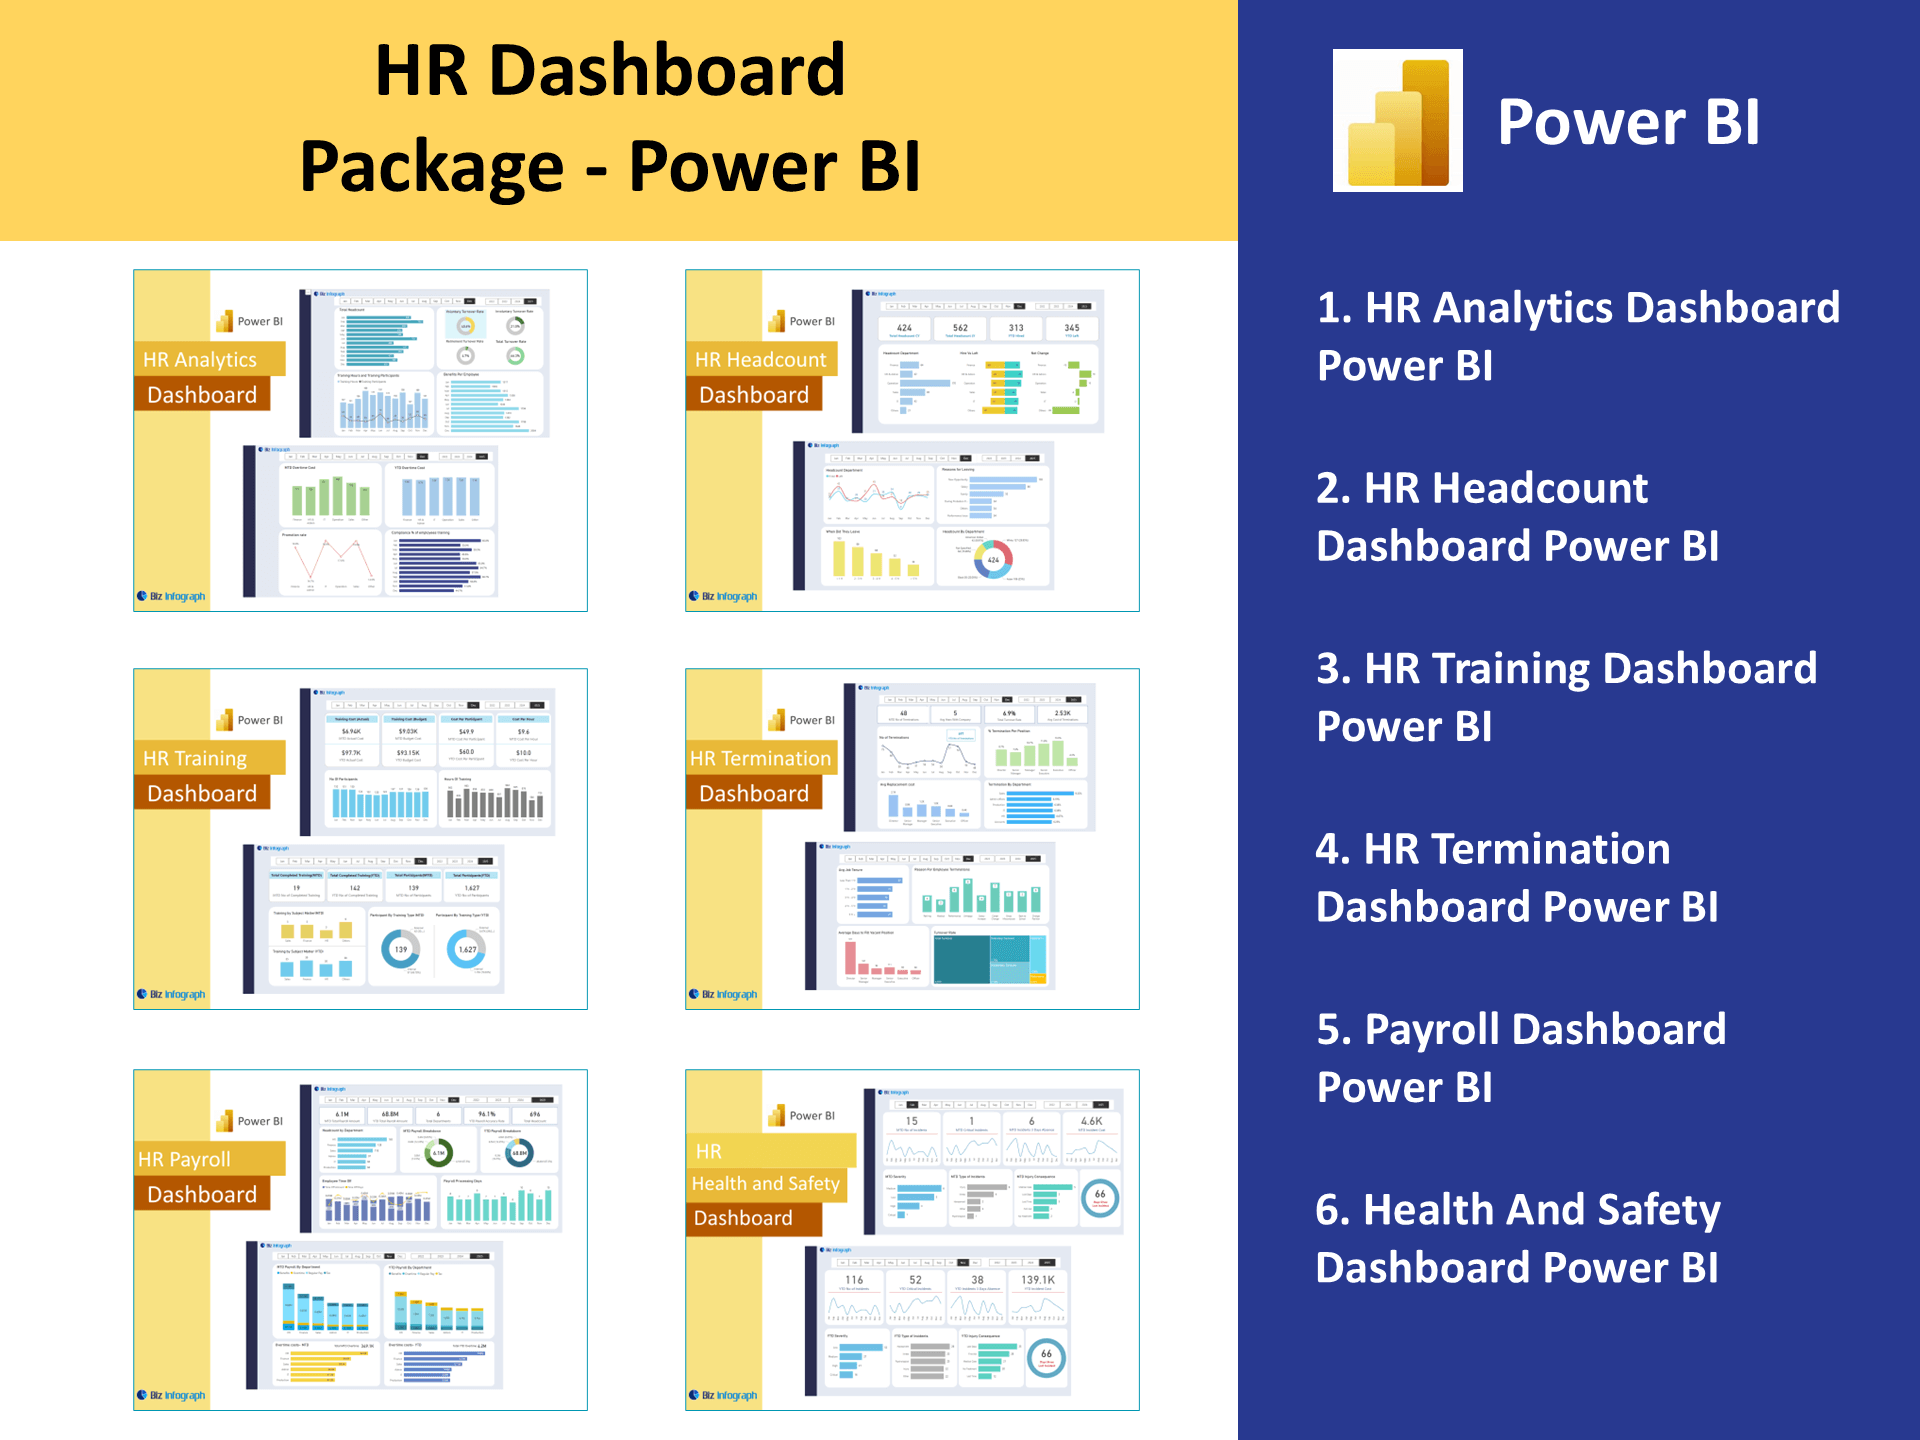
Health and Safety Dashboard Power BI
Introduction to Health and Safety Dashboards in Power BI
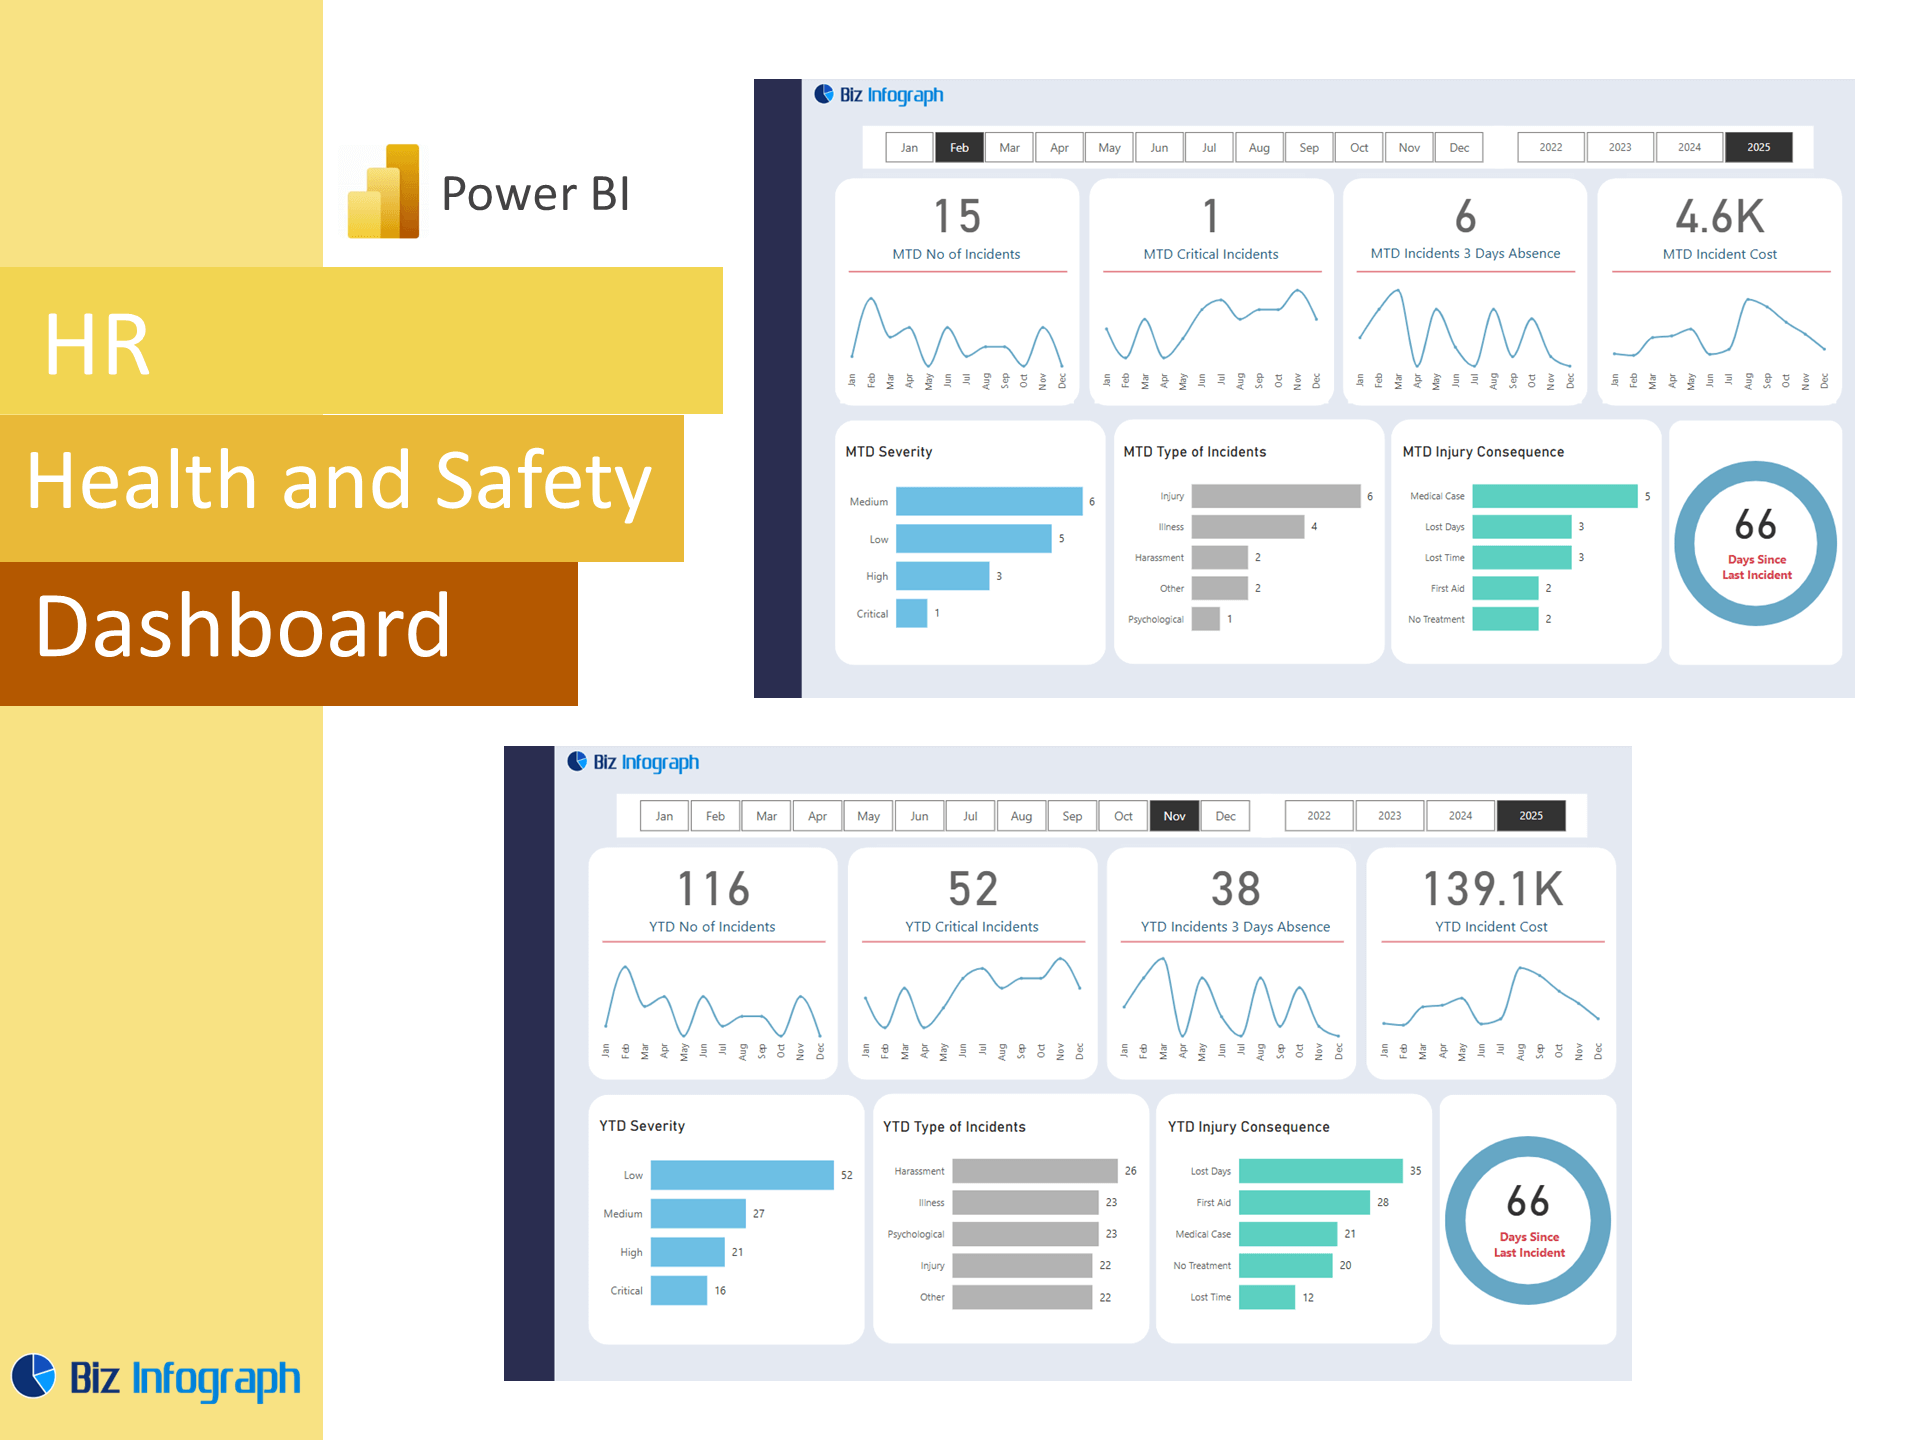
What is an EHS Dashboard and Why It Matters
An EHS (Environment, Health, and Safety) dashboard is a visual, interactive platform that helps organizations visualize safety trends, track safety data, and monitor incident reporting in real time. A modern safety dashboard offers a comprehensive view of safety metrics such as incident counts, injury rates, compliance status, and near-miss reports. These dashboards assist EHS professionals and EHS managers in aligning with safety compliance standards and proactively mitigating risks. Unlike traditional EHS software, a Power BI for EHS solution integrates data from various data sources and delivers more up-to-date, customizable, and accessible reporting options. It empowers users to harness data and transform it into critical, data-based decisions that enhance workplace safety.
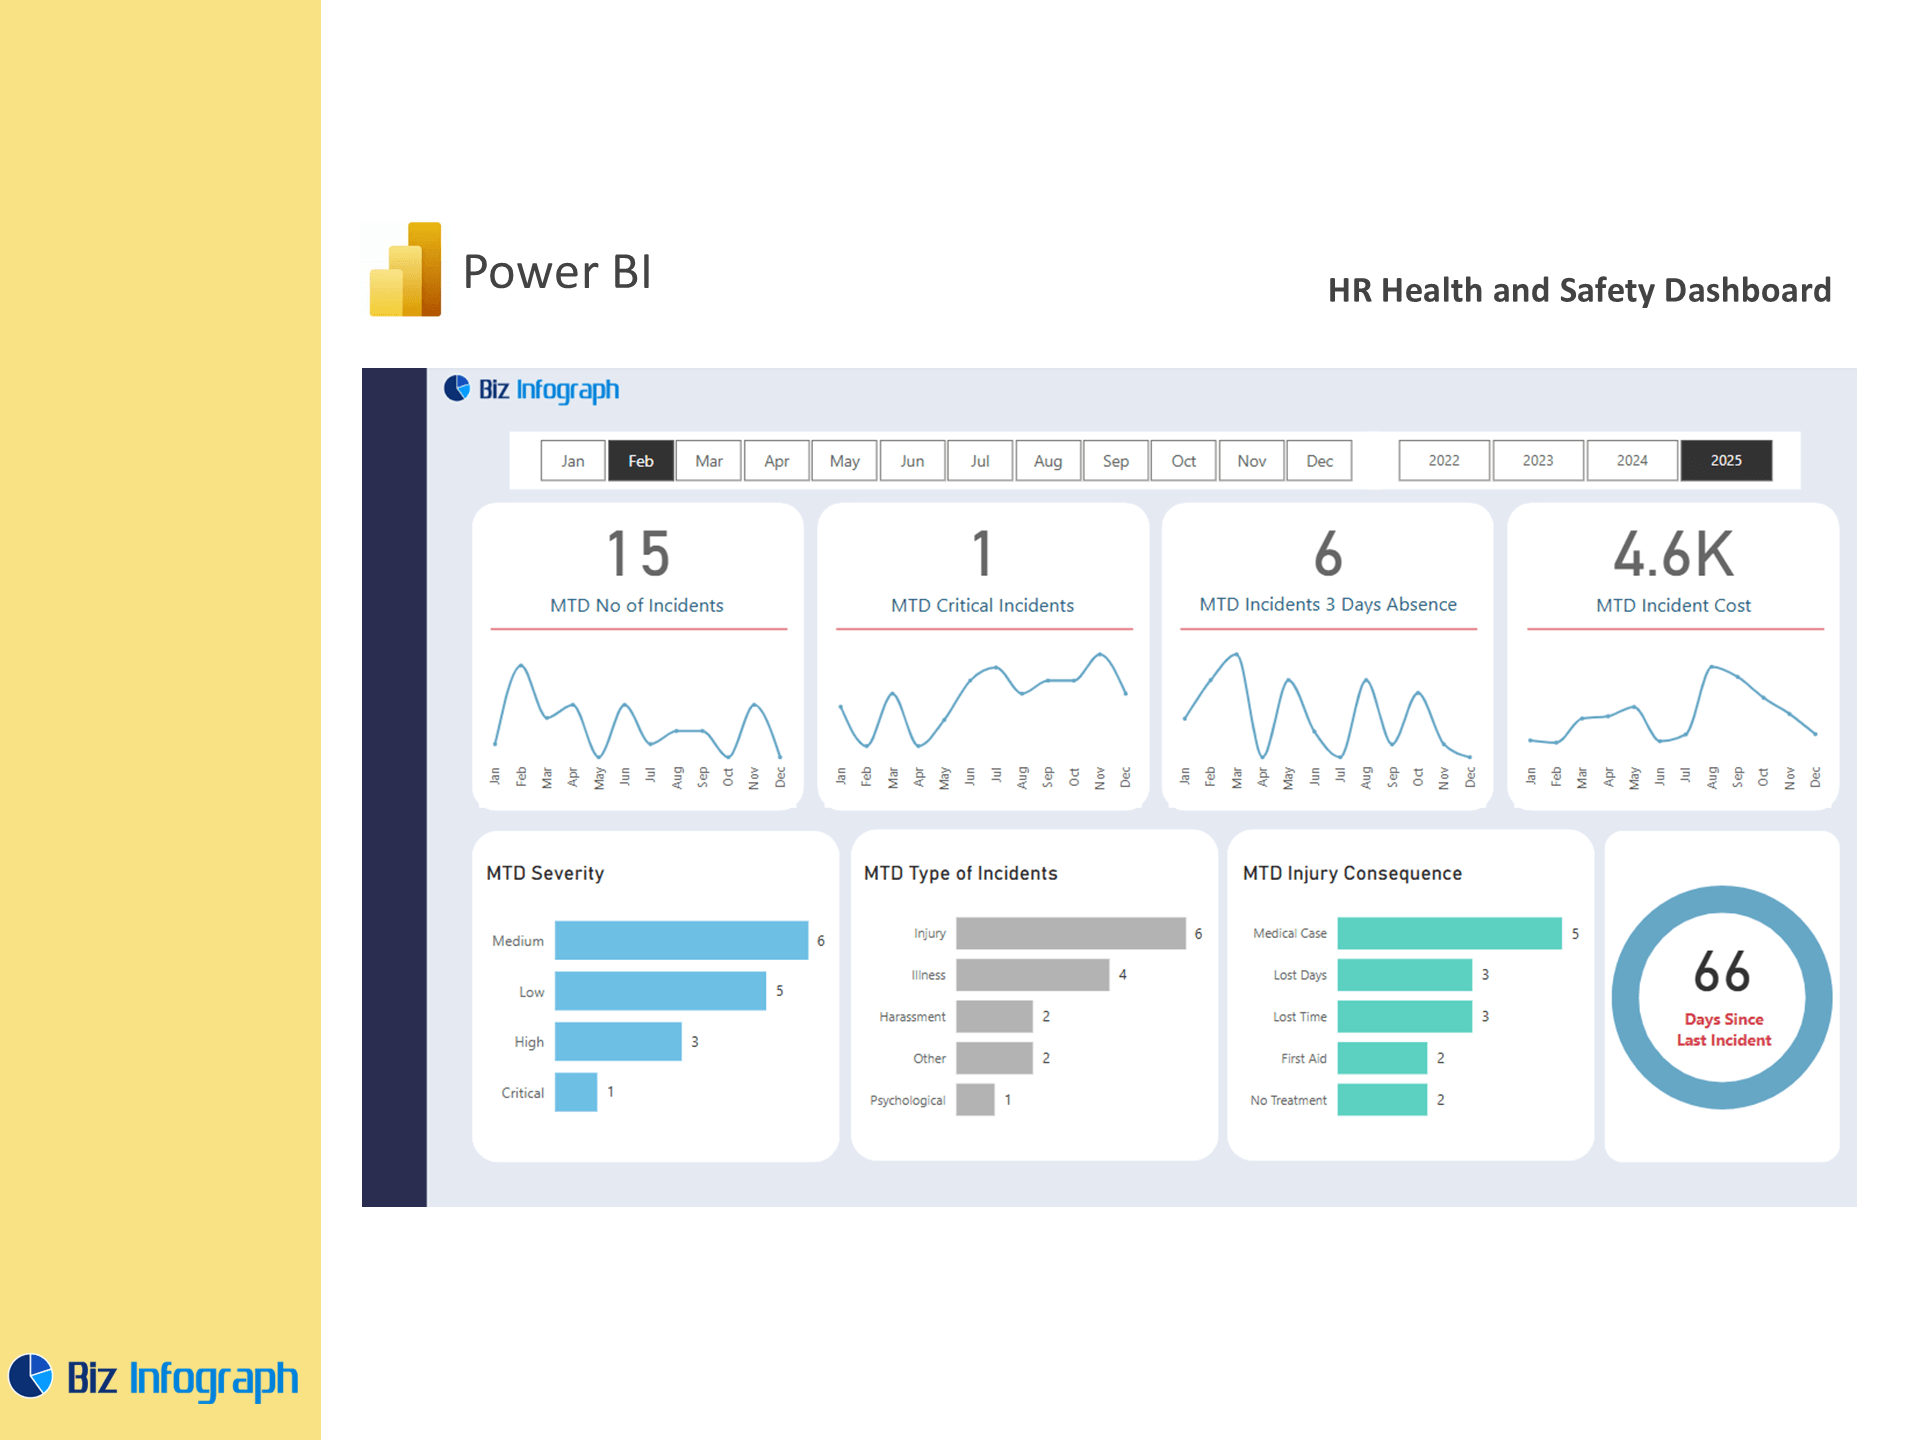
How Power BI Transforms Health and Safety Reporting
Microsoft Power BI significantly enhances the way safety reporting is done across industries. Through powerful data models and visuals, Power BI helps turn raw data into actionable insights. With real-time tracking of safety incidents, near-misses, and corrective actions, it gives organizations the ability to monitor safety in dynamic environments. Power BI is best known for its capability to consolidate complex EHS statistics and incident reporting data into streamlined dashboards and visual summaries. It supports dashboards and reports that can be customized for various departments, increasing the efficiency of operations. With the power query editor, users can clean and prepare data, helping EHS professionals track key performance indicators (KPIs) with clarity and precision.
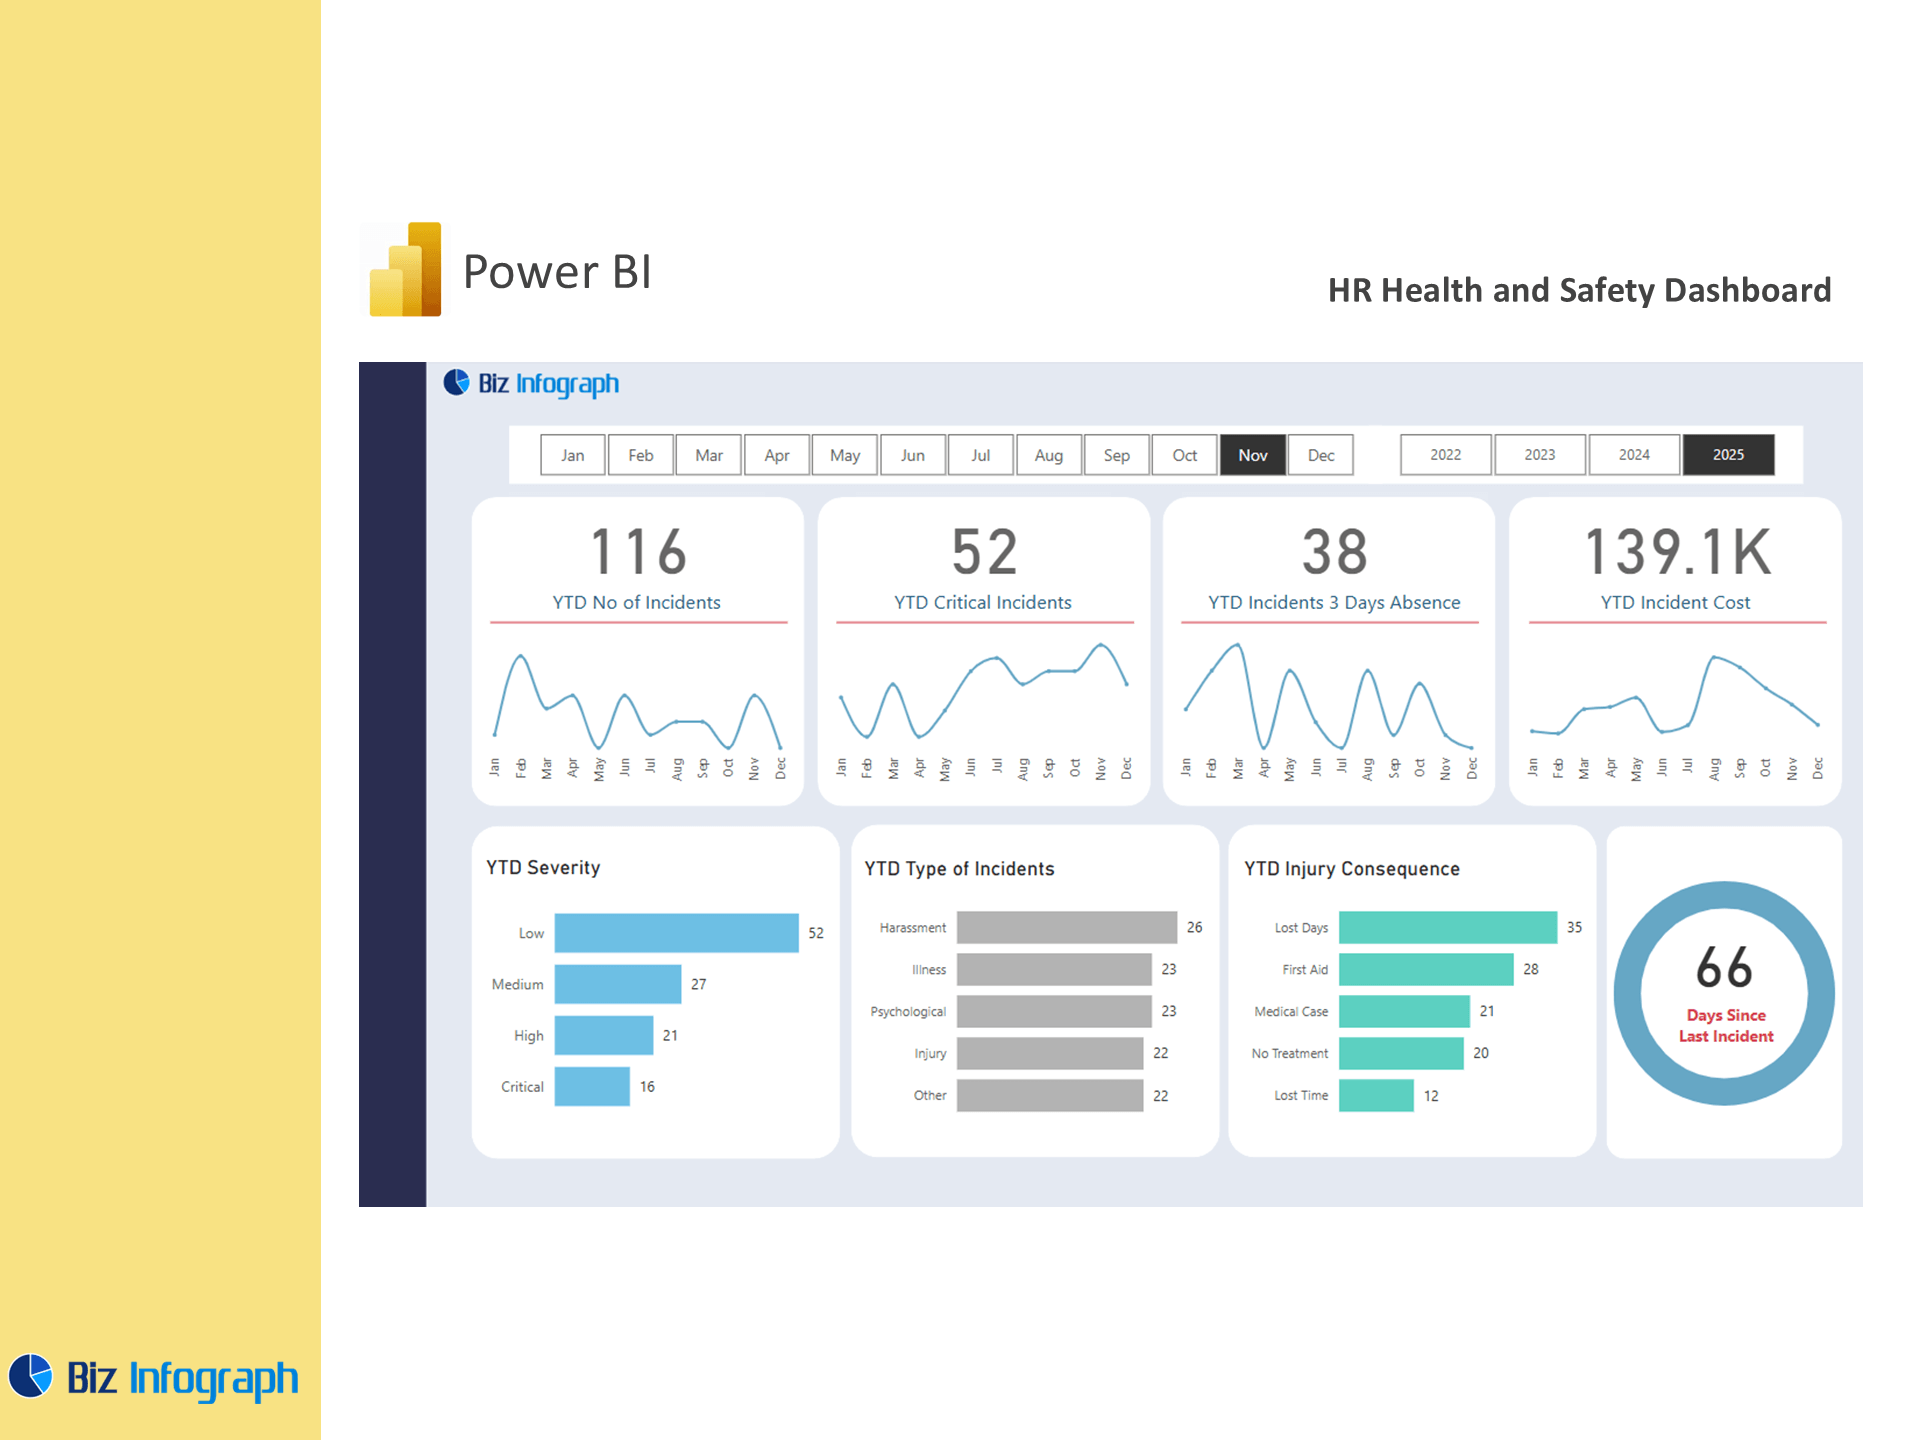
Benefits of Using Microsoft Power BI for EHS Analytics
Power BI for EHS analytics allows for centralized, scalable reporting that adapts to evolving safety requirements. Leveraging the full suite of Microsoft Power BI, users can easily build custom dashboards, automate reports, and integrate data from third-party applications or internal systems. The Power BI service allows safety reports and dashboards to be visible to all employees, from frontline staff to executives, improving organizational transparency. This accessibility helps unify the EHS vision, increase visibility, visualization, and promote accountability. Furthermore, Power BI enables the development of data models that track KPIs like injury rate, incident closure time, and training completion. For organizations committed to safety excellence, BI is best for EHS reporting and up-to-date information sharing.
Building an Effective Health and Safety Dashboard
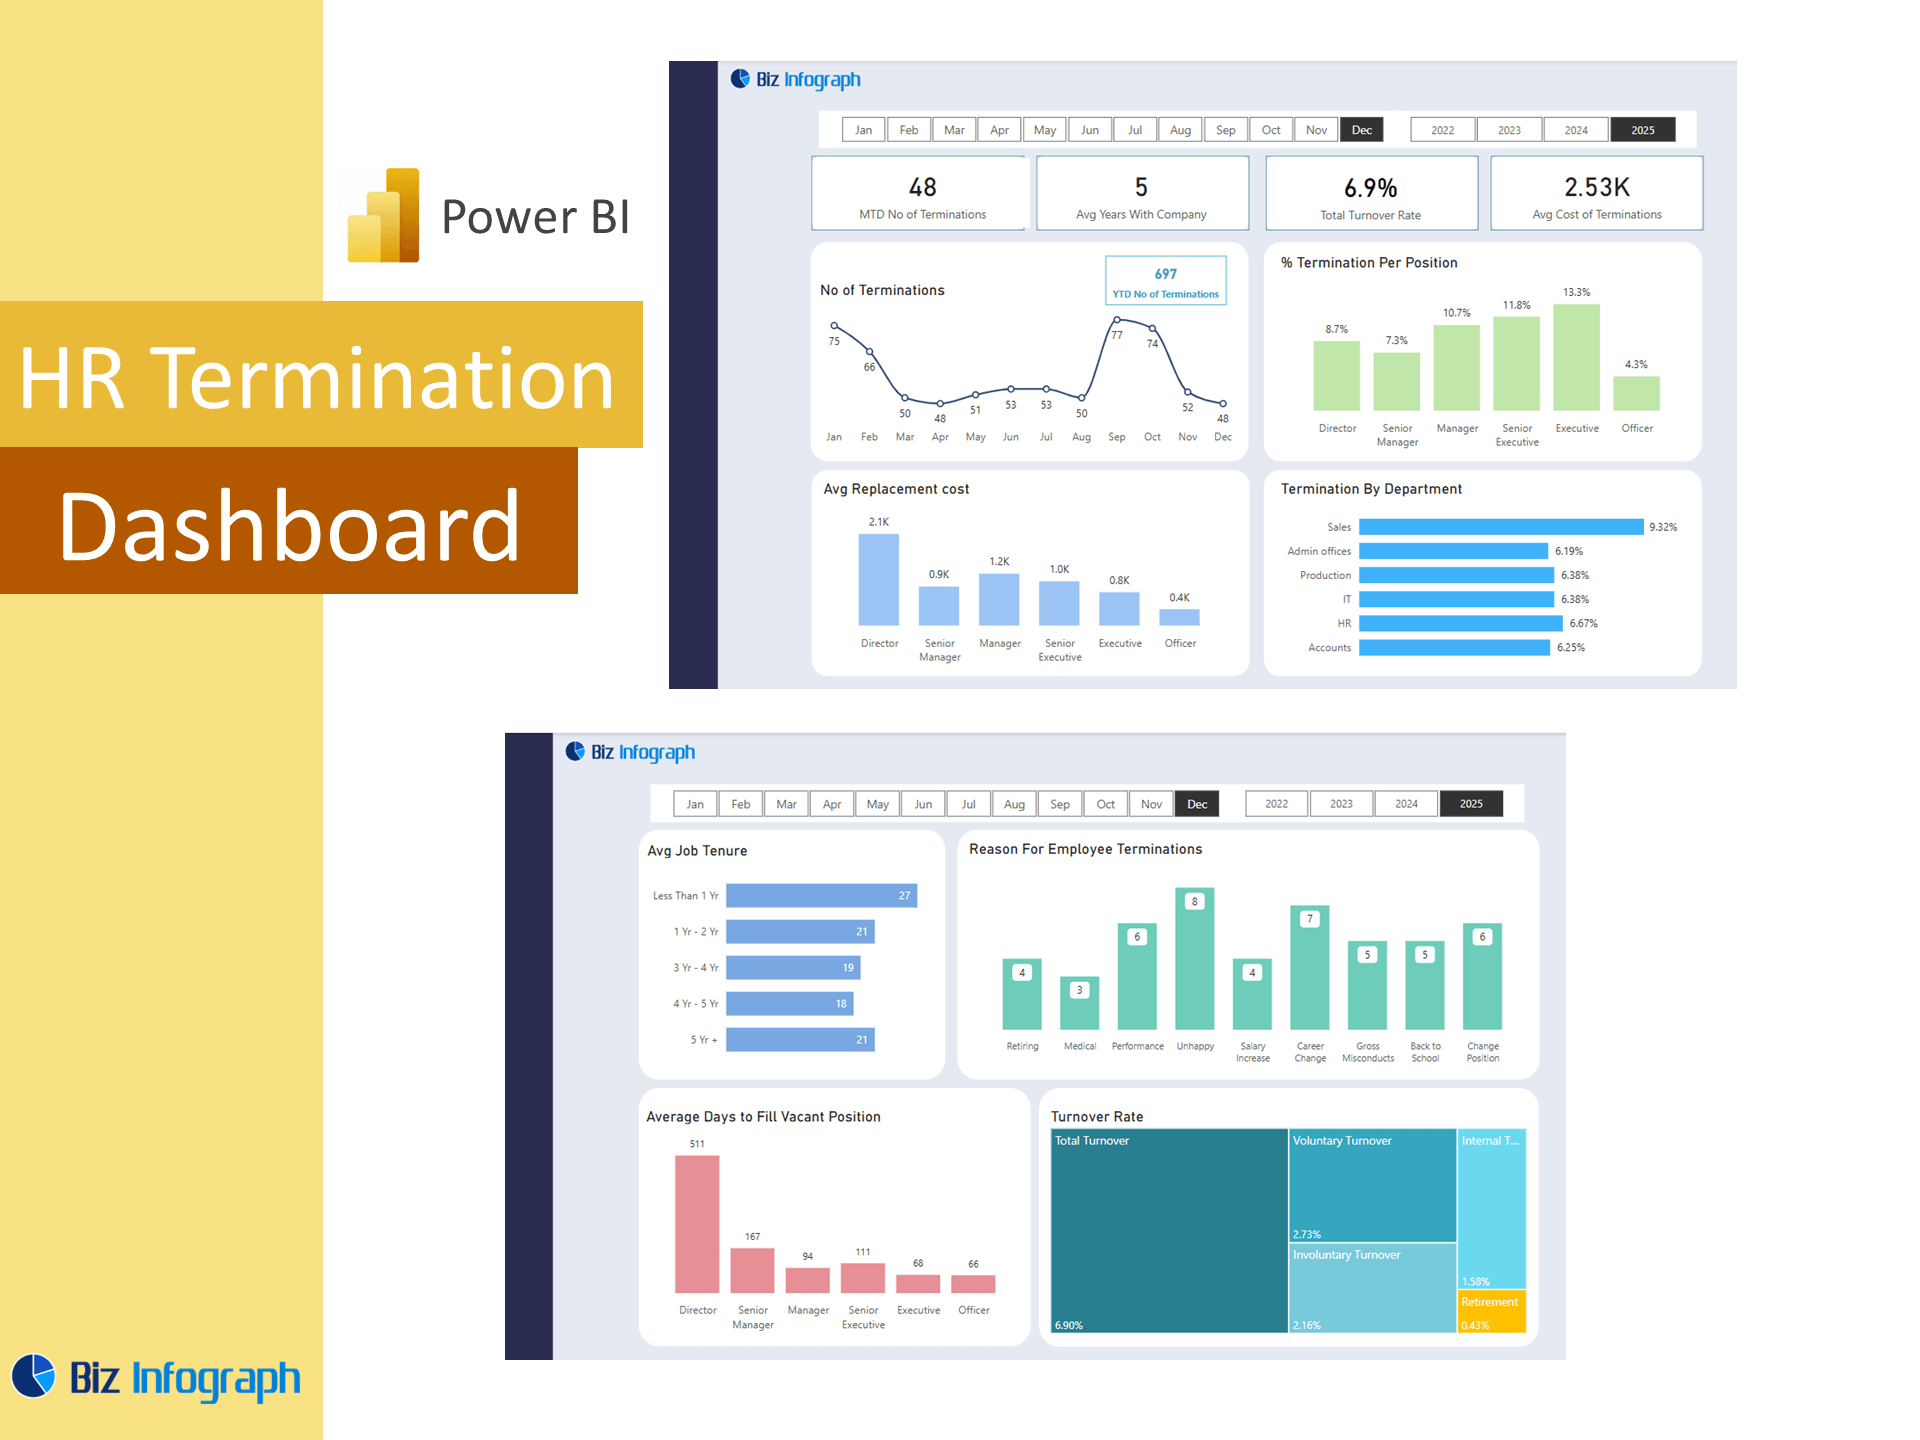
Key Components of a Power BI EHS Dashboard
An effective Power BI EHS dashboard consists of visuals that track core metrics such as safety incidents, risk management status, employee safety training, and EHS performance benchmarks. Configuring dashboards using Power BI includes selecting relevant EHS data right next to operational inputs—like machinery uptime, shift patterns, or site-specific risk levels. Interactive visuals such as heatmaps, KPI tiles, and trend lines allow users to visualize safety trends and filter results based on date, location, or type of incident. The dashboard helps both executives and EHS professionals to interpret trends based on EHS trends and take timely action. Whether tracking monthly incident rates or identifying high-risk areas, these dashboards turn data into proactive safety strategy.
Leveraging Power BI and Microsoft 365 Integration for Safety Insights
Integrating Power BI with Microsoft 365 offers significant advantages for EHS data management and collaboration. Data from SharePoint, organization’s Office 365, or internal file repositories can be connected directly, allowing EHS teams to pull in audits, forms, and training records without duplicating efforts. This ecosystem improves accessibility—making reports and dashboards visible to all employees throughout the organization. Thanks to Power BI for EHS, teams can leverage Power BI to distribute safety measures, share insights through Teams, and deliver EHS updates via Outlook. This integration creates an efficient BI platform for ongoing EHS analytics, enabling everyone to work with up-to-date and synchronized safety information for better decisions.
Using Real-Time Data and ETL Processes for EHS Performance Monitoring
Real-time safety monitoring relies on strong ETL processes (Extract, Transform, Load) to bring clean, accurate, and timely data into the Power BI dashboard. Using Power Query Editor, teams can configure data pipelines that pull from various data sources such as Excel, EHS software, cloud databases, or on-premise systems. These pipelines automate data refresh, ensuring up-to-date information for effective tracking of EHS performance. Real-time monitoring enables faster response to safety violations and helps organizations stay compliant. This continuous data flow also supports advanced analytics and data analysis like forecasting trends or correlating safety incidents with operational variables. Ultimately, ETL in Power BI ensures that safety data is reliable, structured, and actionable.
Power BI for Risk Management and Business Intelligence
Power BI for EHS Risk Management and Safety Reporting
Power BI for safety is a powerful enabler of risk management in EHS. With dynamic dashboards, EHS professionals can categorize risks by severity, type, and frequency, and monitor progress on mitigation plans. Risk matrices, incident trend lines, and root cause visuals support smarter analysis with Power BI spreadsheet. Users can highlight recurring safety issues and align them with predictive trends for better planning. Reporting in Power BI ensures that leadership receives digestible summaries while EHS managers can drill down into operational insights. When it comes to aligning data with action, Power BI helps bridge the gap between safety data and real-world safety behavior improvements.
Enhancing EHS Analysis with Power BI and SharePoint
Integrating Power BI and SharePoint enables deeper collaboration in EHS analytics. Safety reports stored in SharePoint libraries can feed directly into Power BI dashboards, simplifying data collection and sharing. This integration allows real-time updates of dashboards and dashboards and reports to be embedded into safety portals for quick access. Managers can comment on insights, tag issues, and collaborate on corrective actions. Power BI helps automate version control and ensure every stakeholder is working with the latest data. This seamless workflow improves the quality and consistency of safety reporting, making Power BI an essential tool in cross-functional EHS analysis.
How to Leverage Power BI Differently for Business Intelligence in HSE
What sets Power BI different from legacy reporting systems is its ability to scale and adapt to complex EHS requirements. Bi experts and data-savvy EHS professionals can create custom analytics experiences that go beyond compliance tracking—integrating predictive analytics, benchmarking tools, and even live IoT sensor data. Power BI also enables drill-through capabilities and natural language queries that make insights more intuitive. As a BI platform, it is highly flexible—supporting complex data models for corporate EHS strategy or simple visual summaries for site-level dashboards. Organizations that transform their EHS approach using Power BI are better equipped to manage risk, improve compliance, and foster a culture of safety excellence.
For ready-to-use Dashboard Templates: