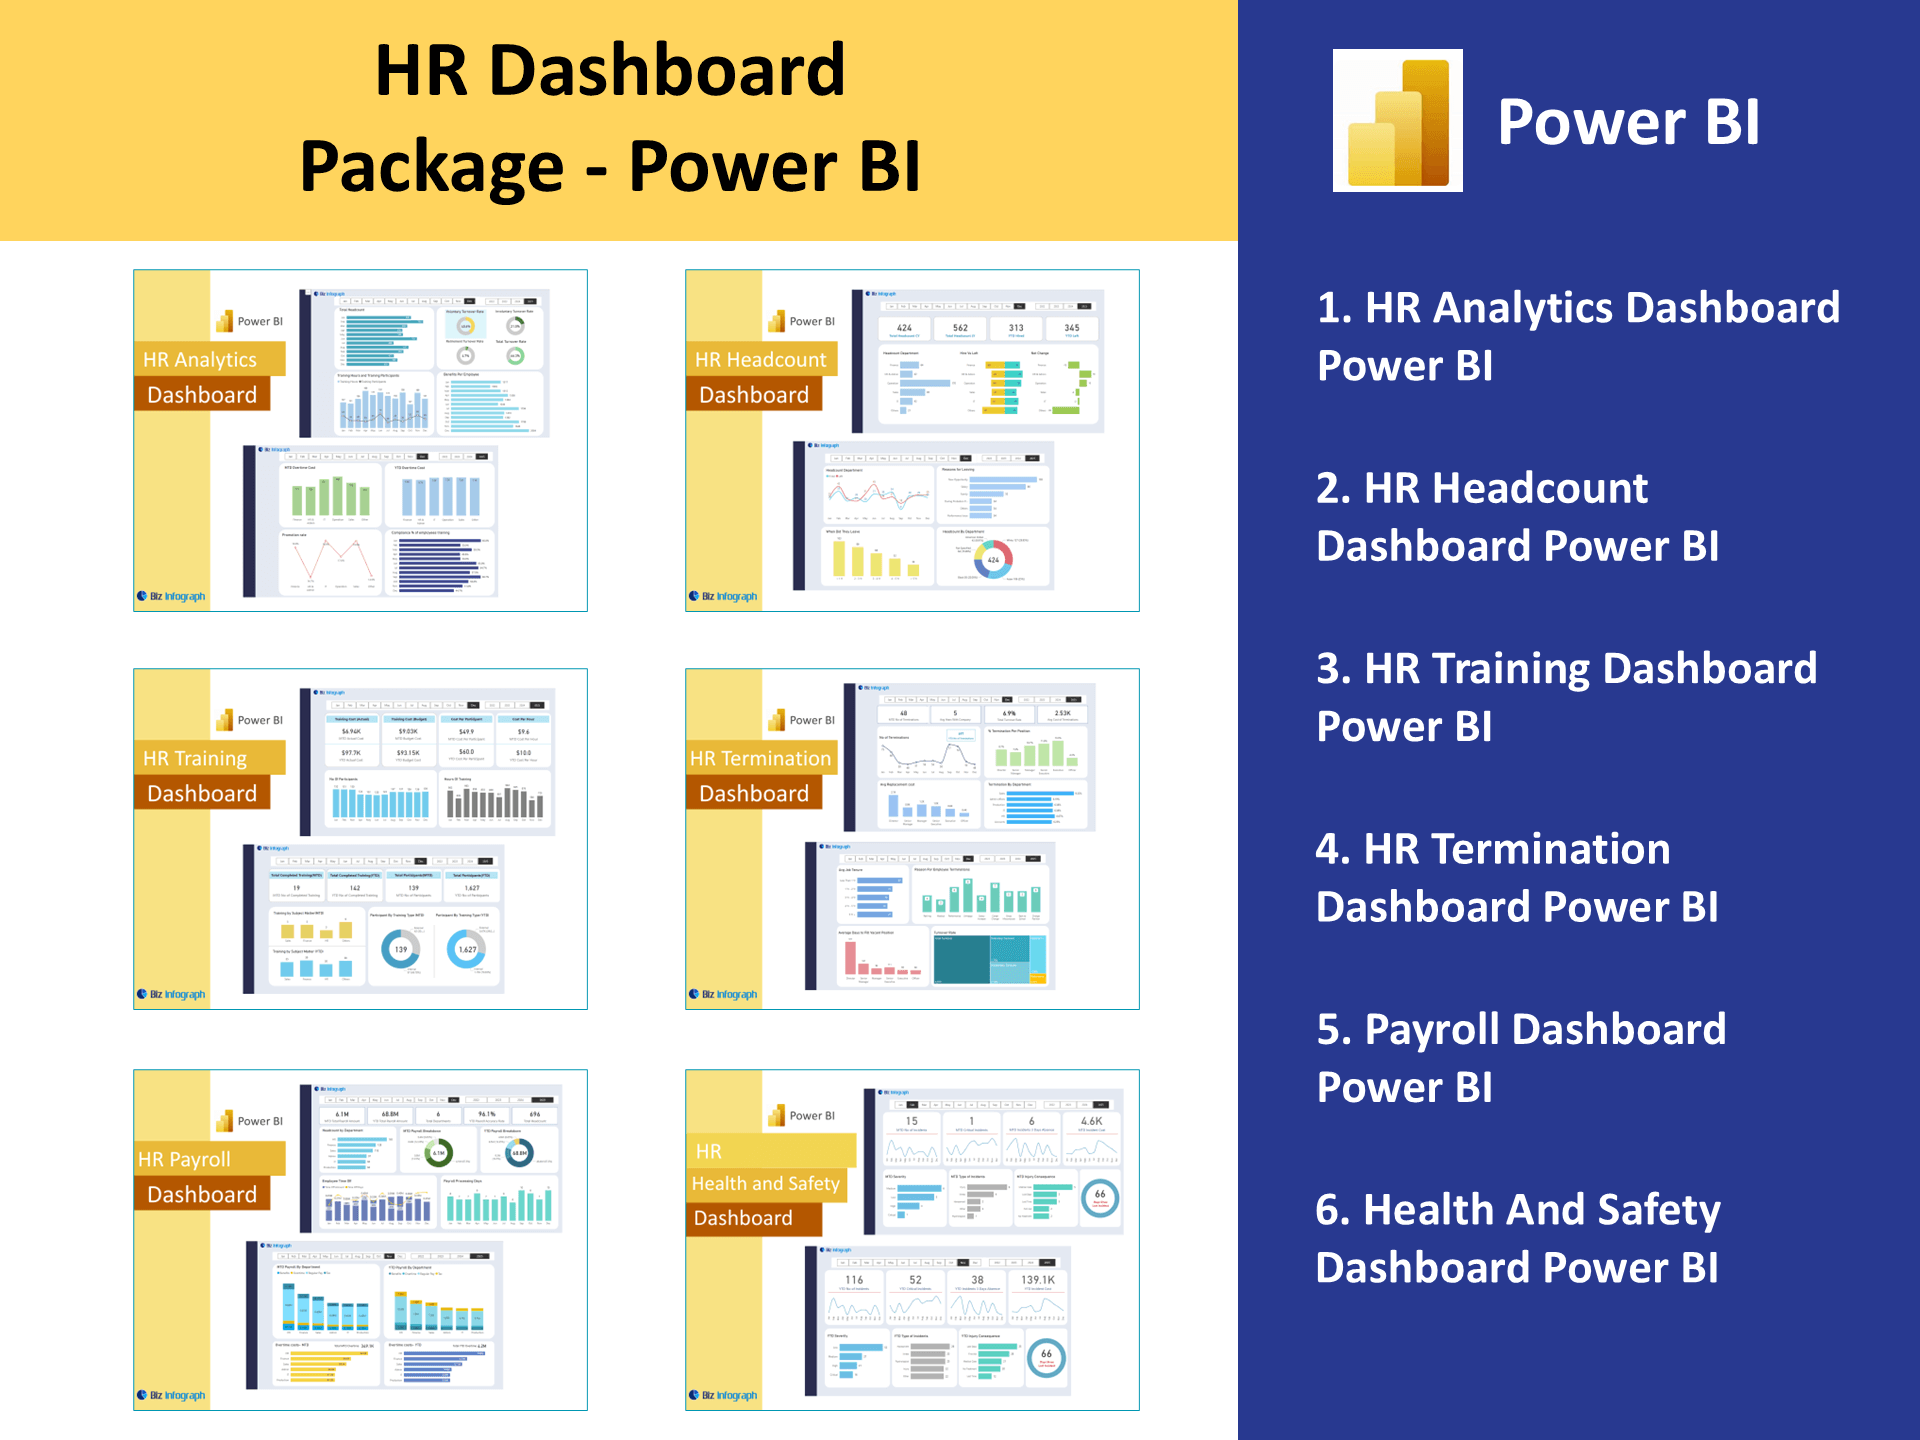
HR Headcount Power BI Dashboard
Introduction to HR Headcount Dashboards
What is an HR Headcount Dashboard?
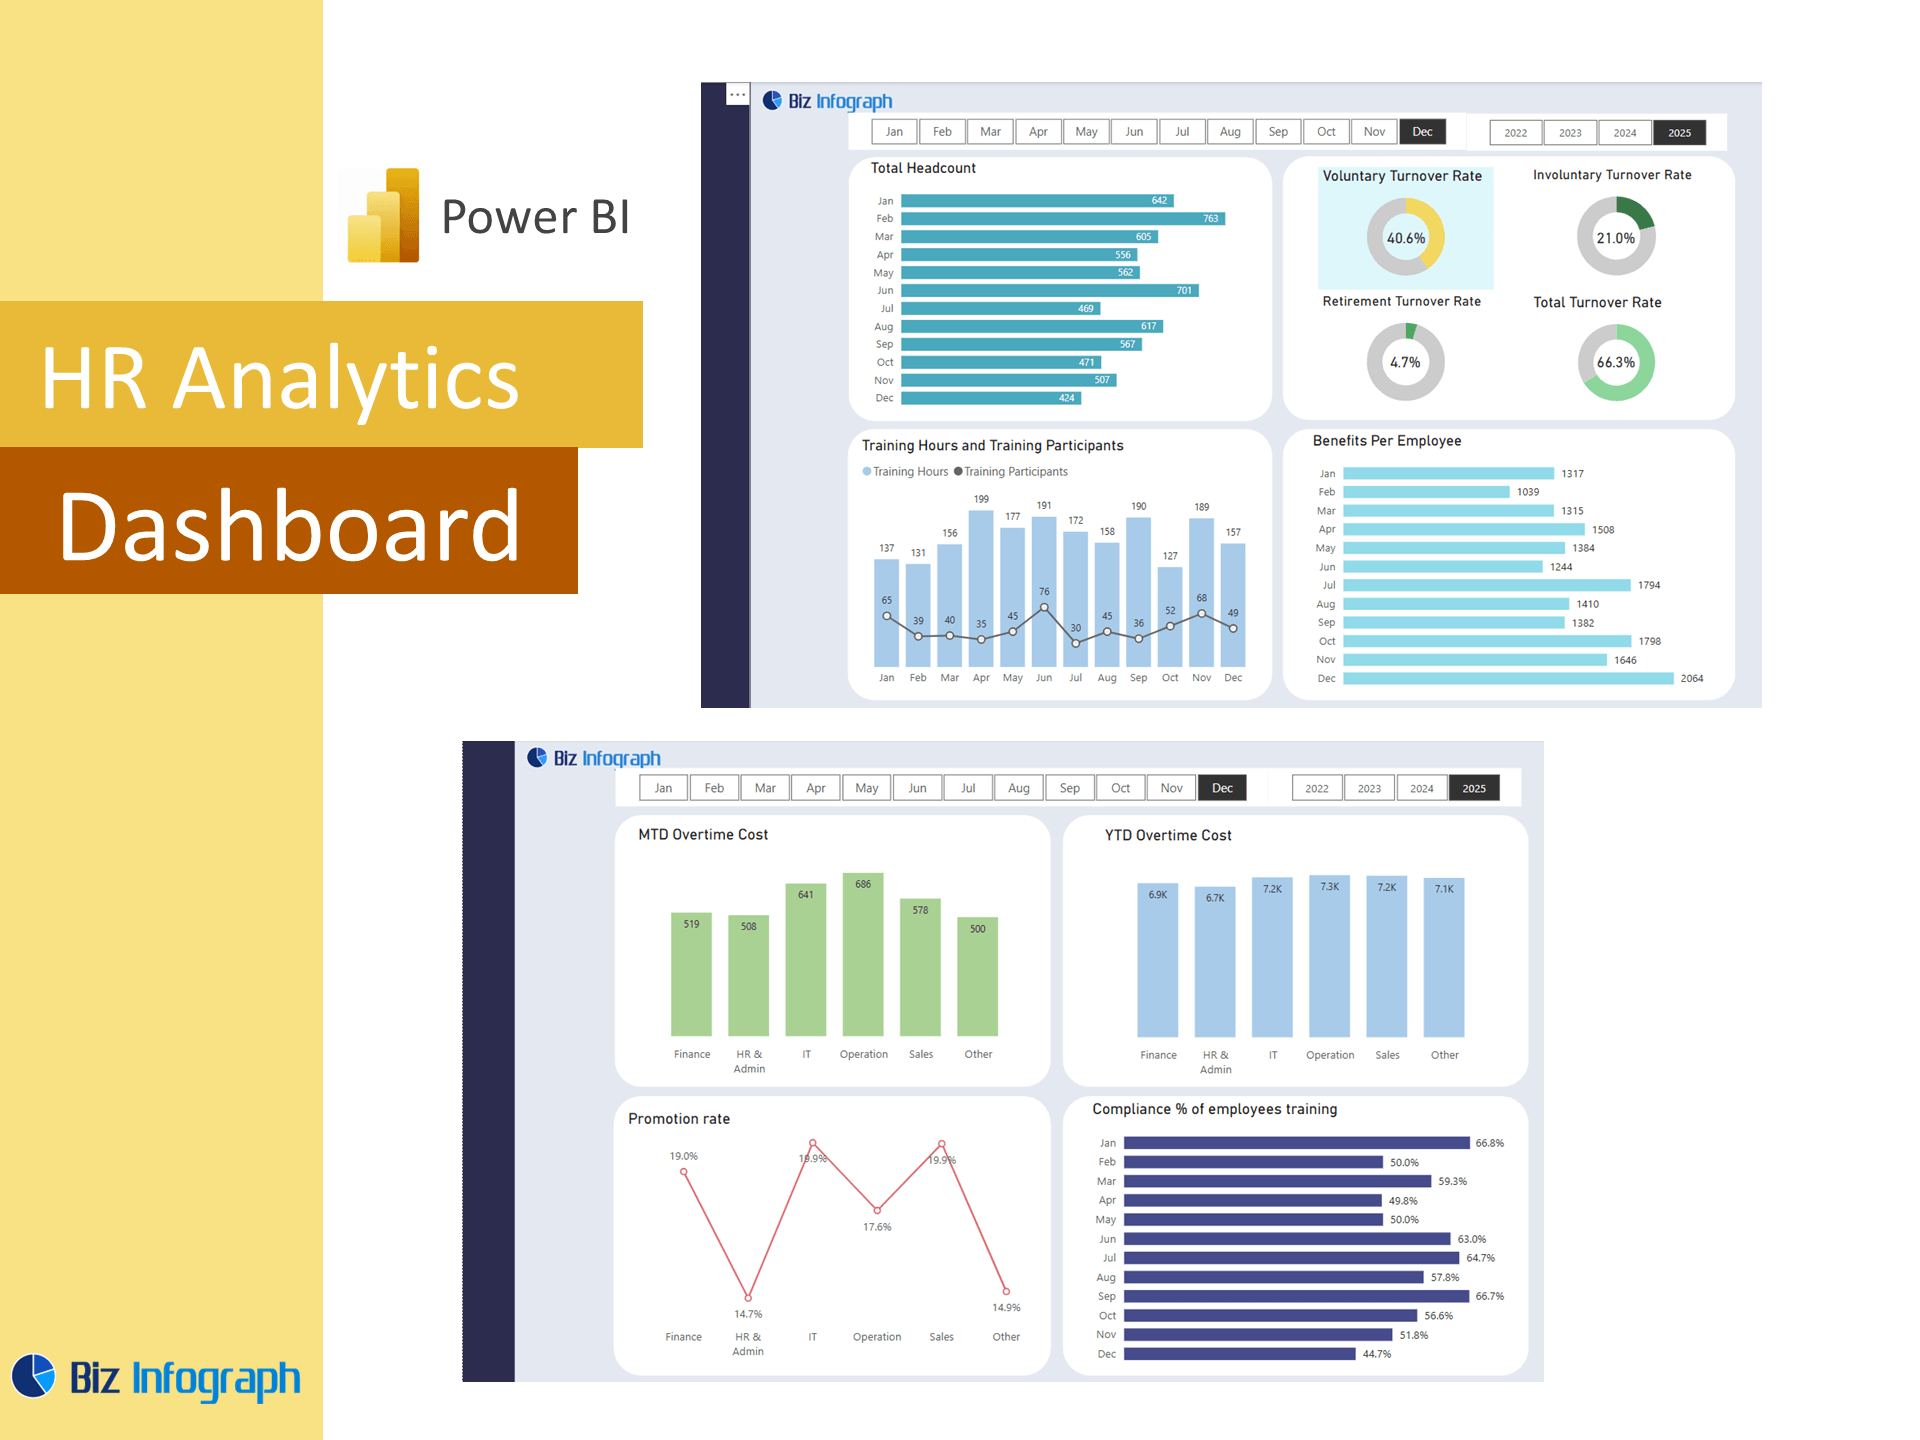
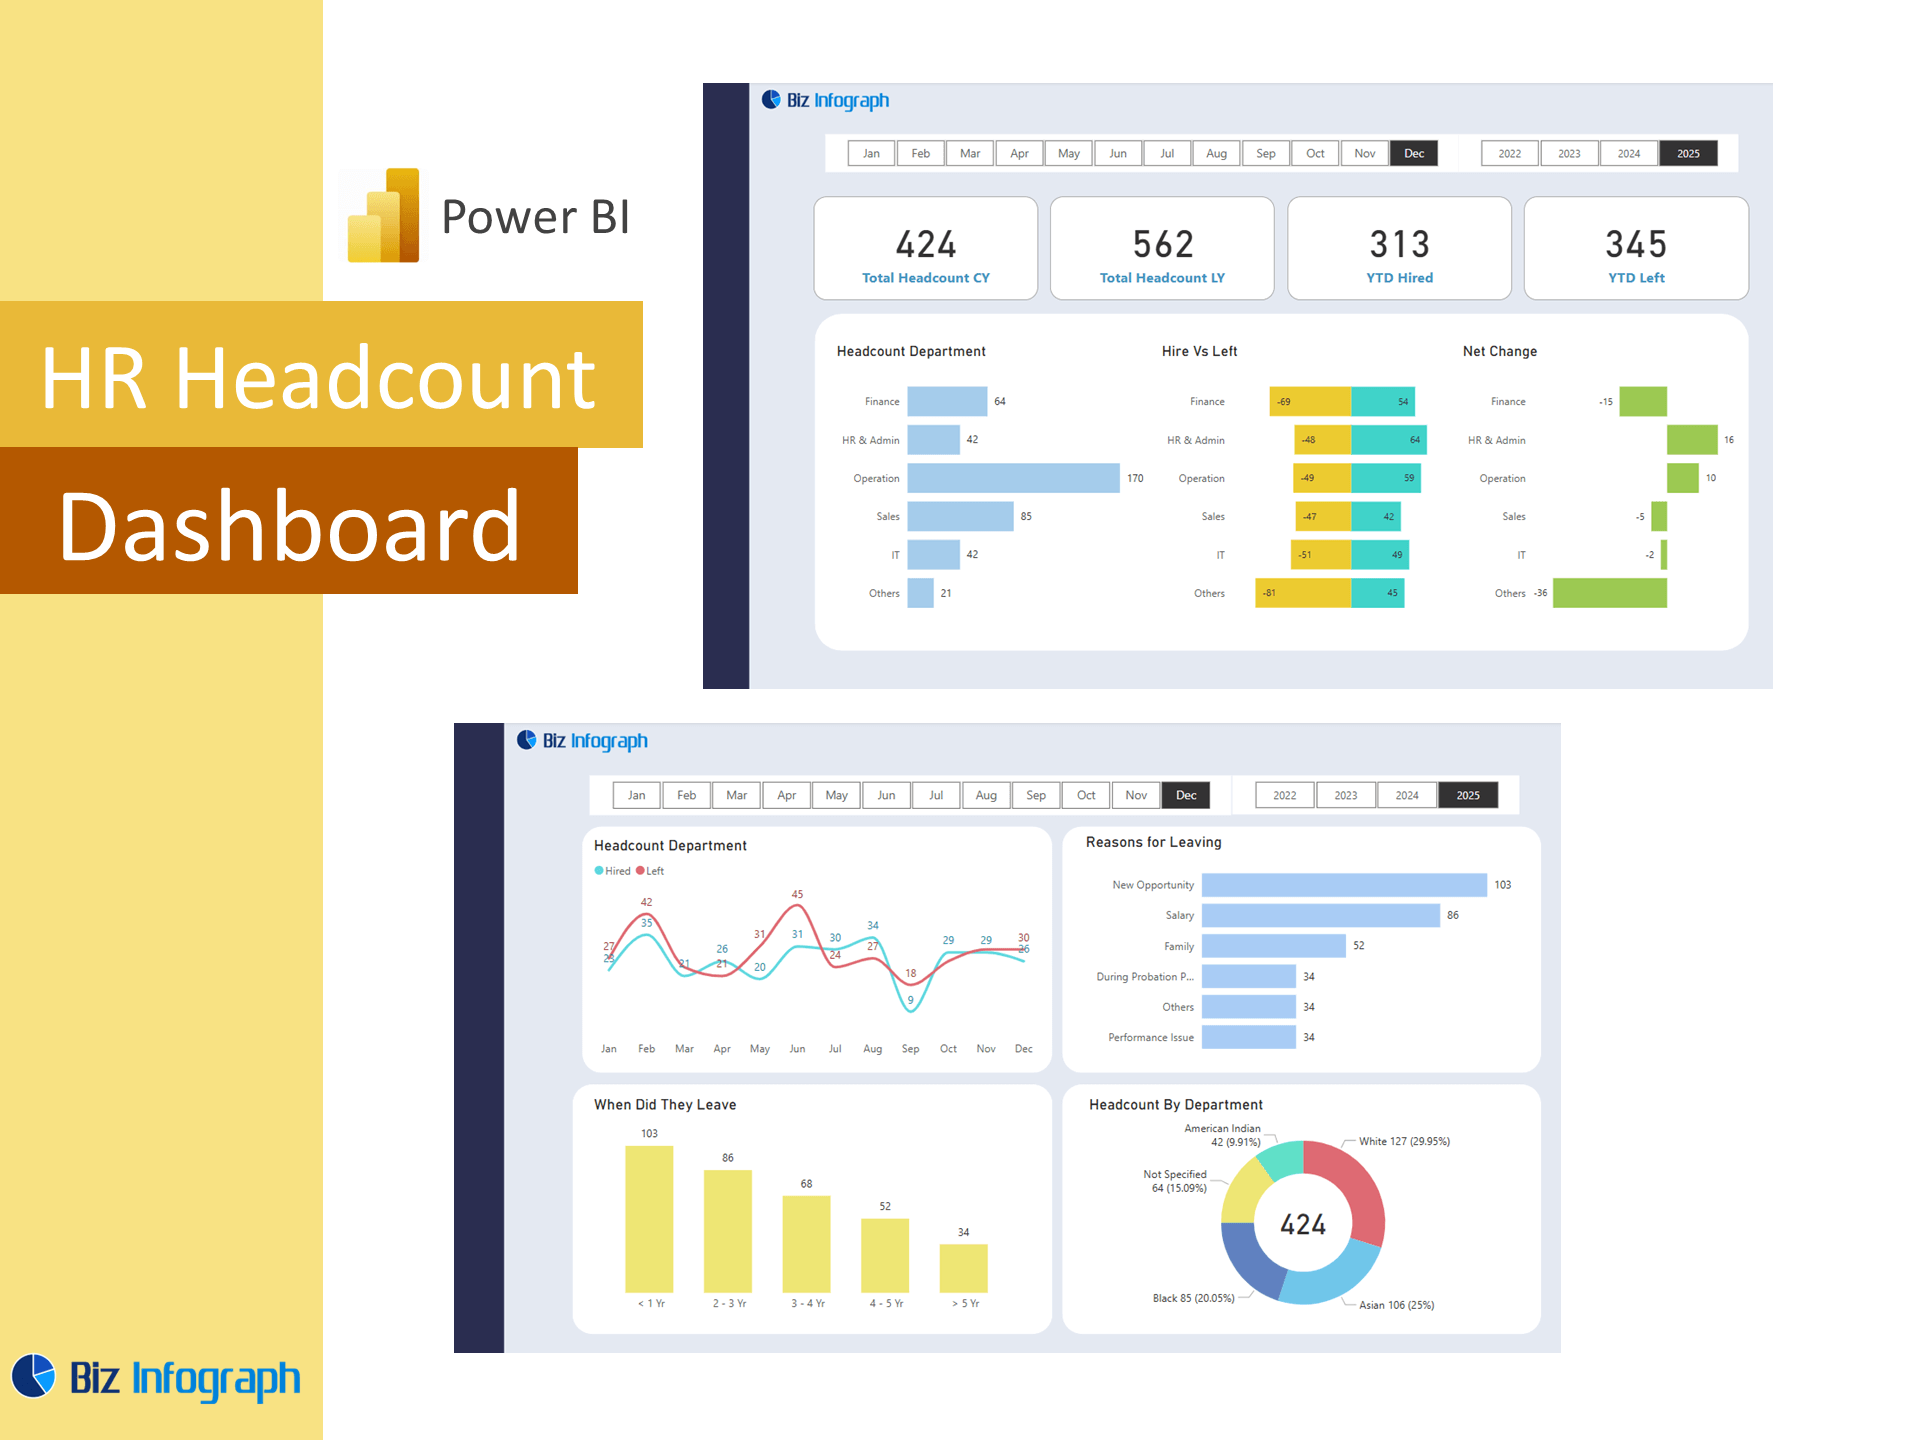
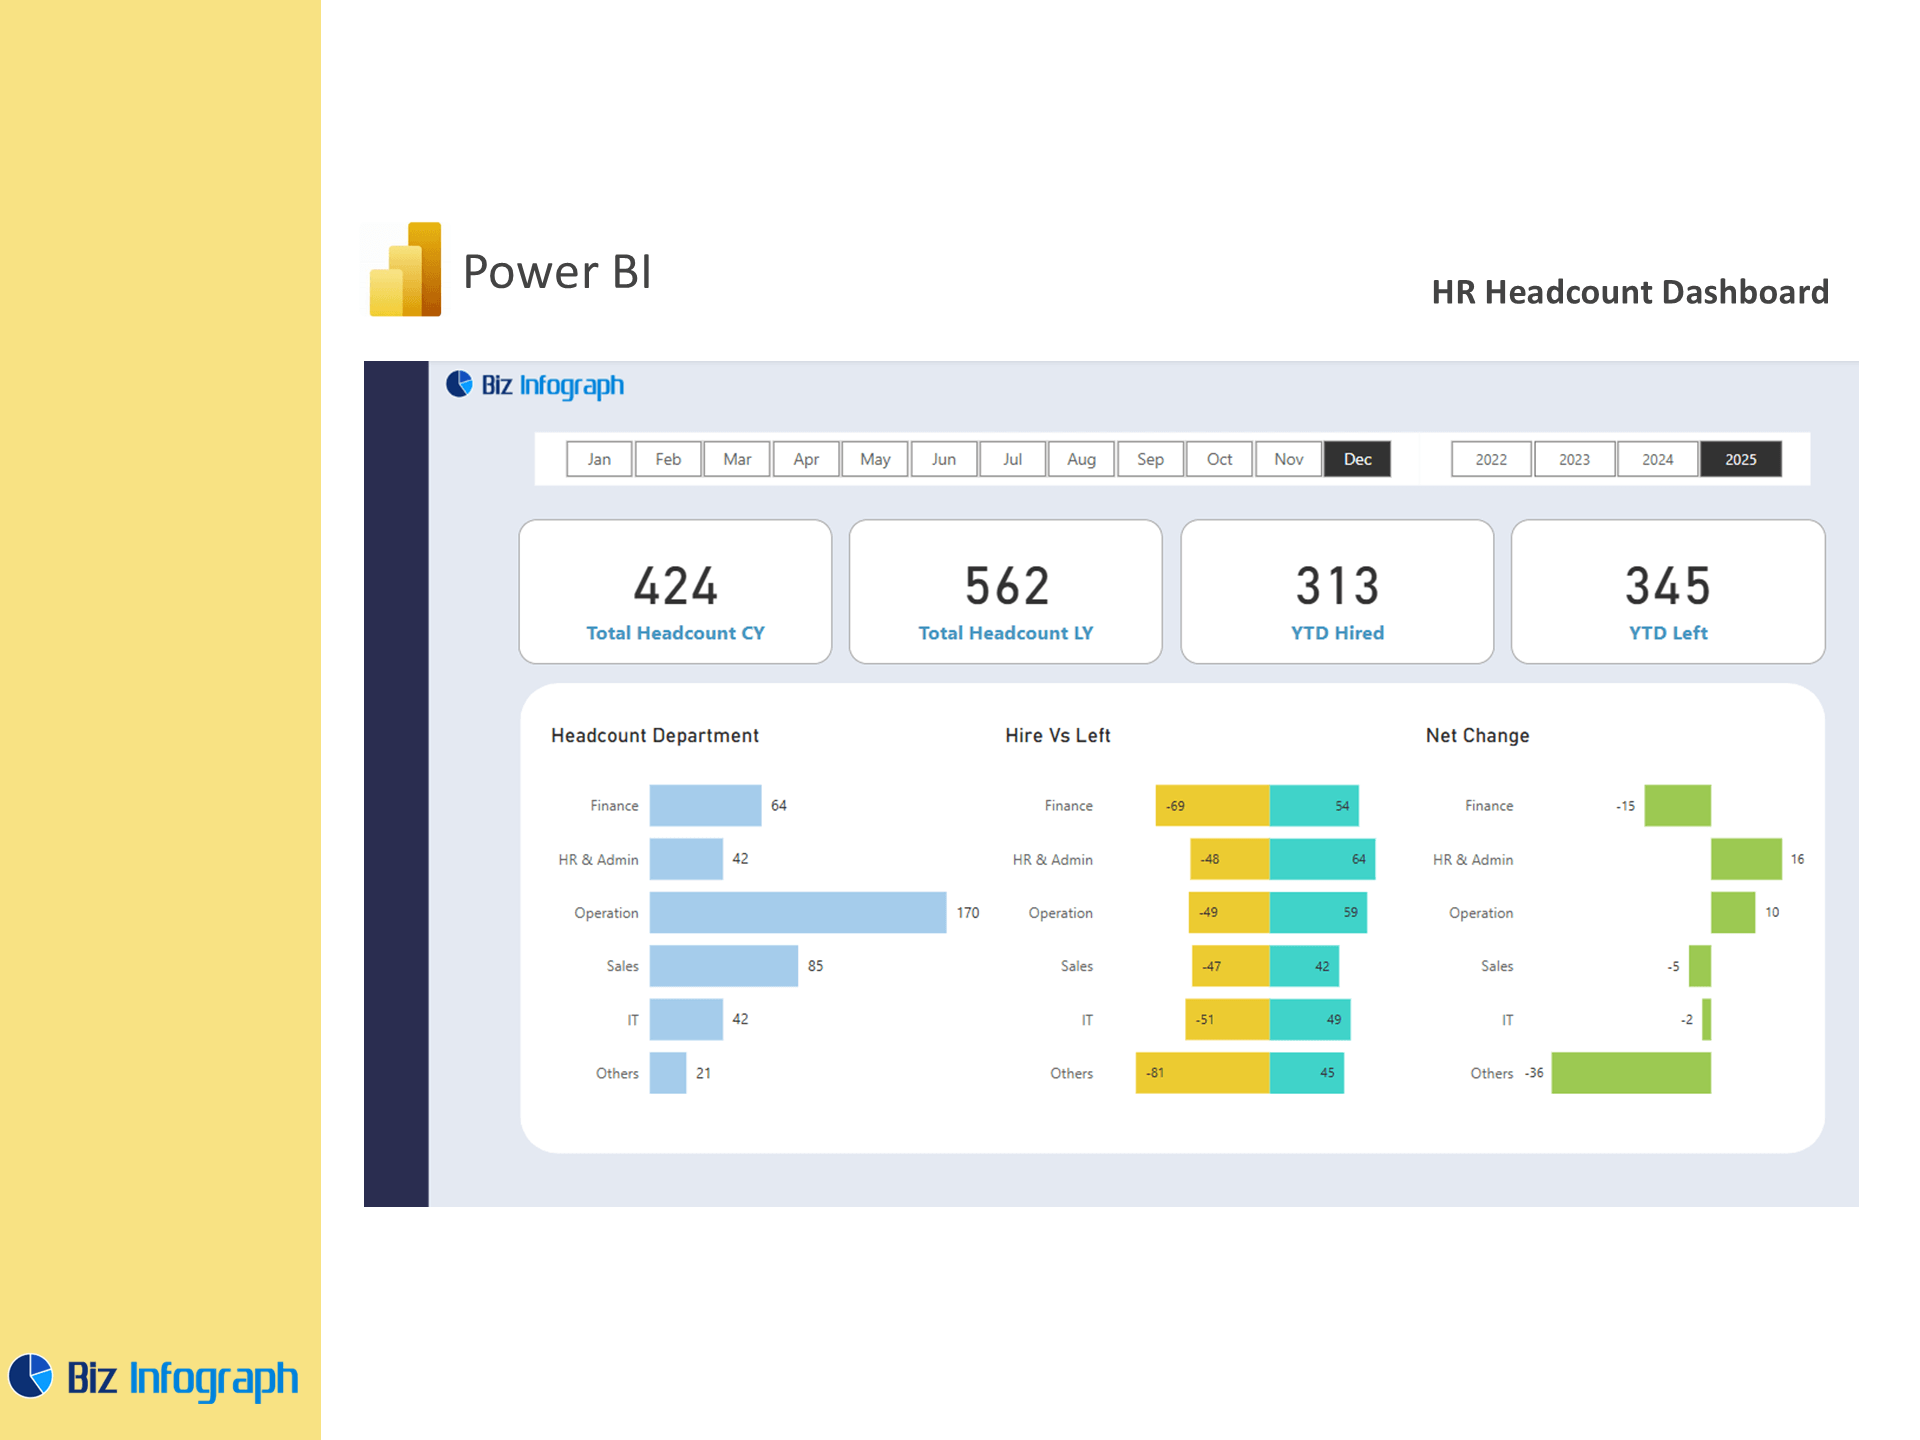
An HR Headcount Dashboard template is a specialized human resources dashboard built using Power BI to monitor the total number of employees, new hires, exits, and internal movements across an organization. It acts as a centralized tool for the HR team to track workforce size and trends in real time. By pulling from multiple data sources, the dashboard offers complete visibility into headcount distribution, segmentation by departments, and job satisfaction patterns. Built as part of a larger HR analytics dashboard, it helps the human resources department improve strategic decisions and planning. The dashboard with Power BI supports both high-level summaries and detailed drill-downs, ensuring effective workforce monitoring.
Why HR Leaders Rely on Power BI for Workforce Insights
HR leaders need access to fast, reliable insights to shape effective HR strategies. With a Power BI HR dashboard, they can explore workforce dynamics in real time, such as changes in headcount, separation data, employee data, employee performance, or employee growth by business unit. Unlike static reports, Power BI dashboards offer interactivity, allowing leaders to filter by region, department, or role and immediately see how the HR employee count shifts. Through features like predictive analytics and built-in AI, advanced analytics tools identify potential risks—such as departments at risk for high attrition. These capabilities transform raw data into actionable insights, enhancing data-driven HR management.
Benefits of Using a Power BI HR Dashboard for Headcount Analytics
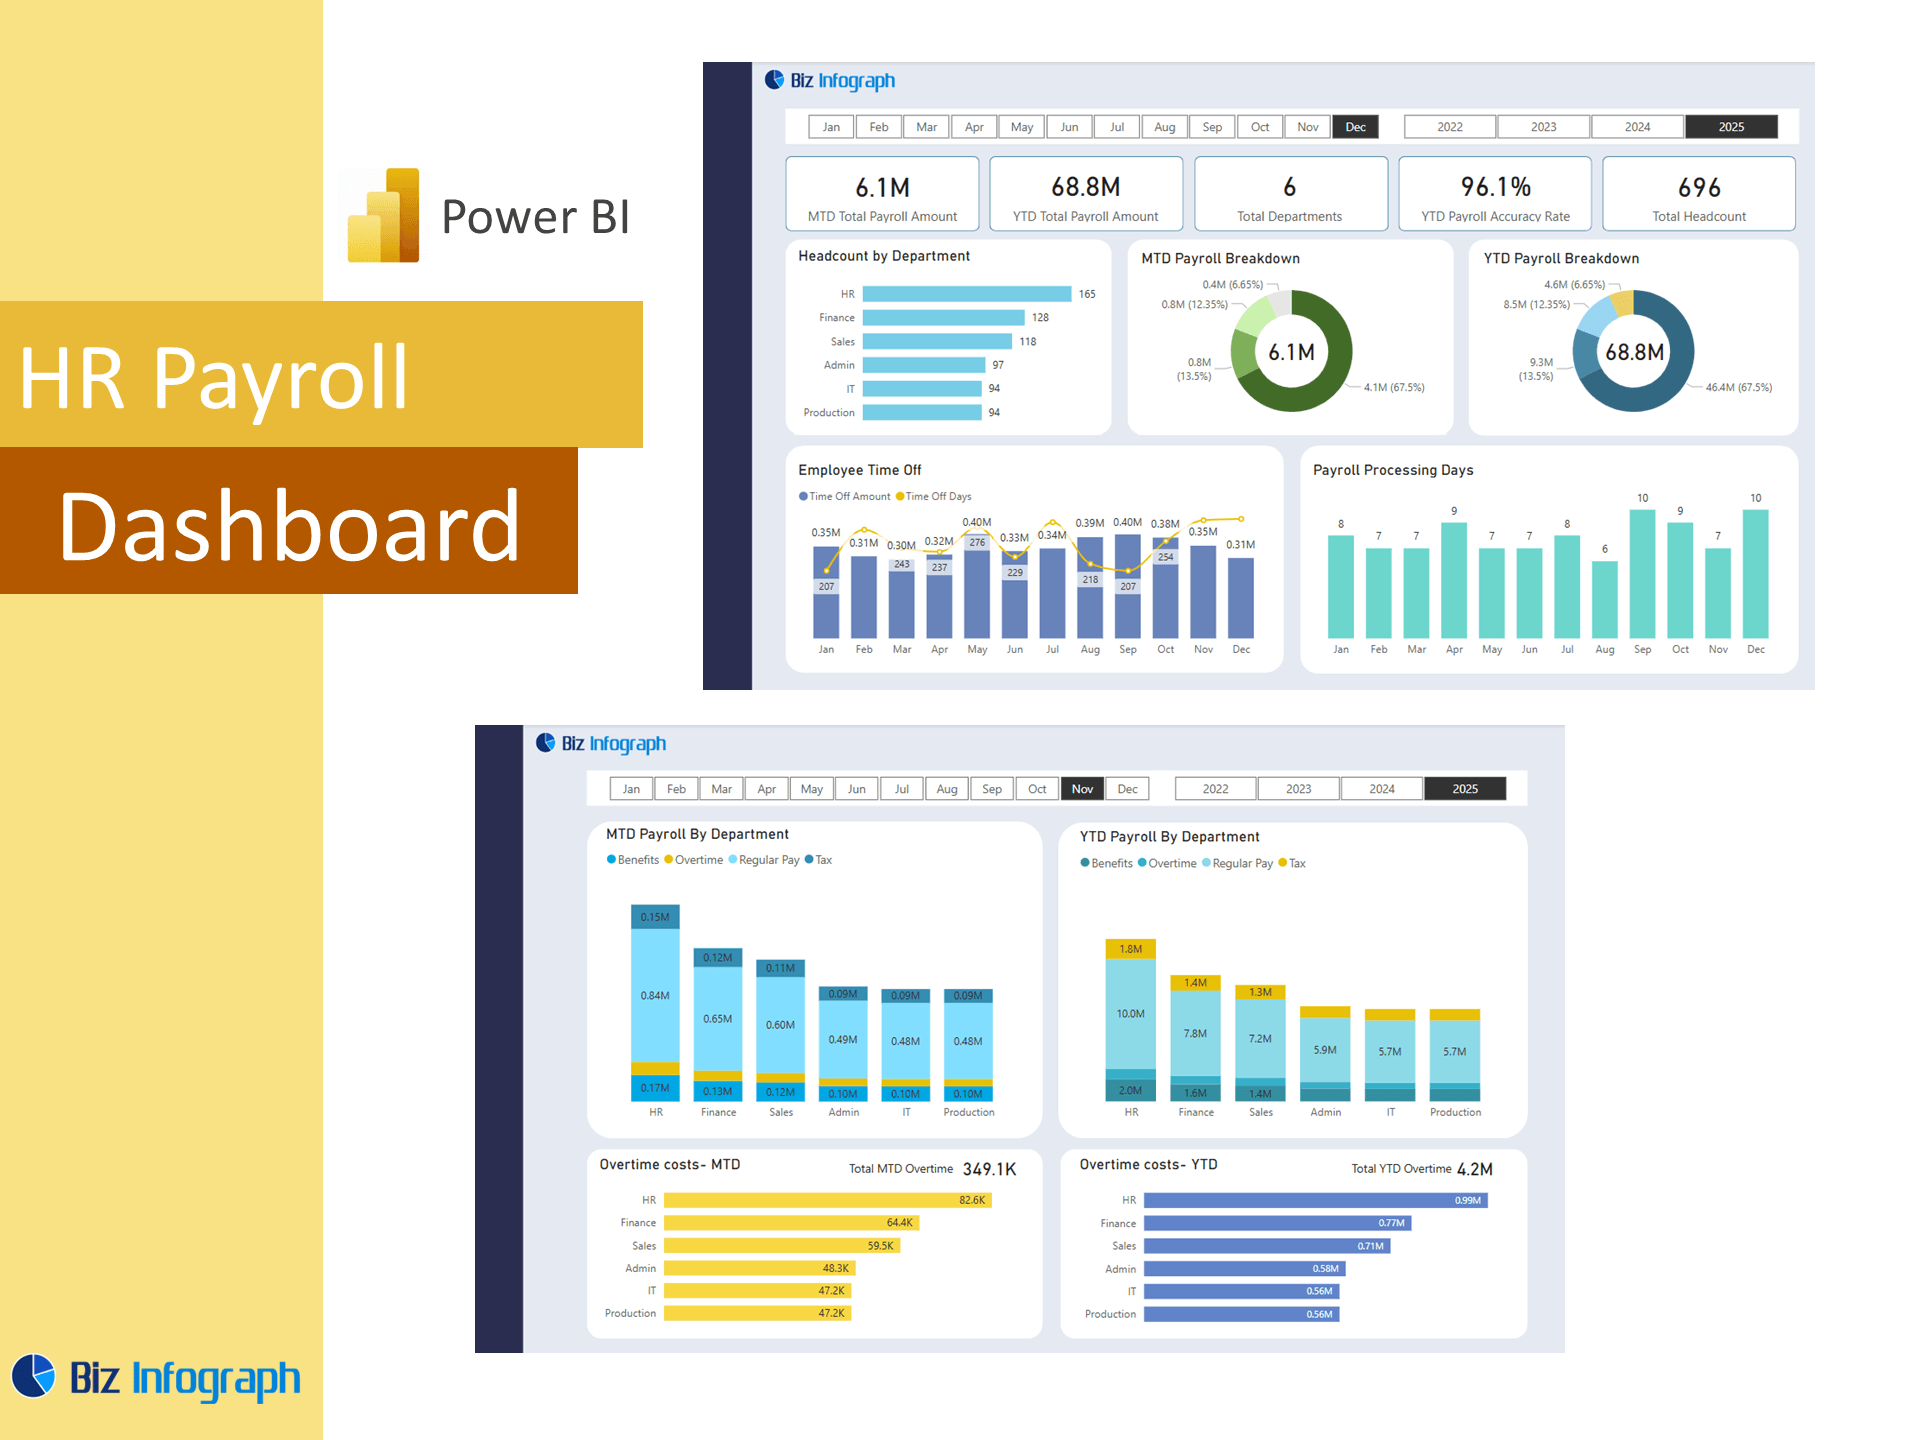
Implementing a Power BI HR dashboard brings agility and depth to workforce reporting. It connects to multiple data sources via Power Query, enabling users to clean, reshape, and model raw data for accurate, real-time HR data analysis. HR professionals can track not only headcount but also related metrics like employee engagement, employee turnover, tenure, and satisfaction levels. These insights inform better HR processes, including workforce planning and HR budget allocation. The ability to publish reports via Power BI Service means that stakeholders across departments can access key reports anytime, ensuring that HR managers and executives are aligned on talent trends and priorities.
Building an Effective Headcount Dashboard in Power BI
Essential Metrics and KPIs to Track Headcount and Turnover
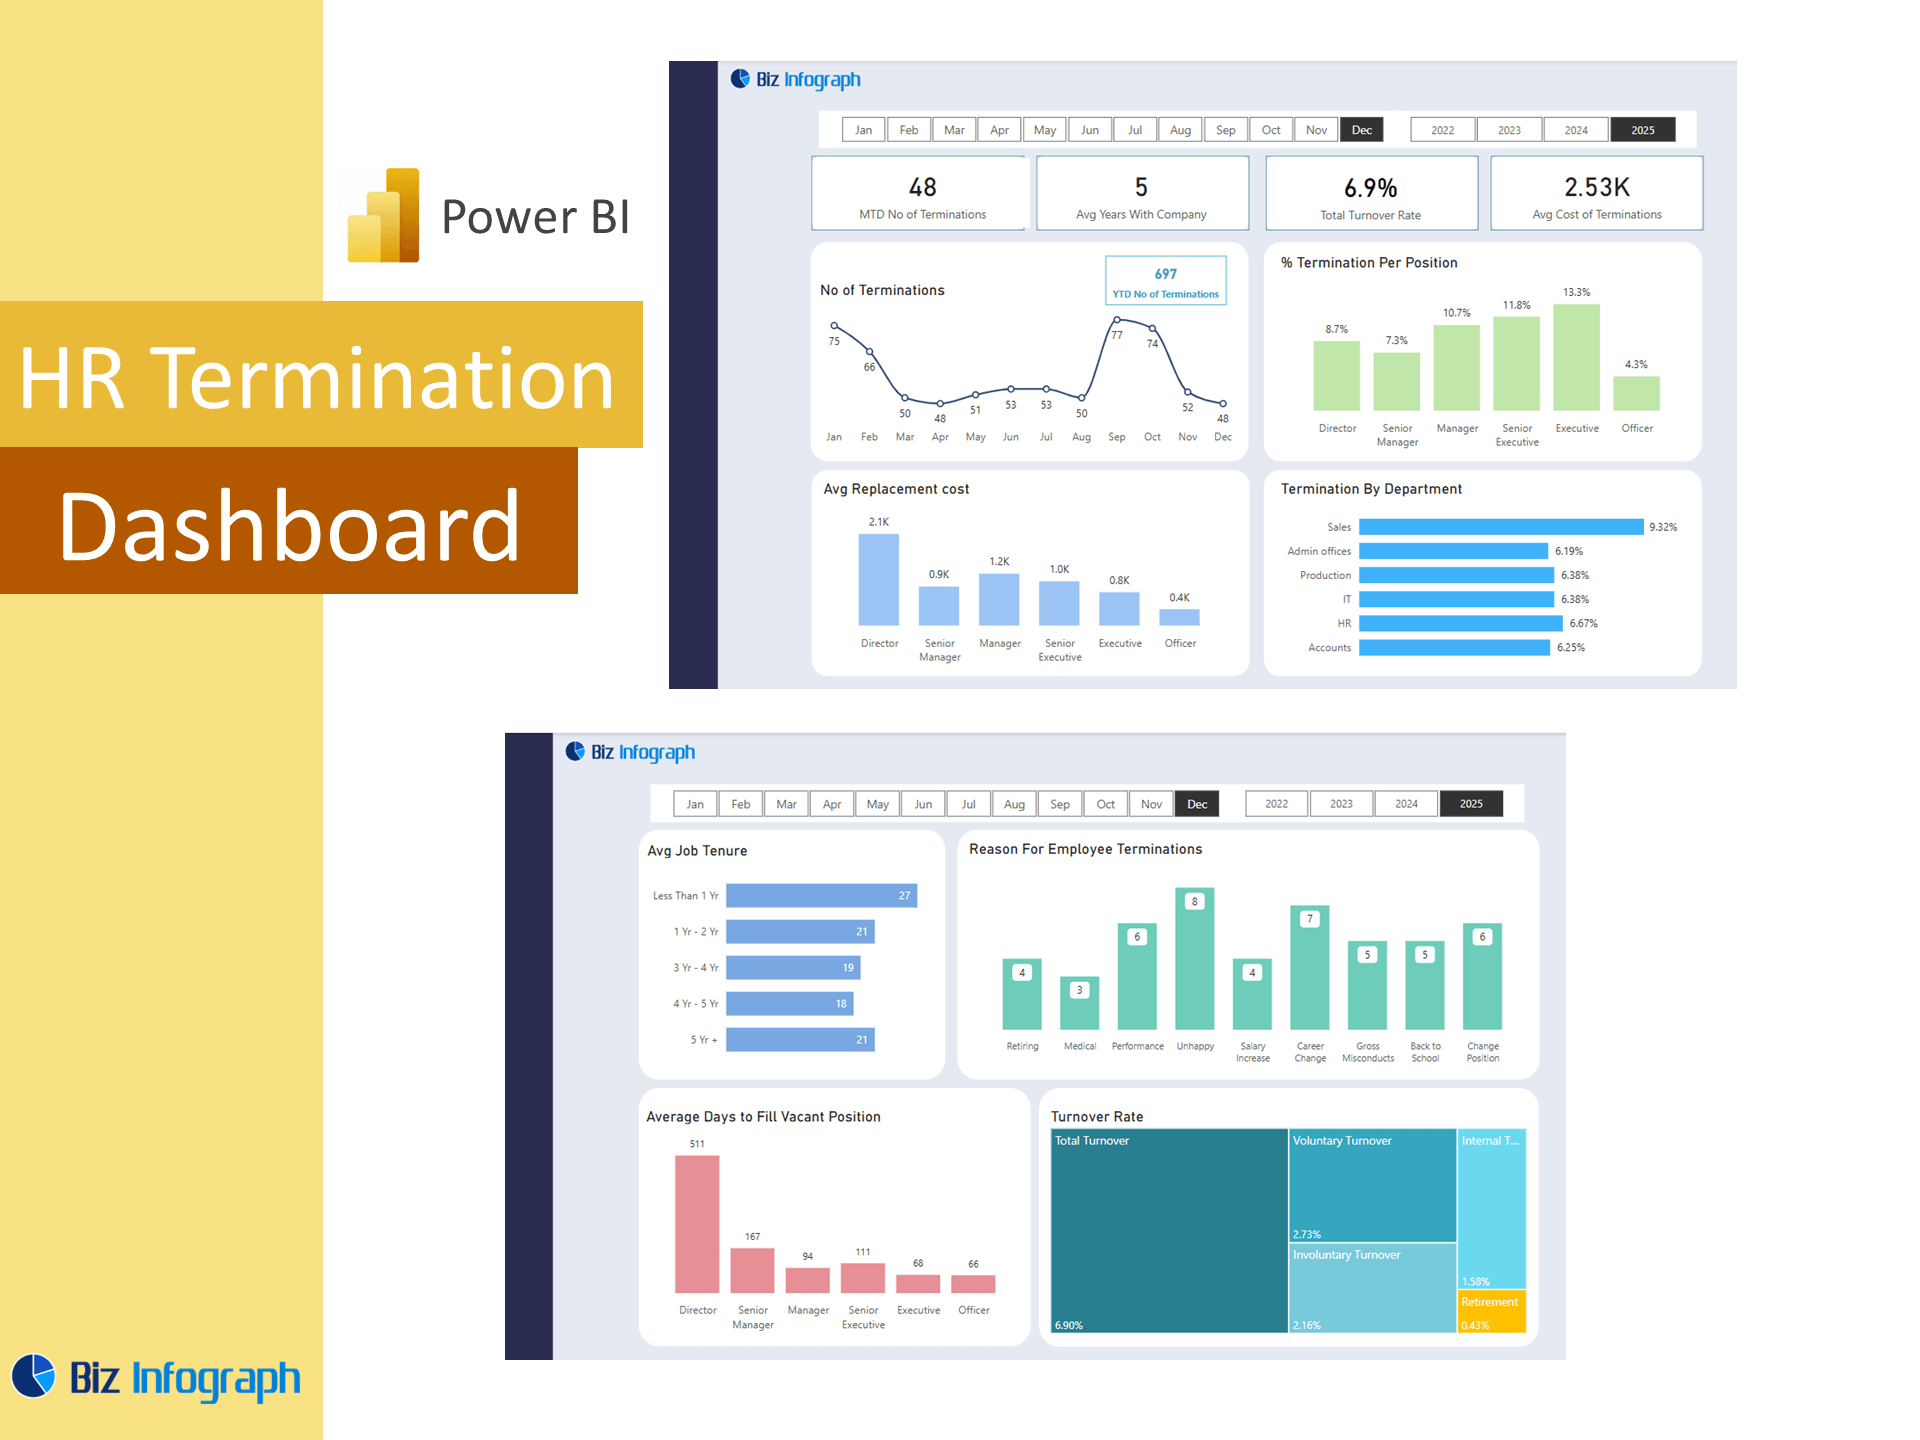
A successful dashboard in Power BI for headcount must focus on the right performance indicators. These include total number of employees, monthly headcount trends, turnover rates, internal promotions, and department-level staffing changes. Incorporating data on separation data helps track involuntary vs. voluntary exits. The HR analytics dashboard also benefits from integrating job satisfaction and employee satisfaction scores and employee engagement metrics, enabling HR teams to correlate turnover with morale. These KPIs offer a comprehensive view of workforce stability and help HR managers measure how organizational change impacts staff retention. Over time, such a dashboard becomes a valuable tool for predicting future workforce needs.
Using Data Analysis and Visualization to Drive Actionable Insights
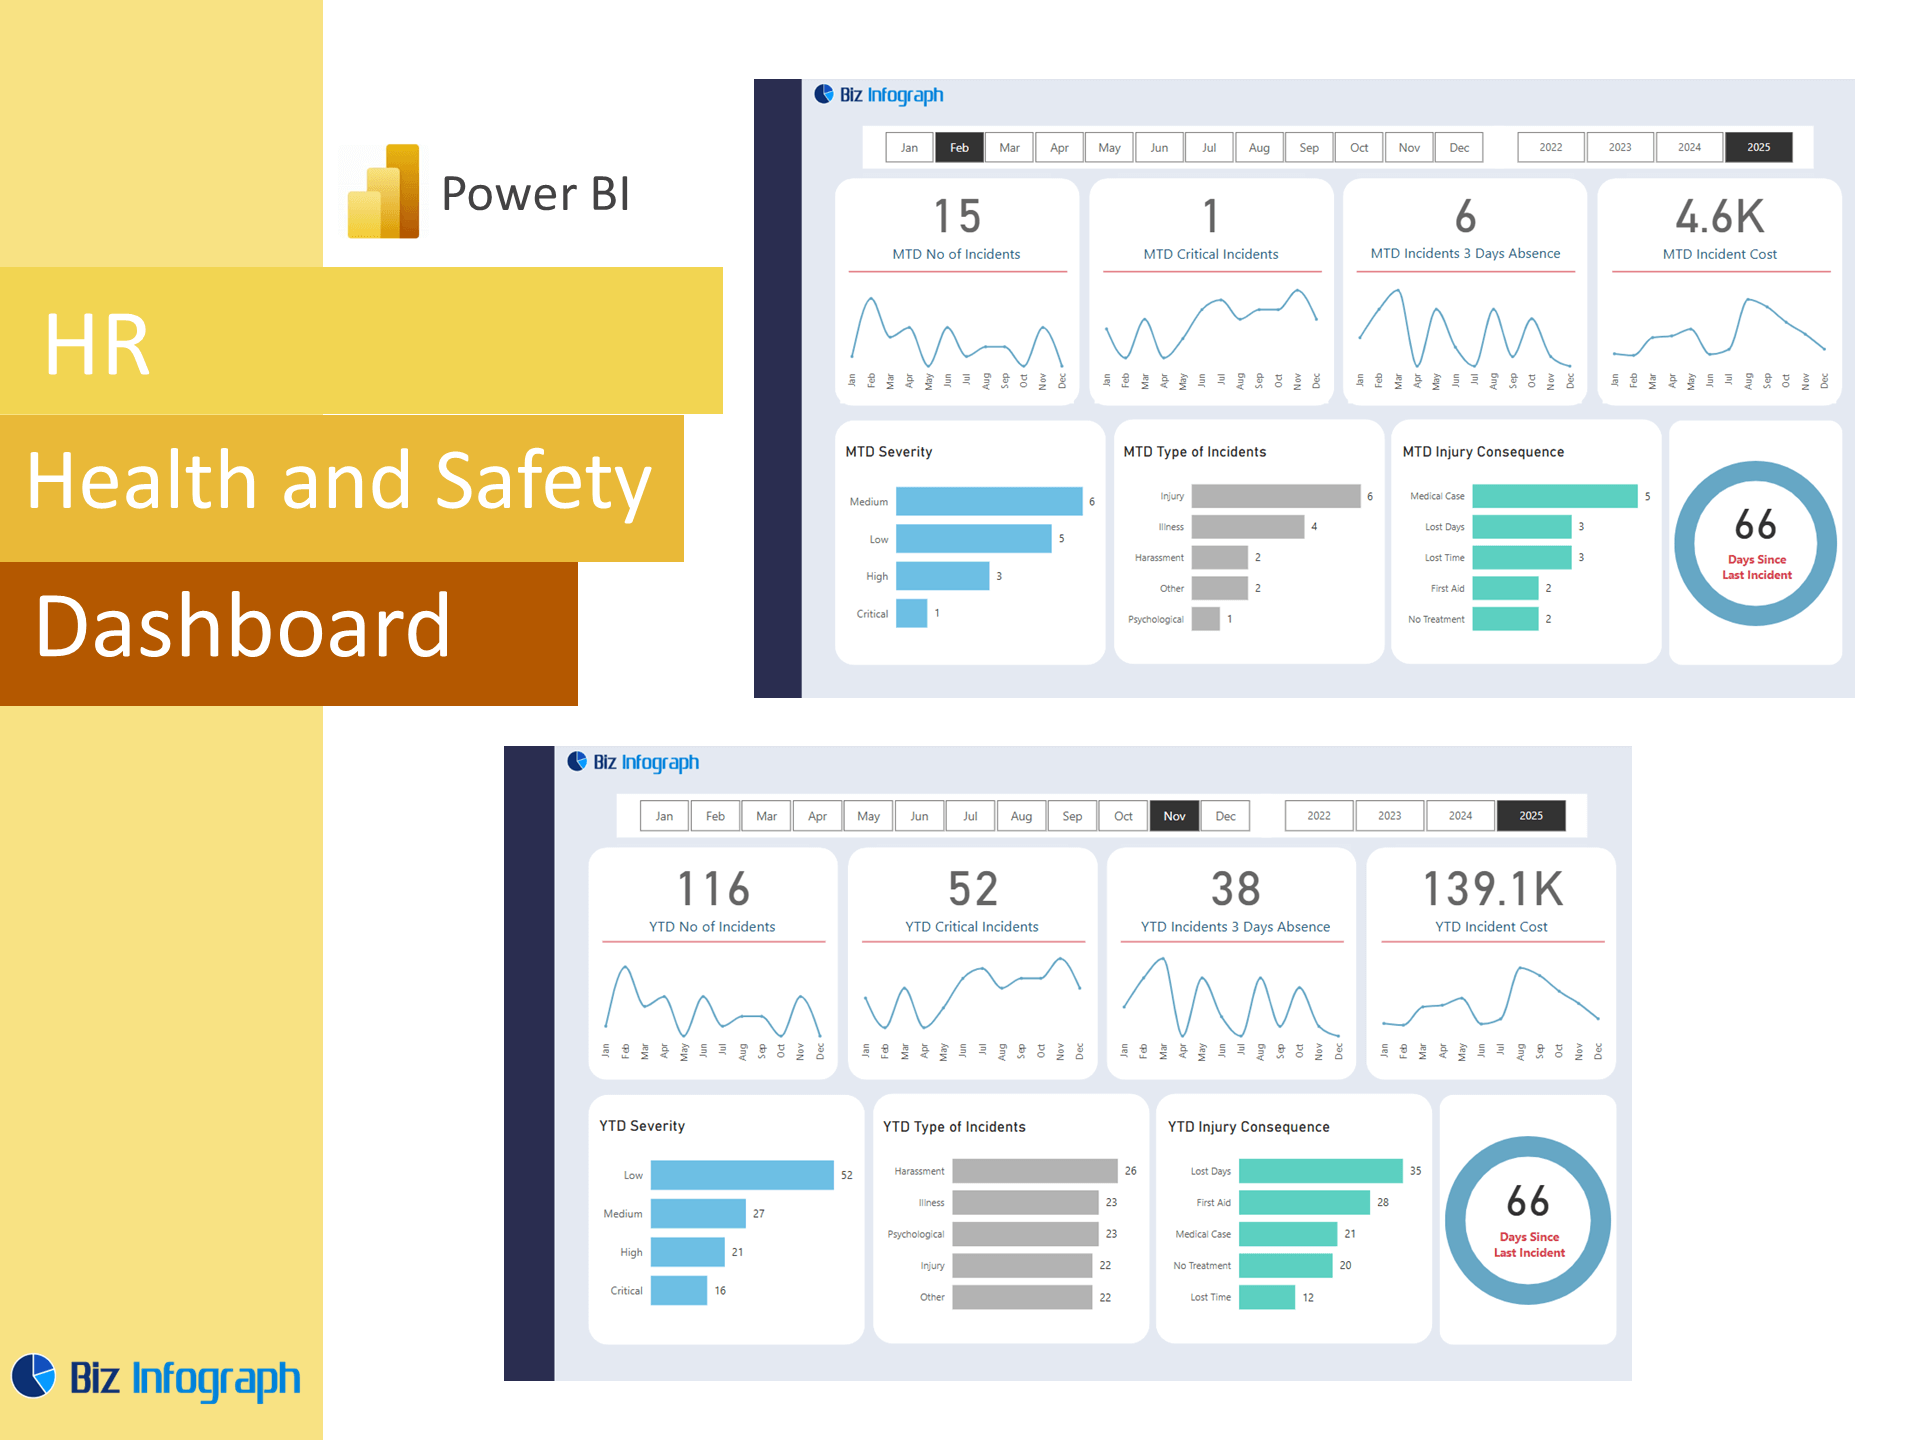
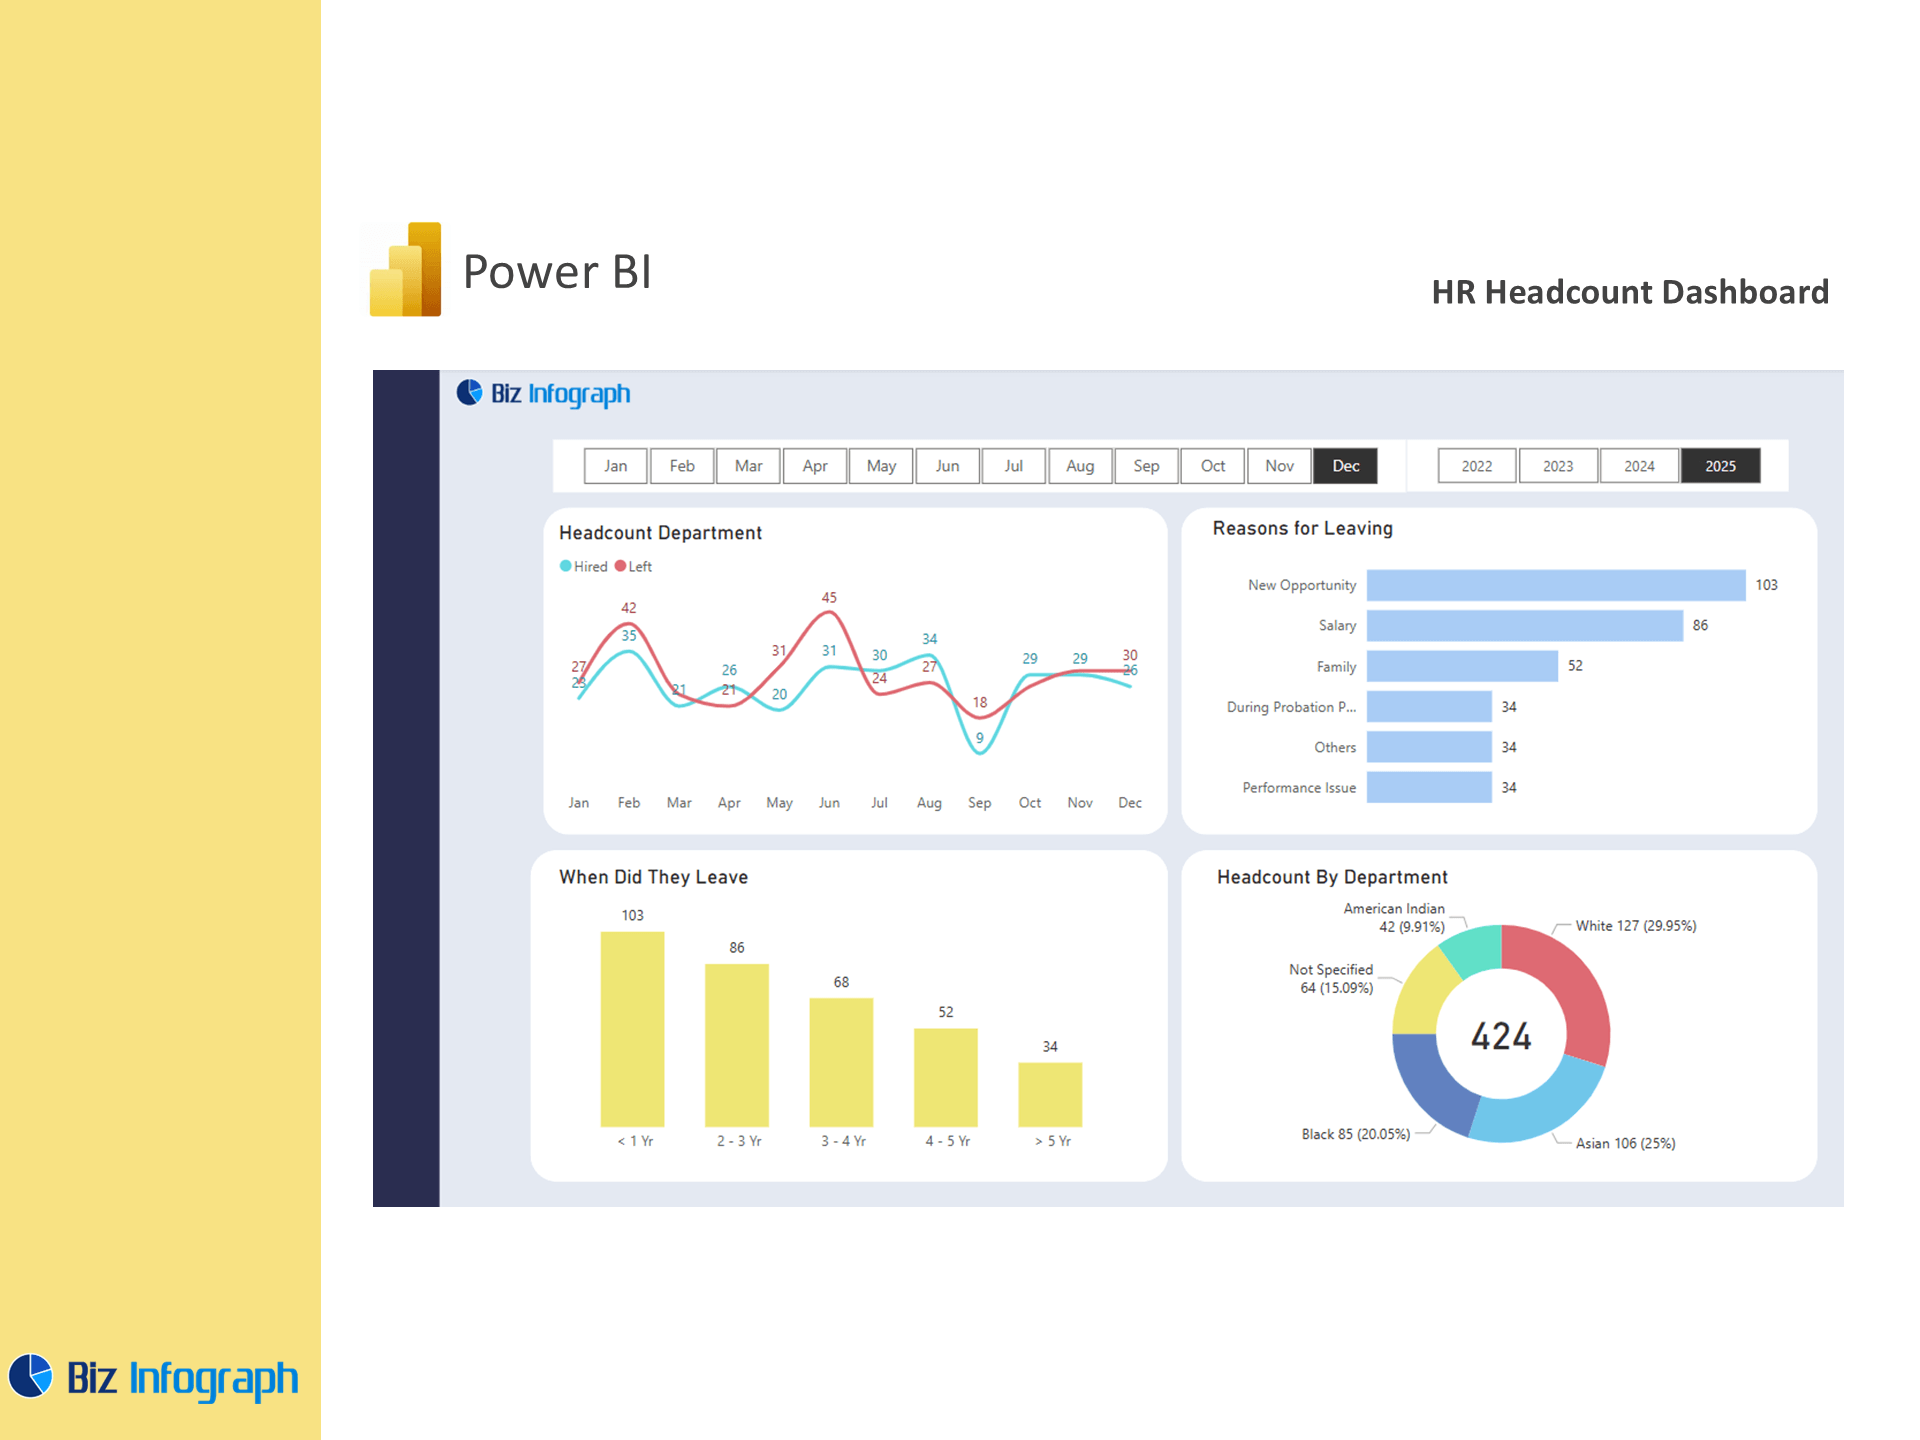
Data visualization is critical in helping HR departments interpret large datasets efficiently. With dashboard using Power BI, visuals like heatmaps, bar charts, and line graphs bring clarity to trends in hiring, exits, and overall headcount. Power BI for HR enables organizations to dig deeper into workforce changes by department, tenure range, or region. This data analysis helps HR managers and executives identify areas for improvement, such as departments with low tenure or declining satisfaction levels. When integrated with Power BI Desktop, these visuals are both rich in functionality and easy to use, supporting better communication and actionable insights.
Designing an HR Power BI Dashboard with Microsoft Power BI Tools
Effective dashboard design starts with defining business goals and aligning visuals to support HR strategies. In a Power BI HR dashboard, layout and navigation must prioritize clarity—separating key KPIs, trend graphs, and employee demographics. Using Power Query, data can be reshaped and enriched for optimal visual presentation. Power BI Desktop allows HR analysts to implement drill-downs, dynamic filters, and DAX formulas, enhancing interactivity. Reports can then be published via Power BI Service, enabling real-time collaboration across departments. This end-to-end solution from Microsoft Power BI allows HR teams to scale their reporting, adapt to new requirements, and maintain effective HR practices with ease.
Power BI Solutions for Strategic HR Management
Leveraging Power BI Reports for HR Management and Planning
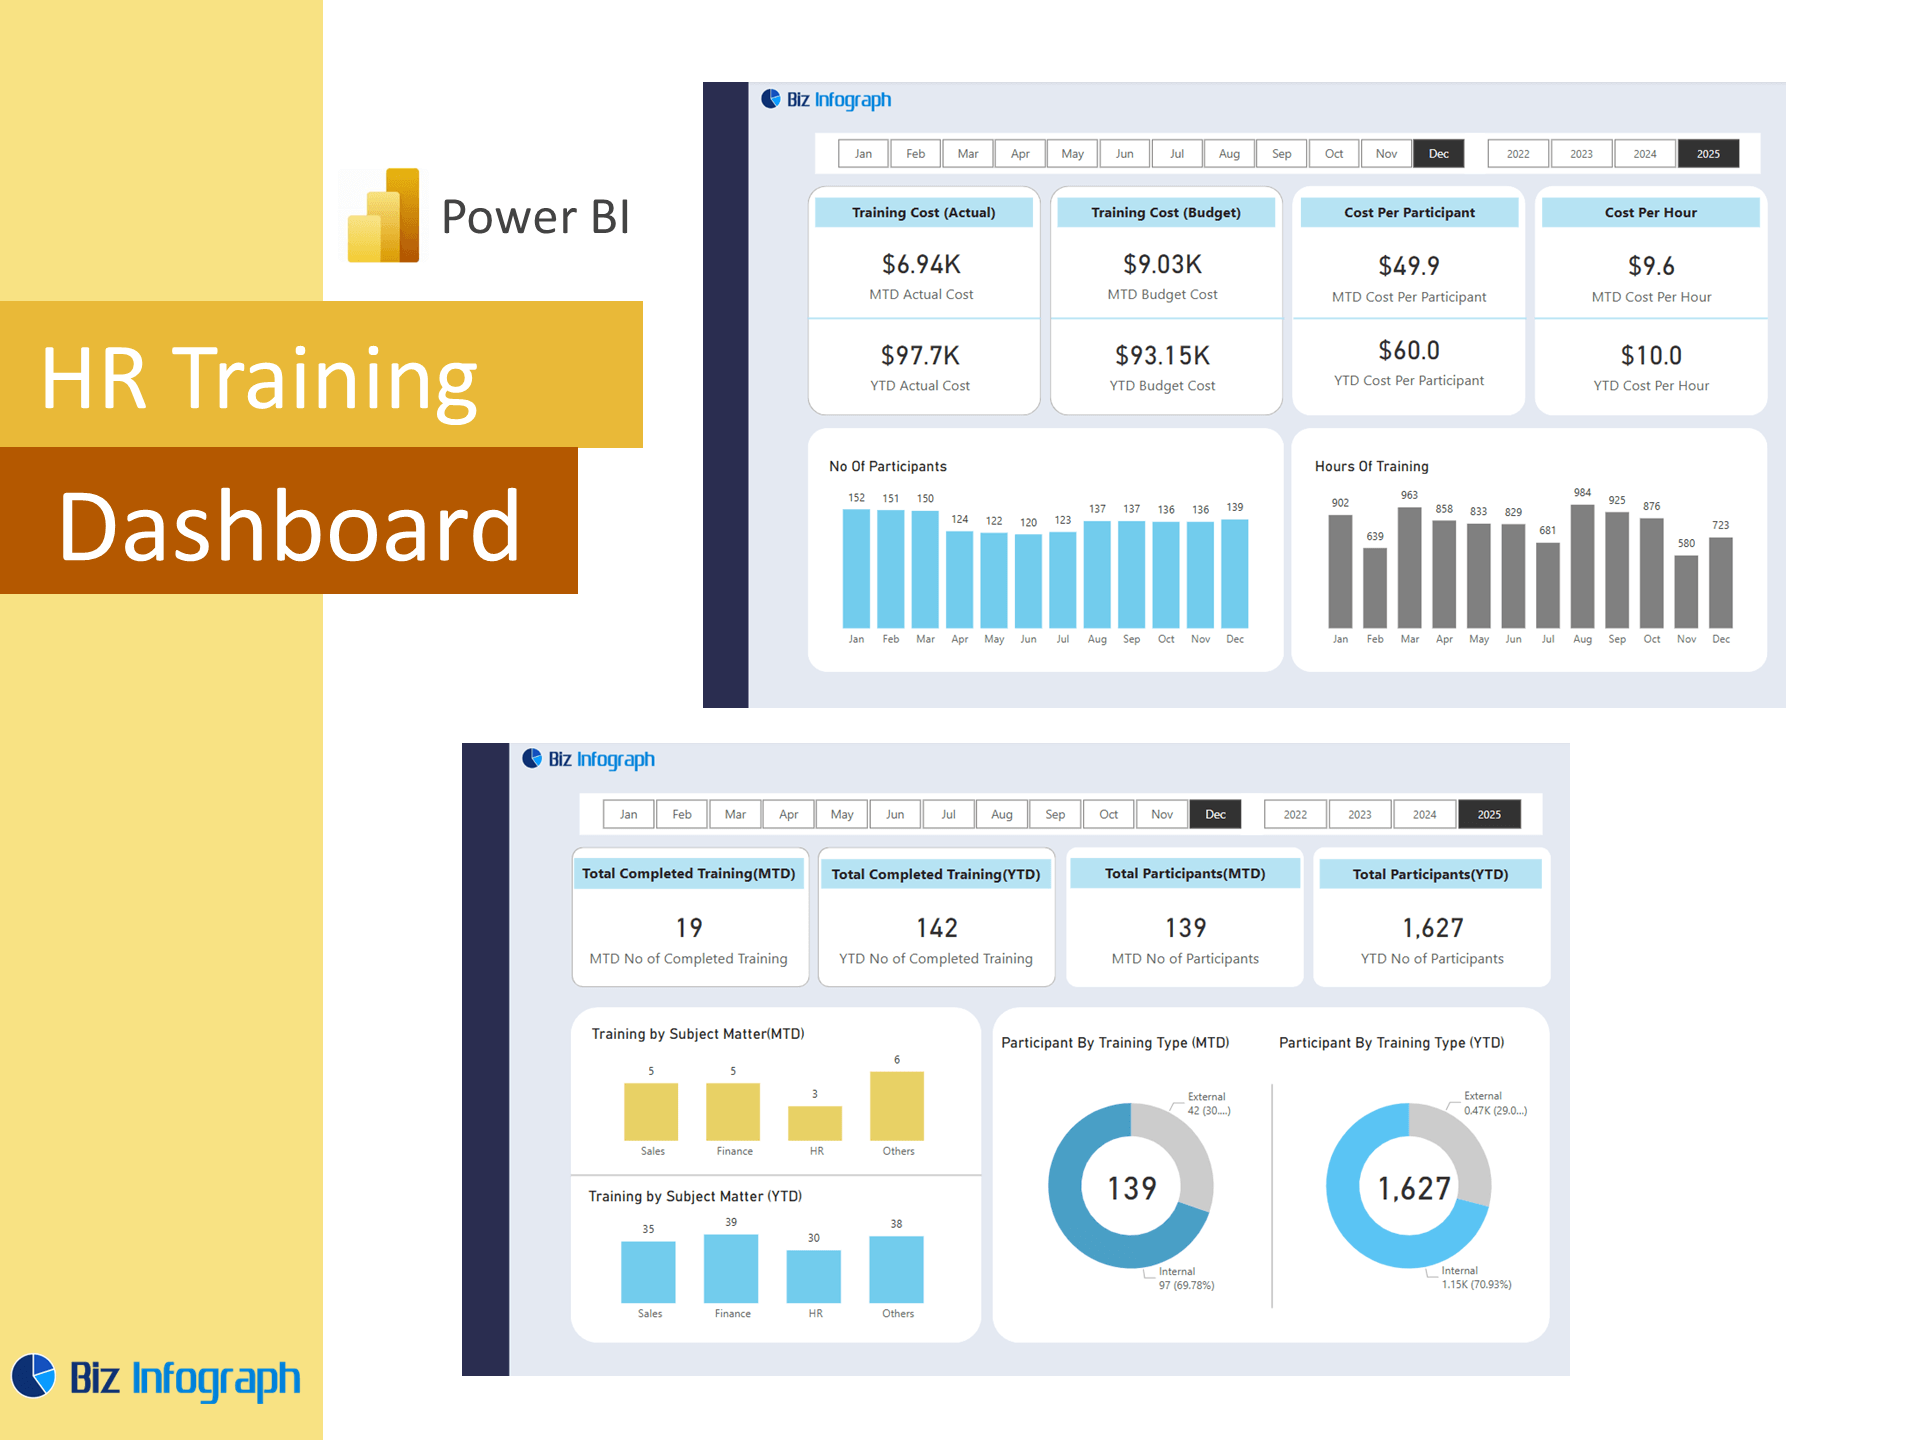
Power BI reports play a vital role in supporting ongoing HR management activities. With customizable pages, scheduled refreshes, and role-based access, these reports empower HR to respond swiftly to changes in staffing, budget, or policy. A well-structured HR Power BI dashboard helps in resource allocation, hiring forecasts, and evaluating the impact of training programs on retention. Power BI solutions give HR teams access to real-time analytics that inform everything from onboarding to offboarding. By leveraging detailed power bi reports, HR leaders can spot inefficiencies, optimize processes, and ensure their workforce strategy aligns with broader organizational goals.
Delivering Performance Indicators that Support Effective HR Decisions
Tracking key performance indicators is essential to ensuring HR strategies are working. A modern HR analytics dashboard built with Power BI HR tools allows organizations to monitor metrics such as time-to-fill, headcount per manager, internal mobility, and engagement scores. These performance indicators offer a window into workforce health and operational efficiency. By combining multiple data sources, dashboards can be enhanced with insights into employee retention, high-potential individuals, and diversity ratios. This comprehensive view enables HR to prioritize initiatives, support leadership planning, and drive continuous improvement through evidence-based decision-making—hallmarks of effective HR leadership.
Creating Scalable Power BI Solutions for Long-Term HR Success
Scalability is crucial in today’s data-rich HR environment. With Power BI for HR, organizations can build flexible, scalable dashboards that grow with evolving business needs. Power BI solutions are designed to accommodate increasing data volume and complexity, making them ideal for companies expanding their global footprint or HR function. These dashboards adapt to changing data types, new metrics, and evolving HR processes with minimal development effort. HR analysts can maintain these tools without relying heavily on IT, allowing the HR department to remain agile. Over time, this approach fosters continuous improvement and supports a mature, data-first HR culture.
For ready-to-use Dashboard Templates: