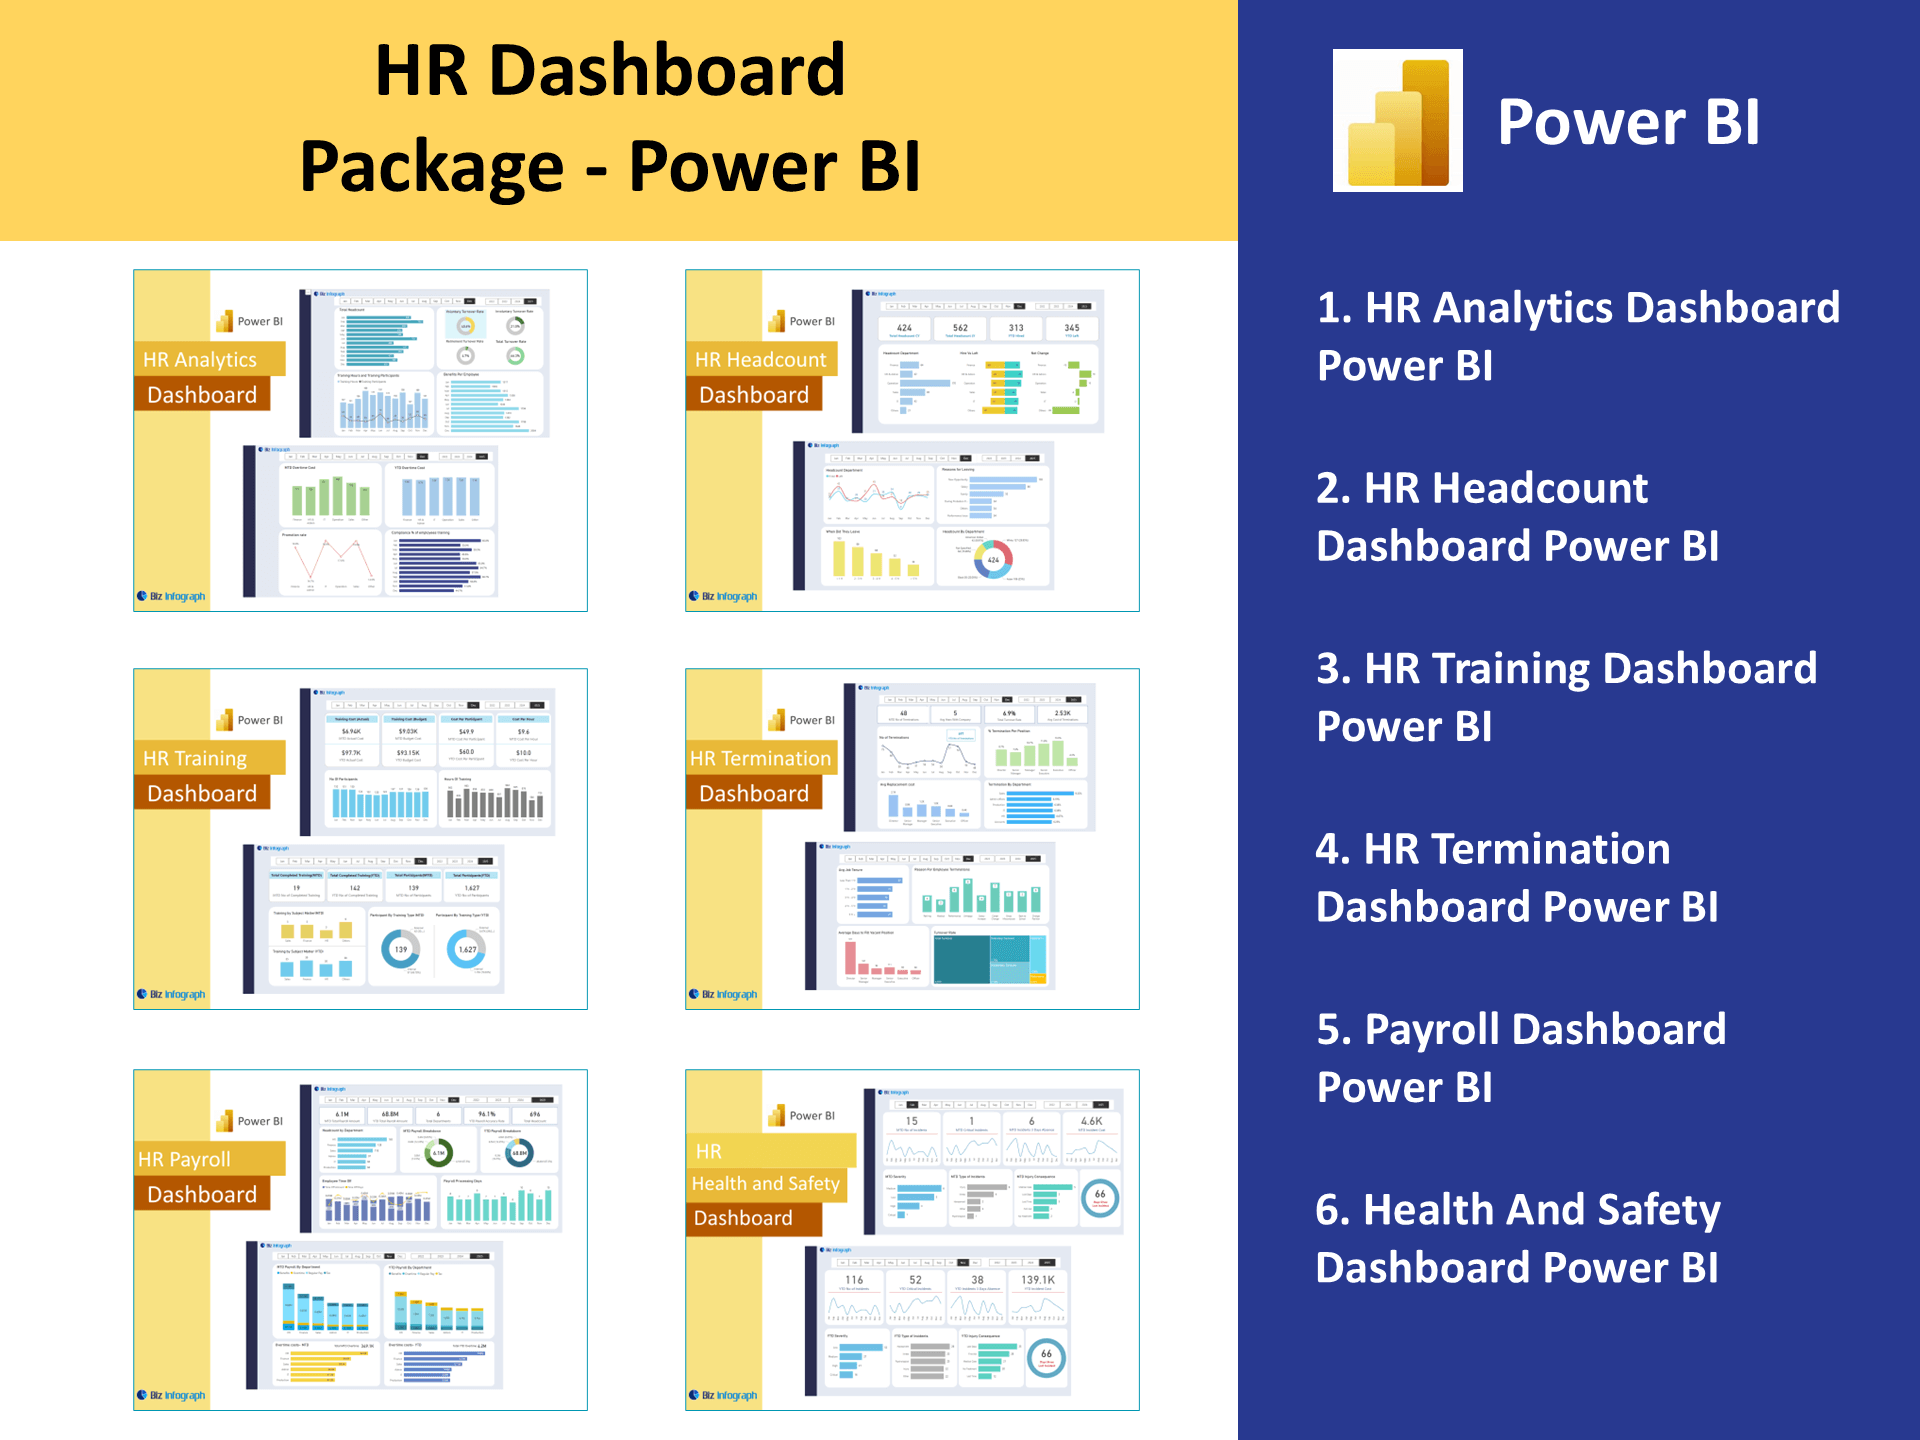
HR Analytics Power BI Dashboard
Building an Effective HR Dashboard
Designing the Dashboard Layout for Clarity and Impact
Good dashboard design is critical to turning complex information into digestible insights. When you design the dashboard layout, it should reflect the goals of the business and the needs of the HR managers. A well-designed dashboard using Power BI typically includes clear sections for key performance indicators, trend analysis, and segmentation filters such as demographics, tenure, and department. The layout must support storytelling: from employee satisfaction to turnover rates, each visual element should serve a purpose. HR analytics dashboards with thoughtful design improve usability, encourage adoption, and ensure that stakeholders can quickly act on the hr insights presented.
Creating a Robust Data Model with Microsoft Data
A strong data model is the backbone of any successful Power BI HR dashboard. Start by defining key HR metrics such as hires, exits, absenteeism, and performance scores. Connect these to clean Microsoft data or HRIS exports through Power Query. During the data cleaning stage, transform flat files or spreadsheets into structured data tables that reflect your organizational hierarchy and job roles. The resulting model should enable drill-down capabilities—for example, viewing employee attrition by age, location, or job type. A clean, scalable data model ensures consistent reporting across dashboards and enables deep exploration of trends and patterns in the workforce.
Using Visualization Tools to Analyze Key HR Metrics
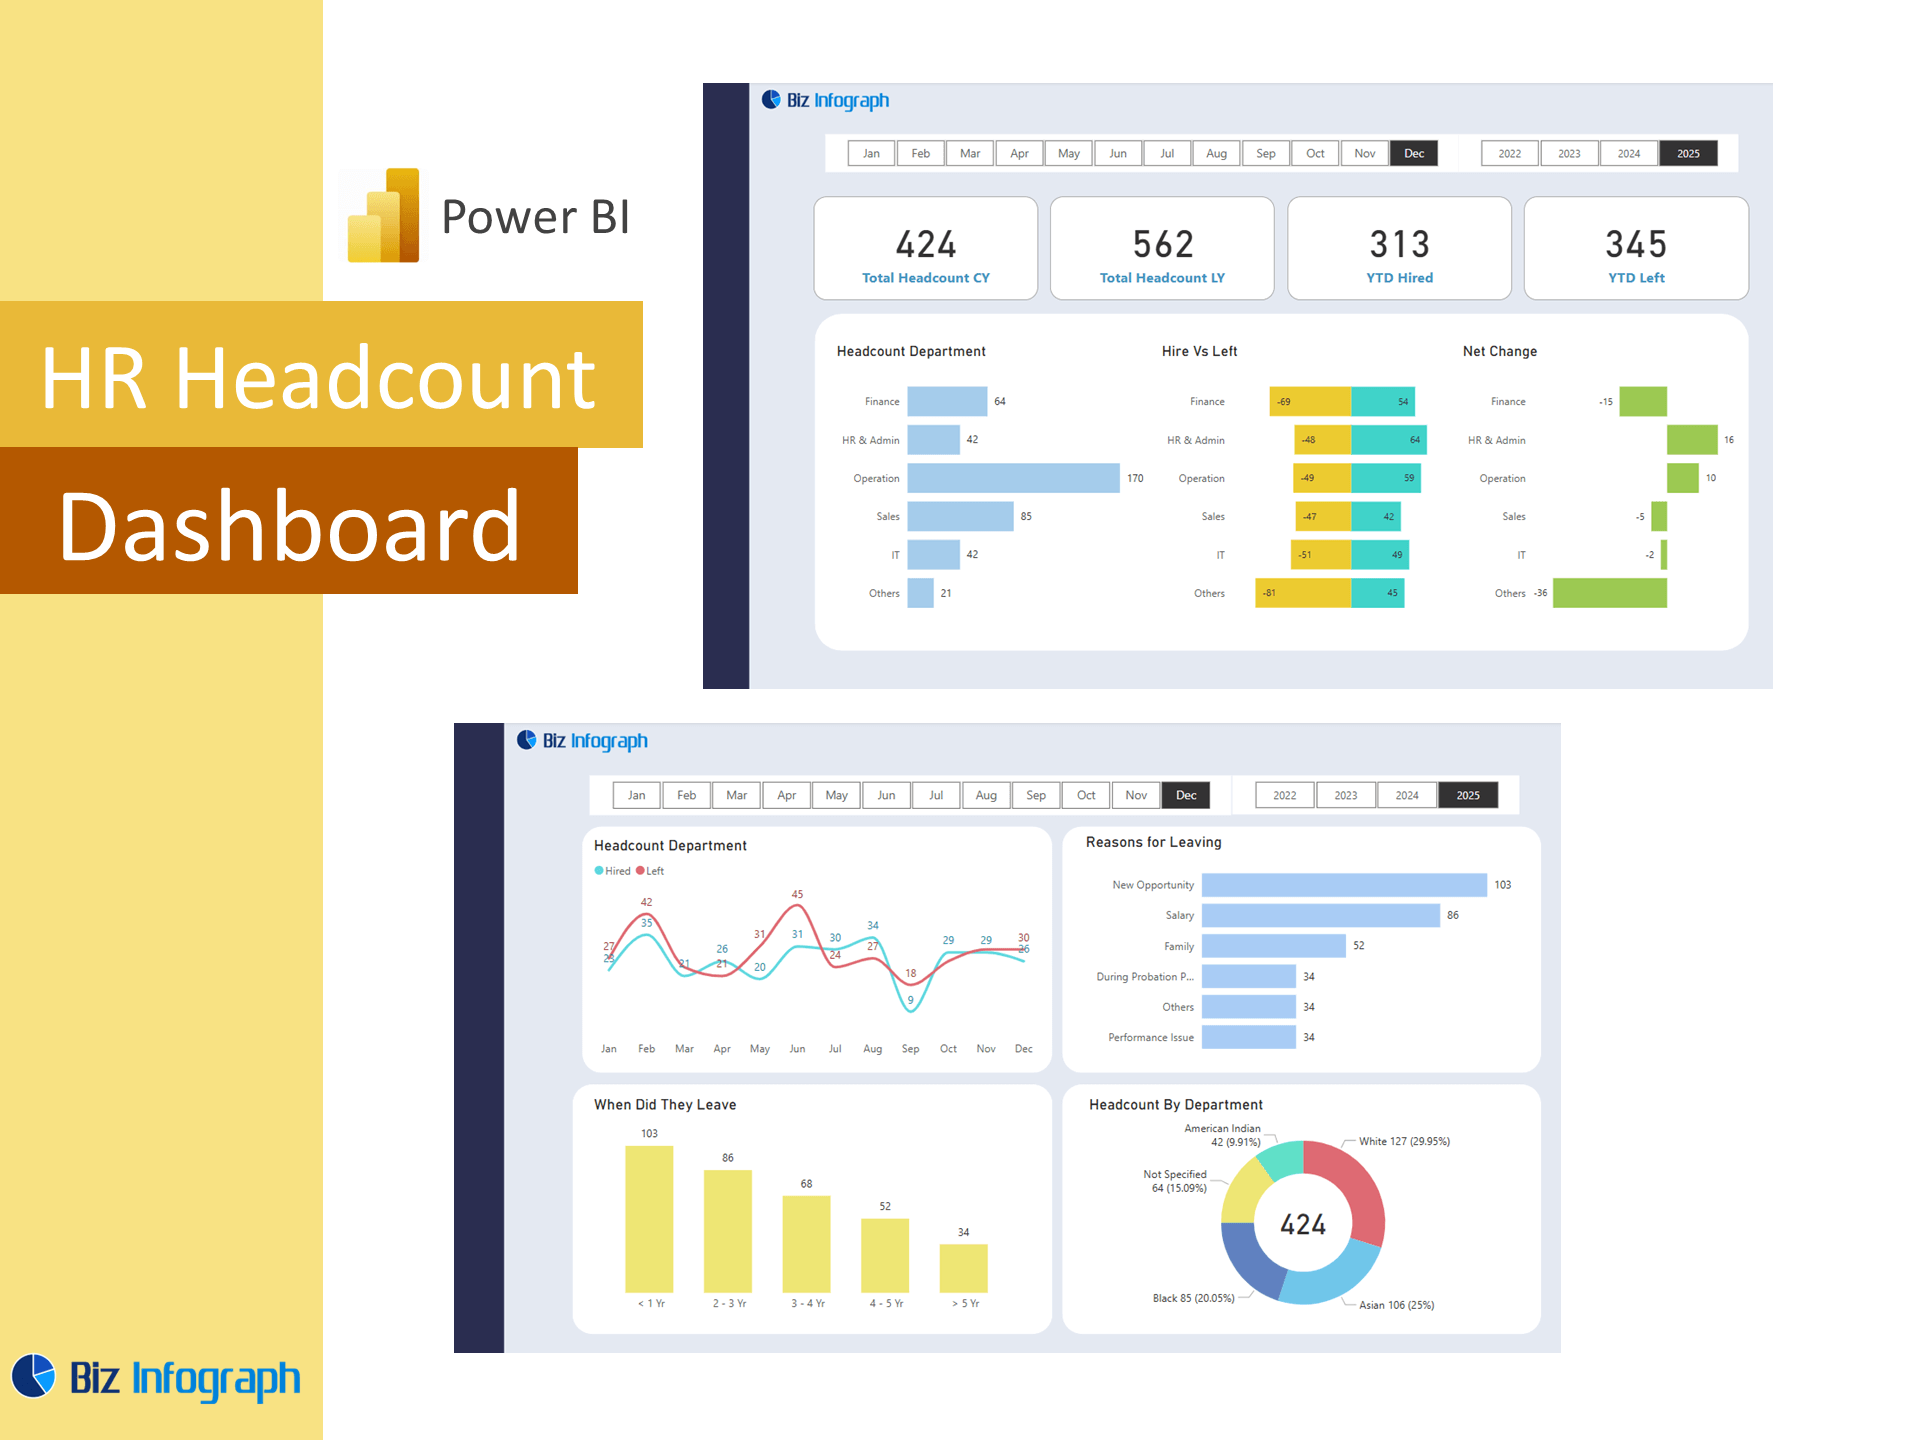
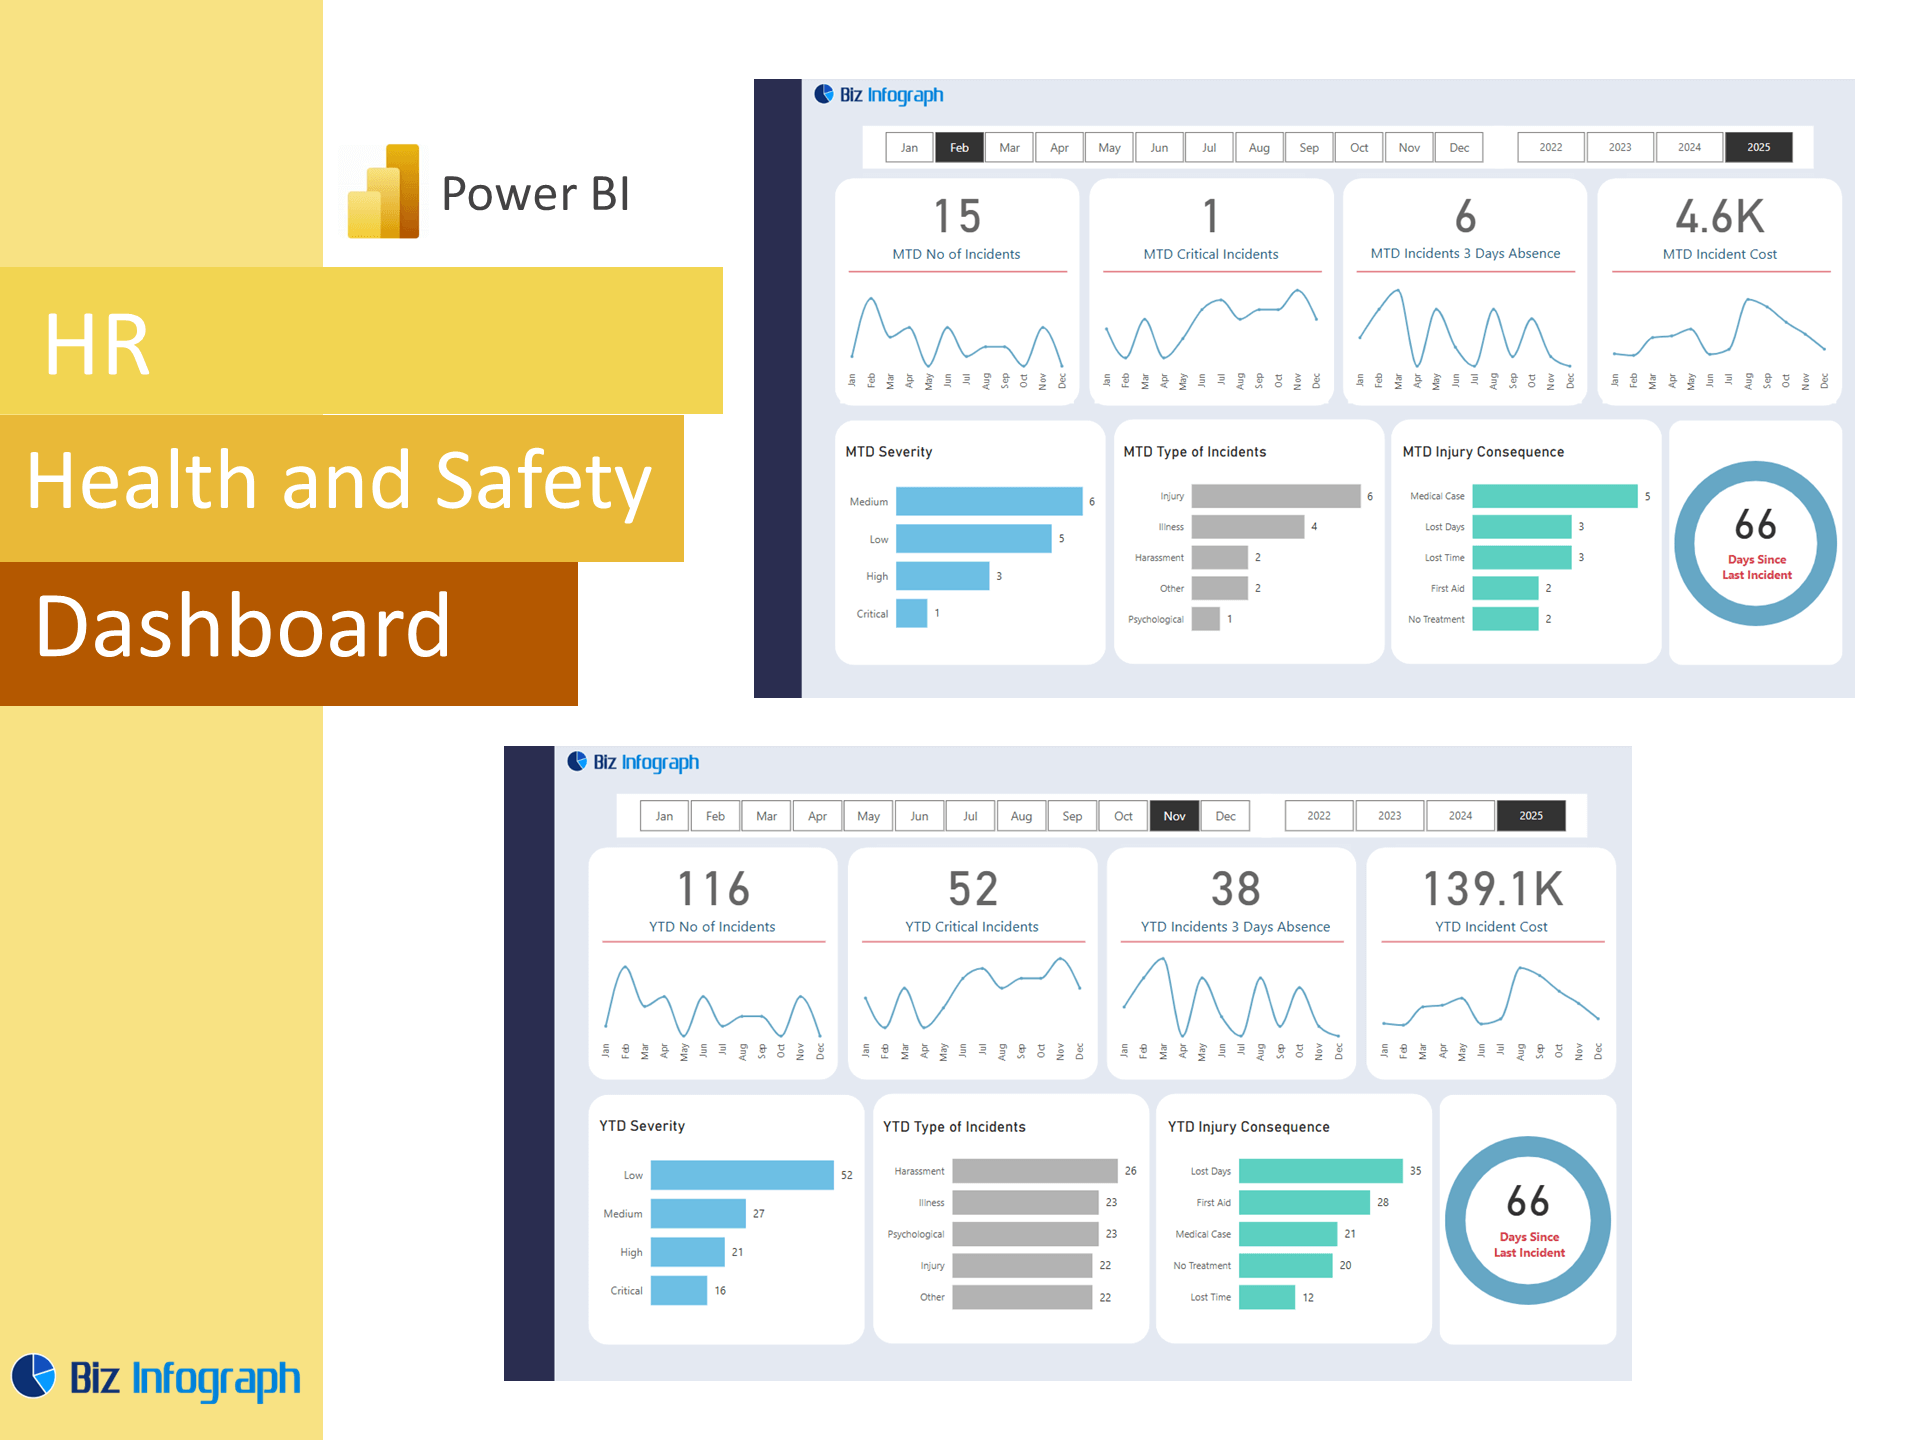
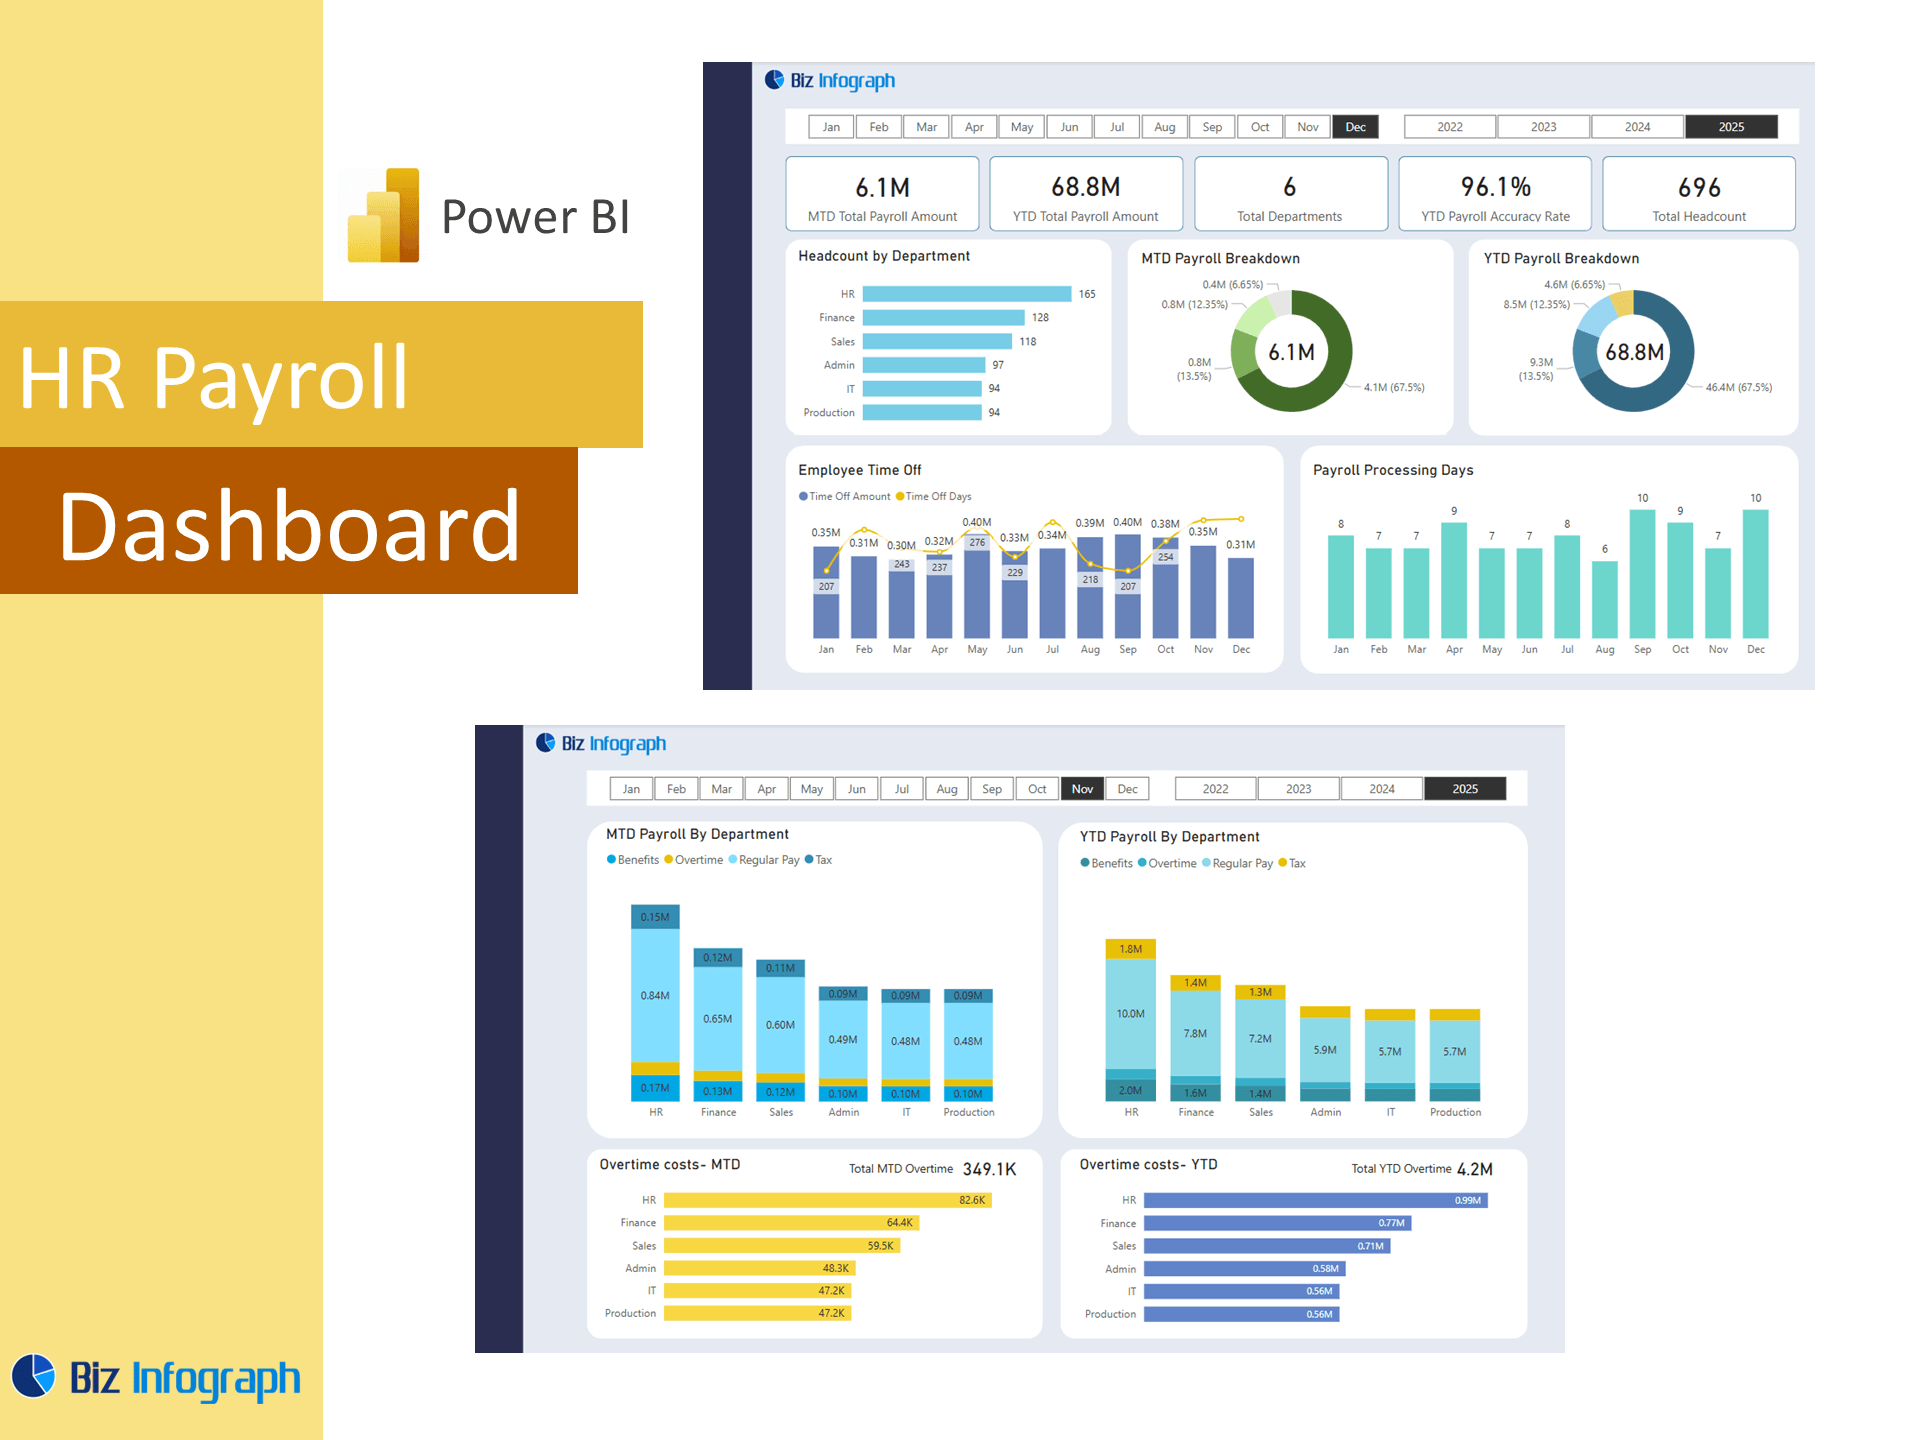
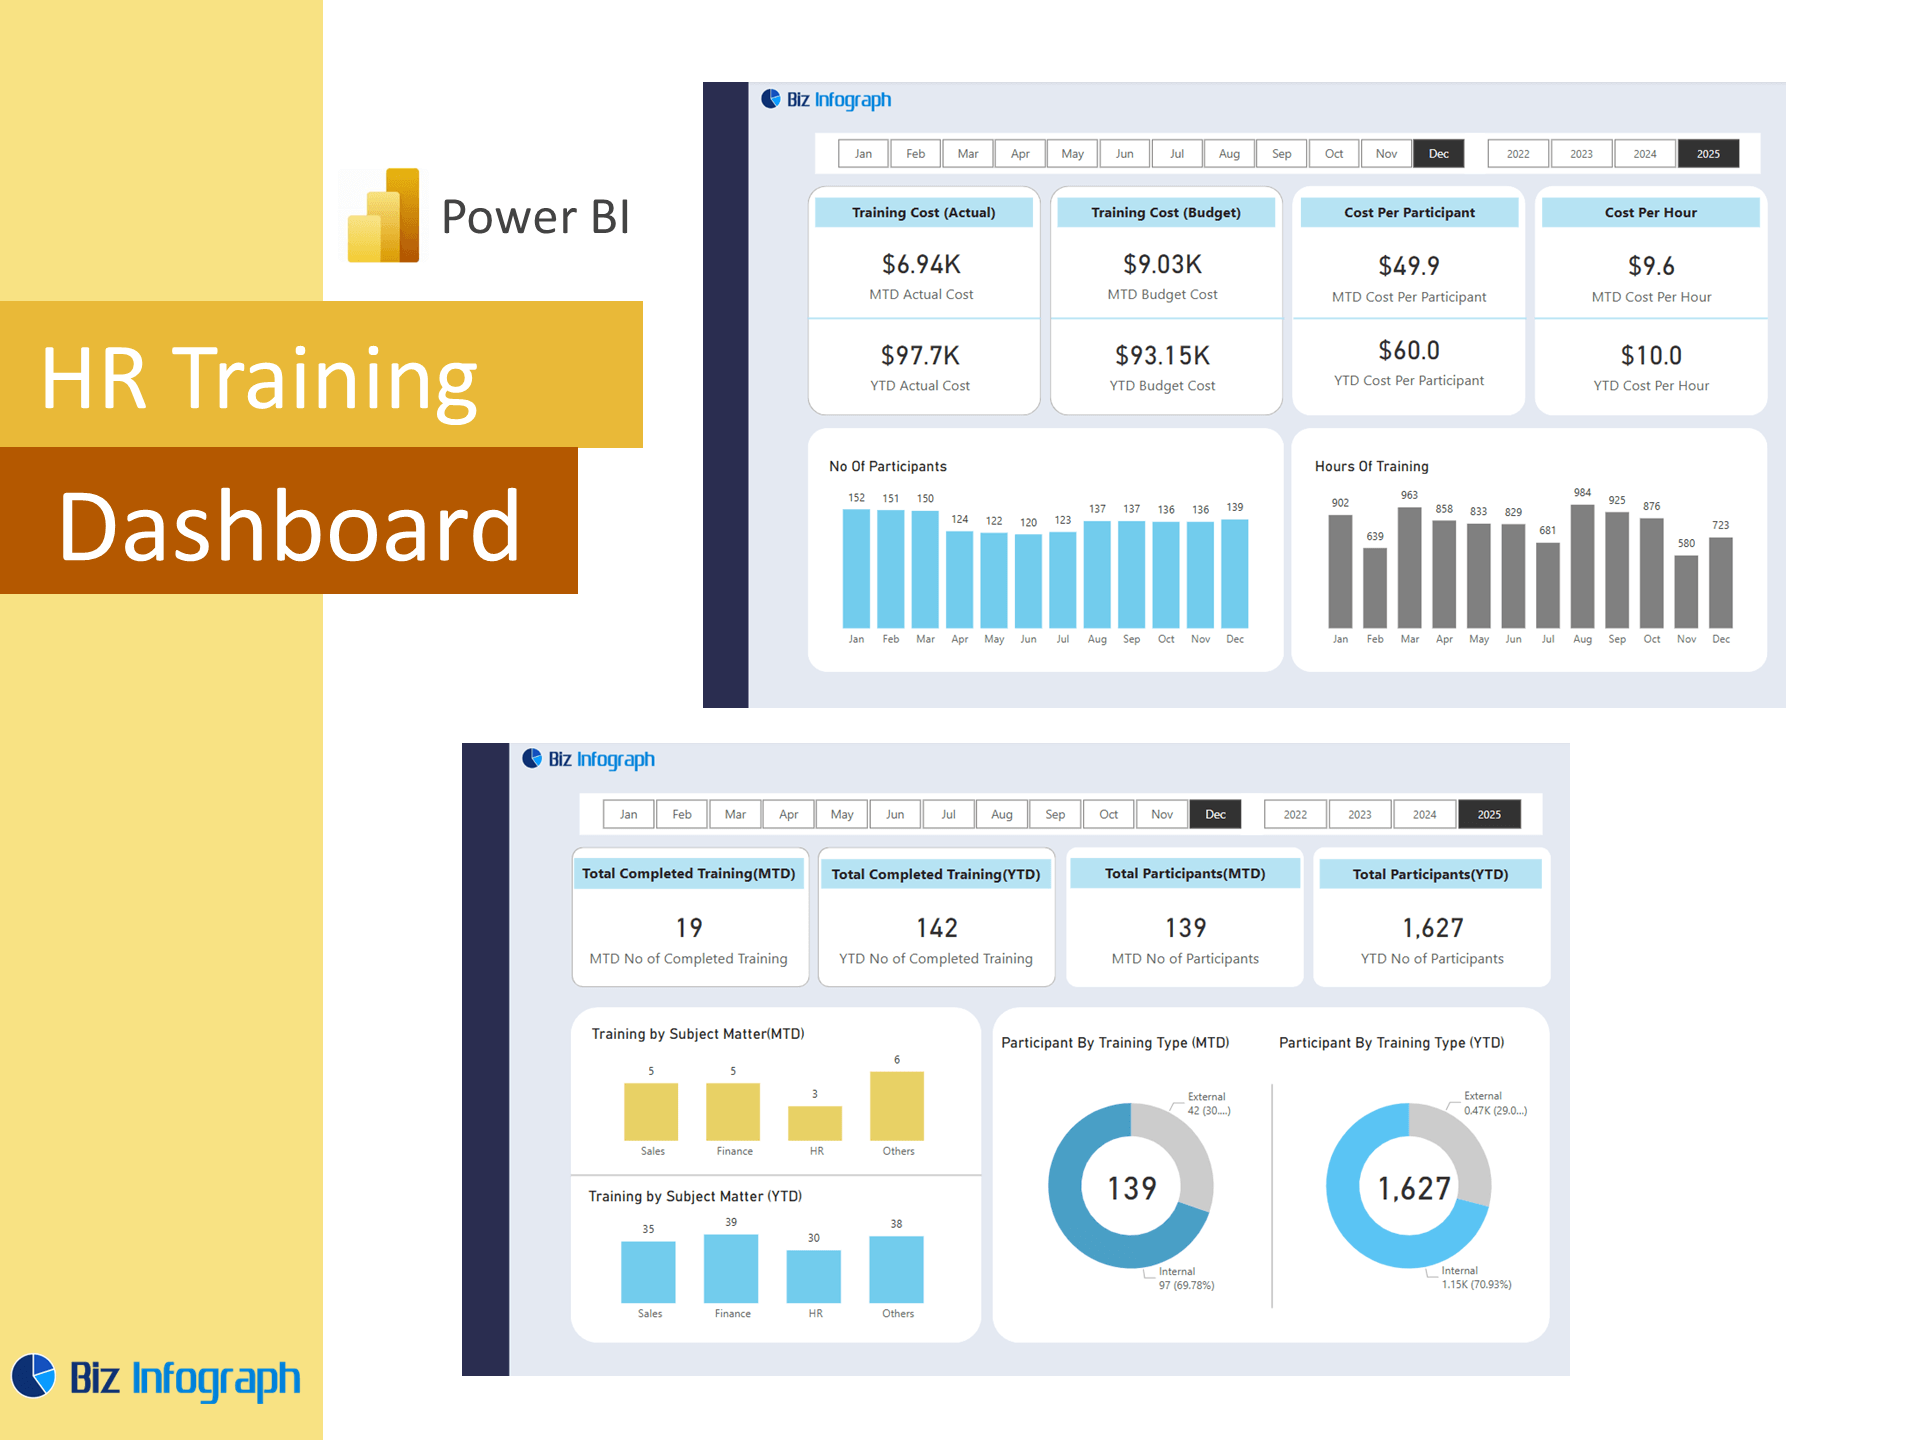
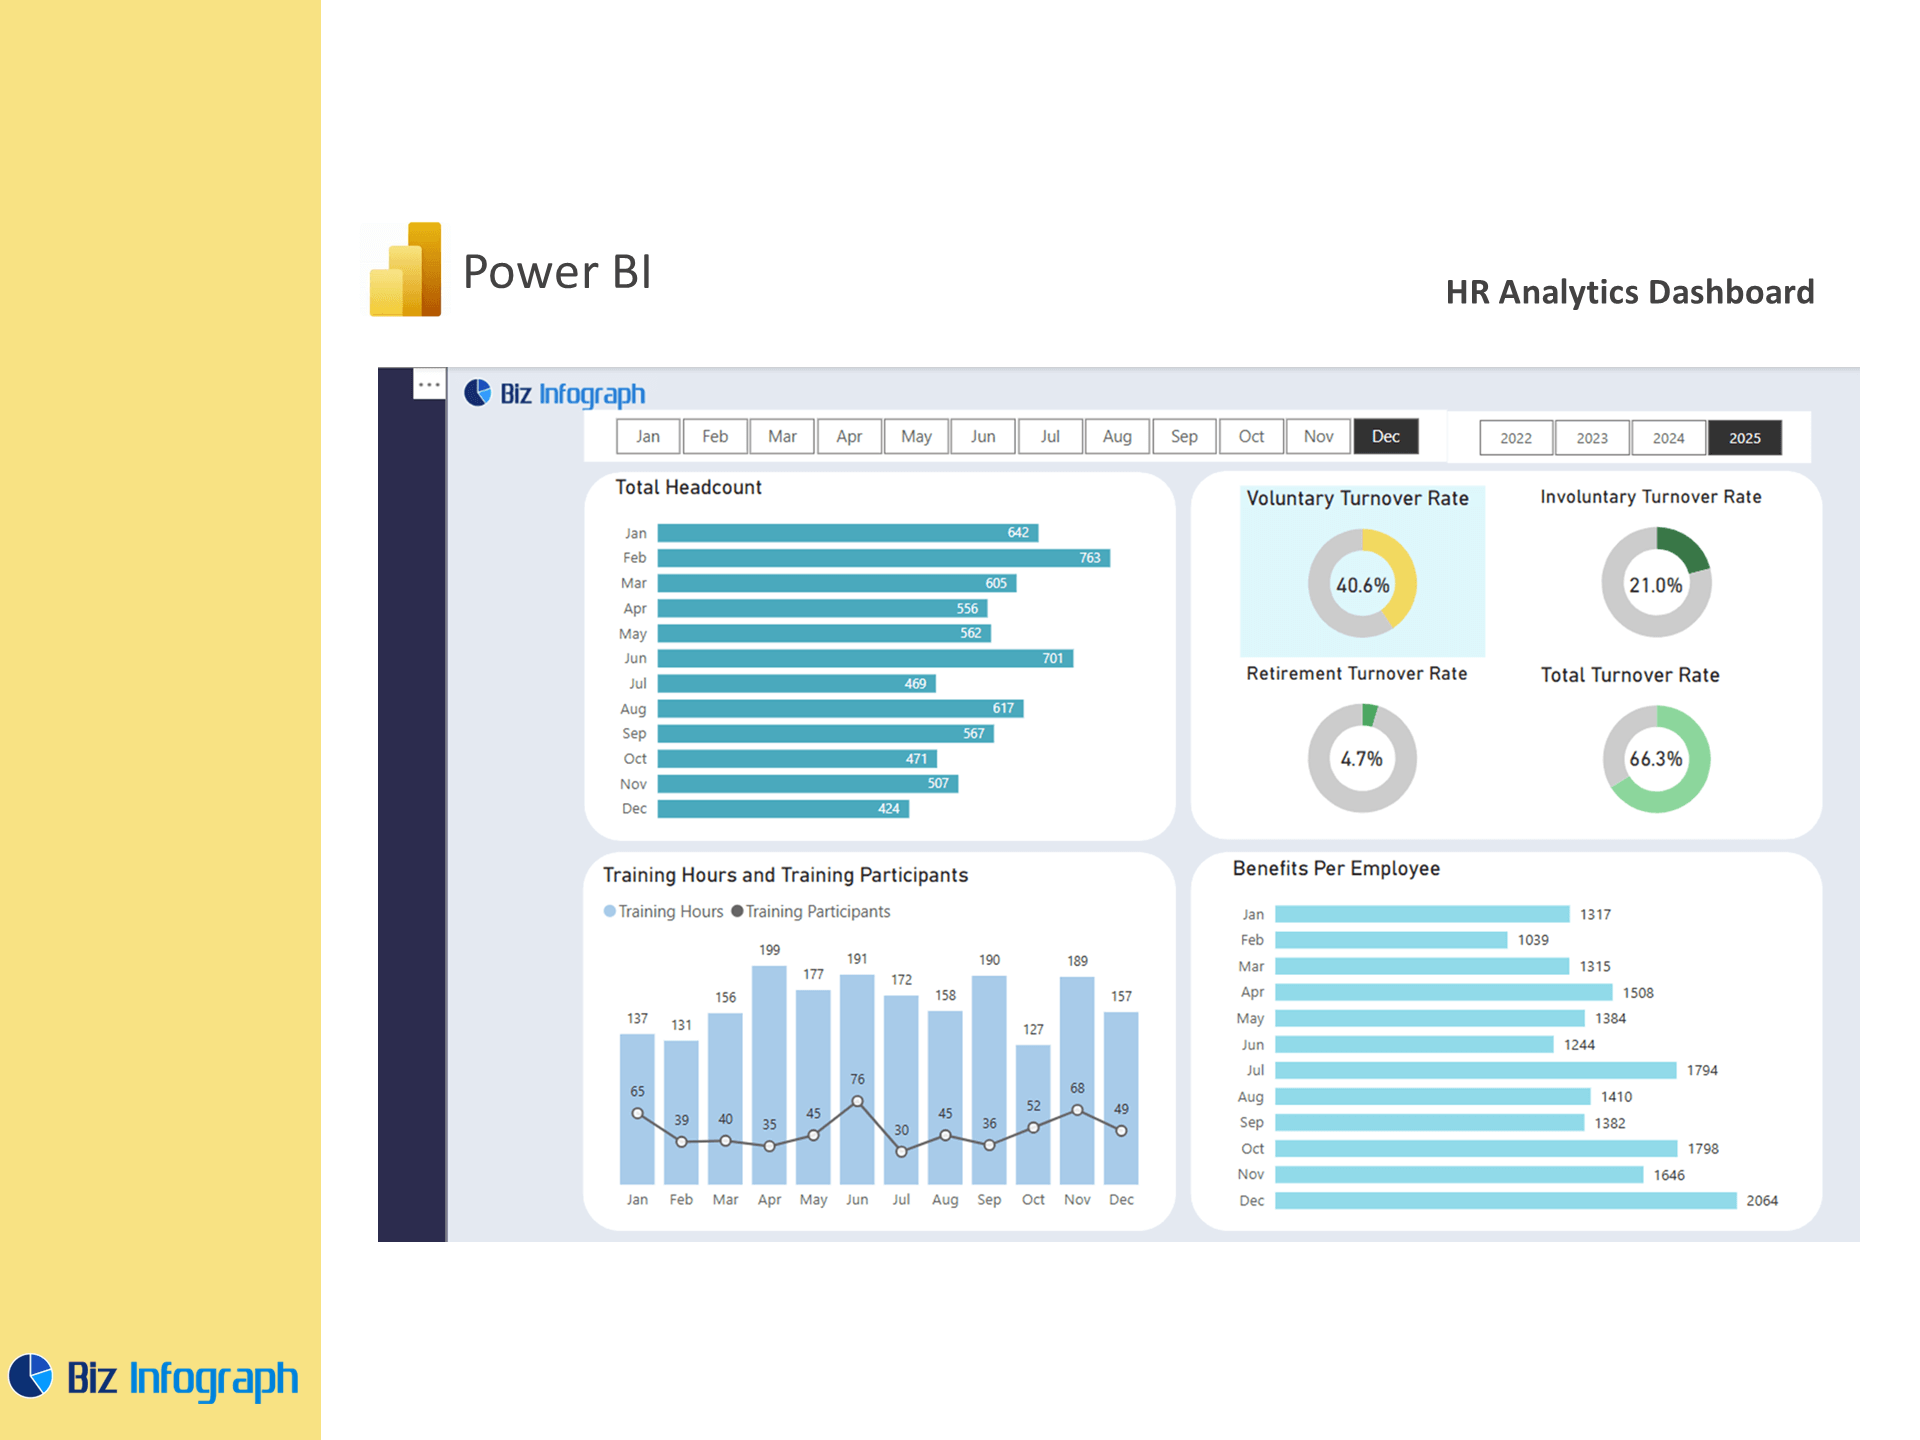
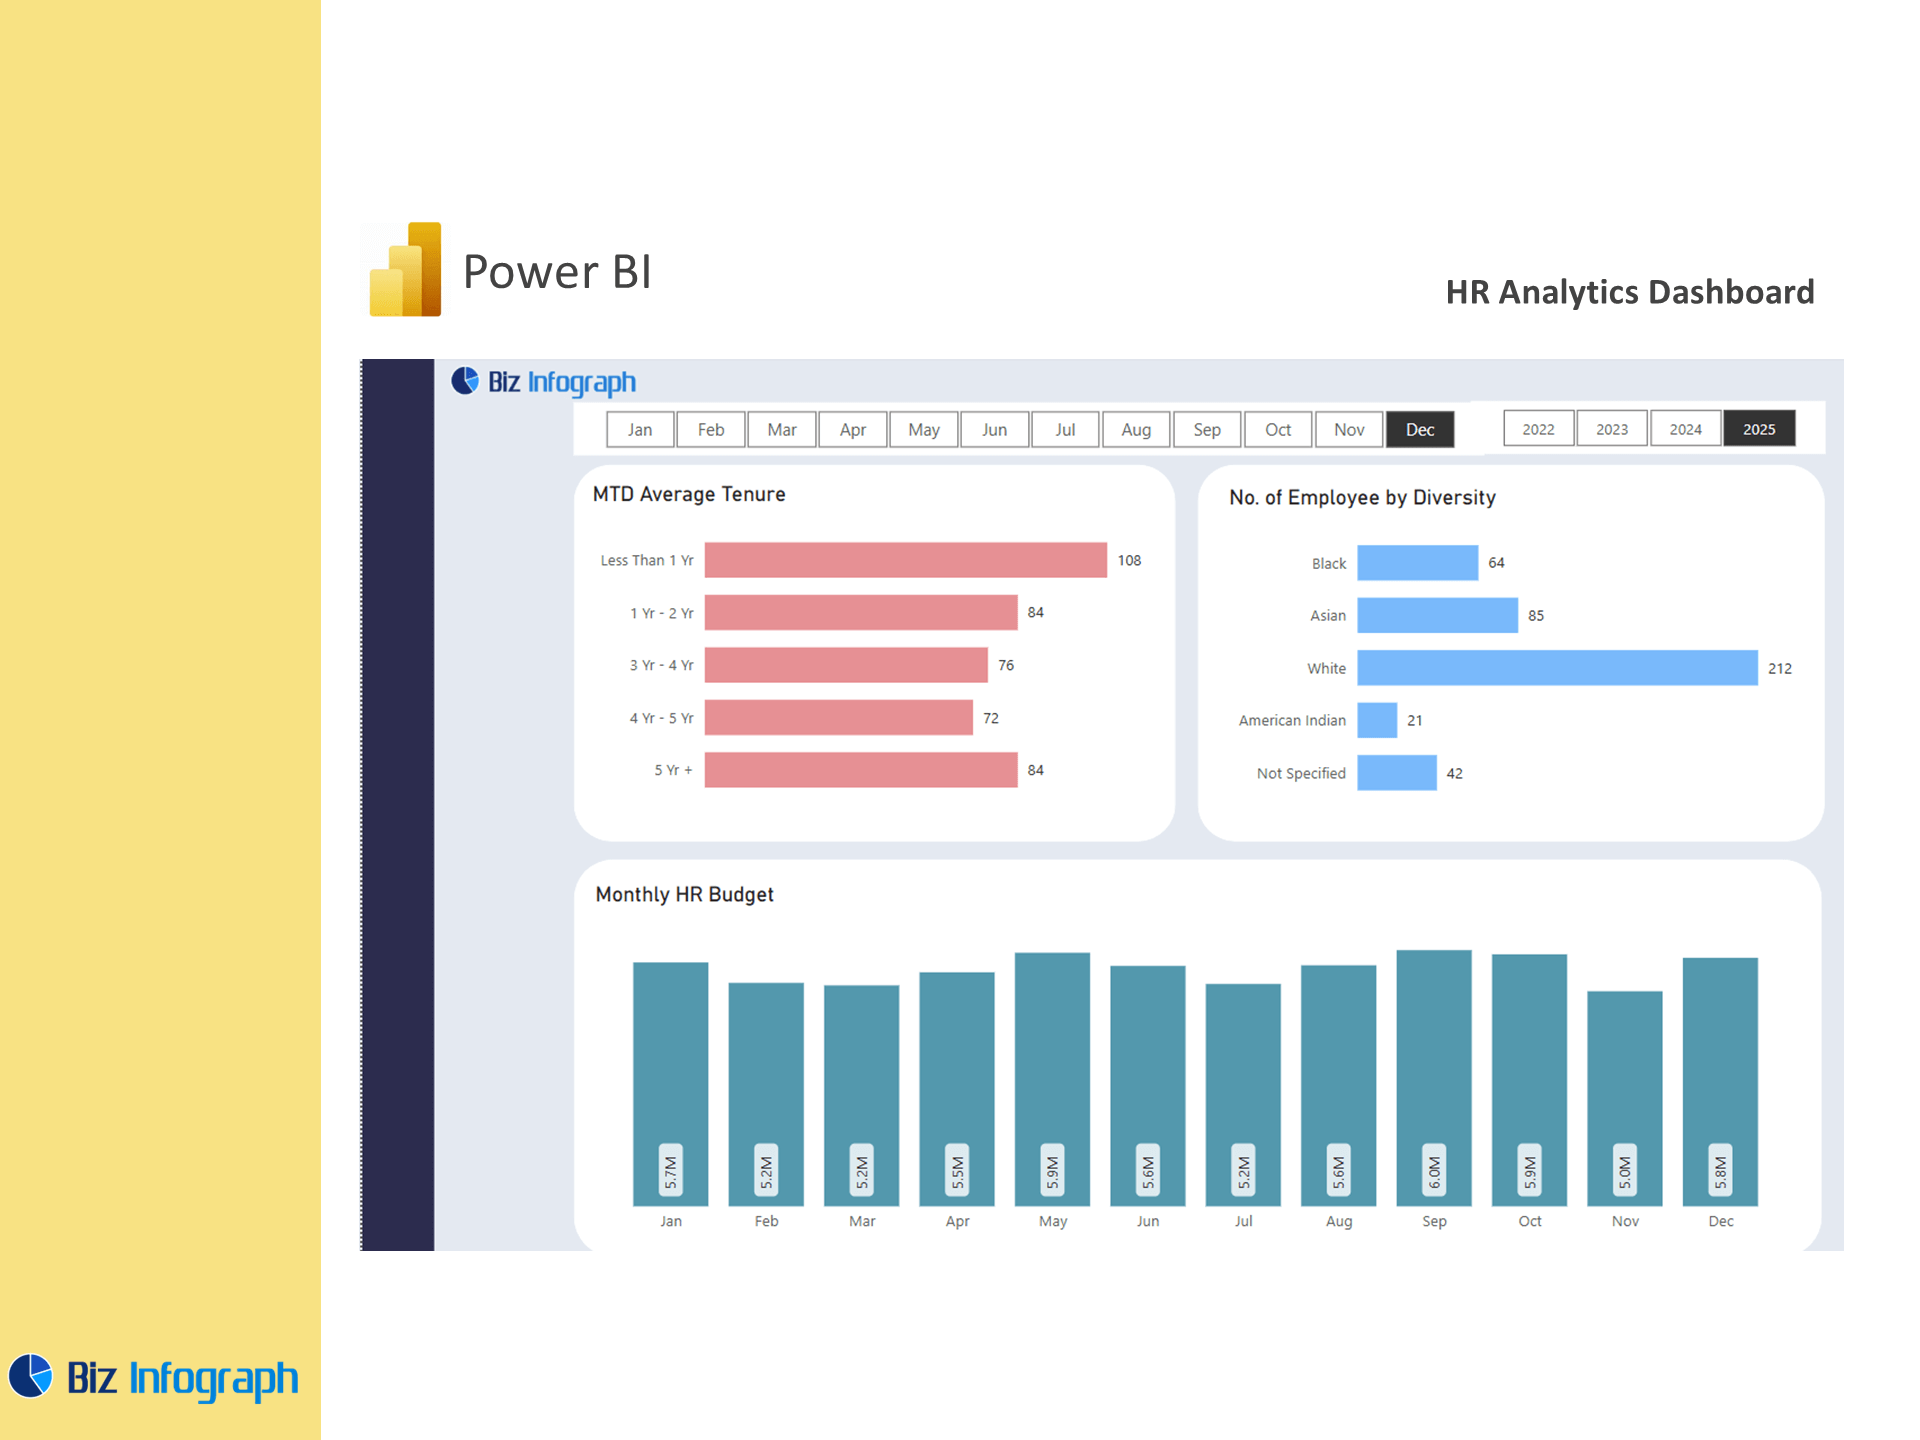
Data visualization brings key insights to life. With Power BI’s rich library of visuals—like stacked bars, KPIs, scatter plots, and heat maps—HR teams can analyze patterns in hiring, retention, and engagement with clarity. A well-designed analysis dashboard tracks key performance indicators like headcount growth, employee turnover, internal mobility, and training effectiveness. By visualizing your data, HR professionals can identify trends and present results that resonate with executives and team leaders. These visuals help in storytelling, giving context to fluctuations in employee performance or satisfaction, and ultimately help HR professionals make data-informed decisions that support strategic outcomes.
Key Metrics and KPIs to Track
Essential KPIs for HR Leaders and People Analytics
For people analytics to be impactful, it must focus on the right key performance indicators. Essential HR KPIs include employee engagement, attrition rates, internal promotion ratios, employee count, and average tenure. These indicators give HR leaders a comprehensive view of their workforce, enabling smarter decision-making and modern HR practices. When displayed in a Power BI HR dashboard, these KPIs offer real-time tracking and can be sliced by function, region, or demographics. Monitoring these metrics helps HR teams maintain organizational health and proactively address areas such as low morale or poor employee performance, ultimately driving long-term success.
How to Analyze Key HR Metrics for Workforce Optimization
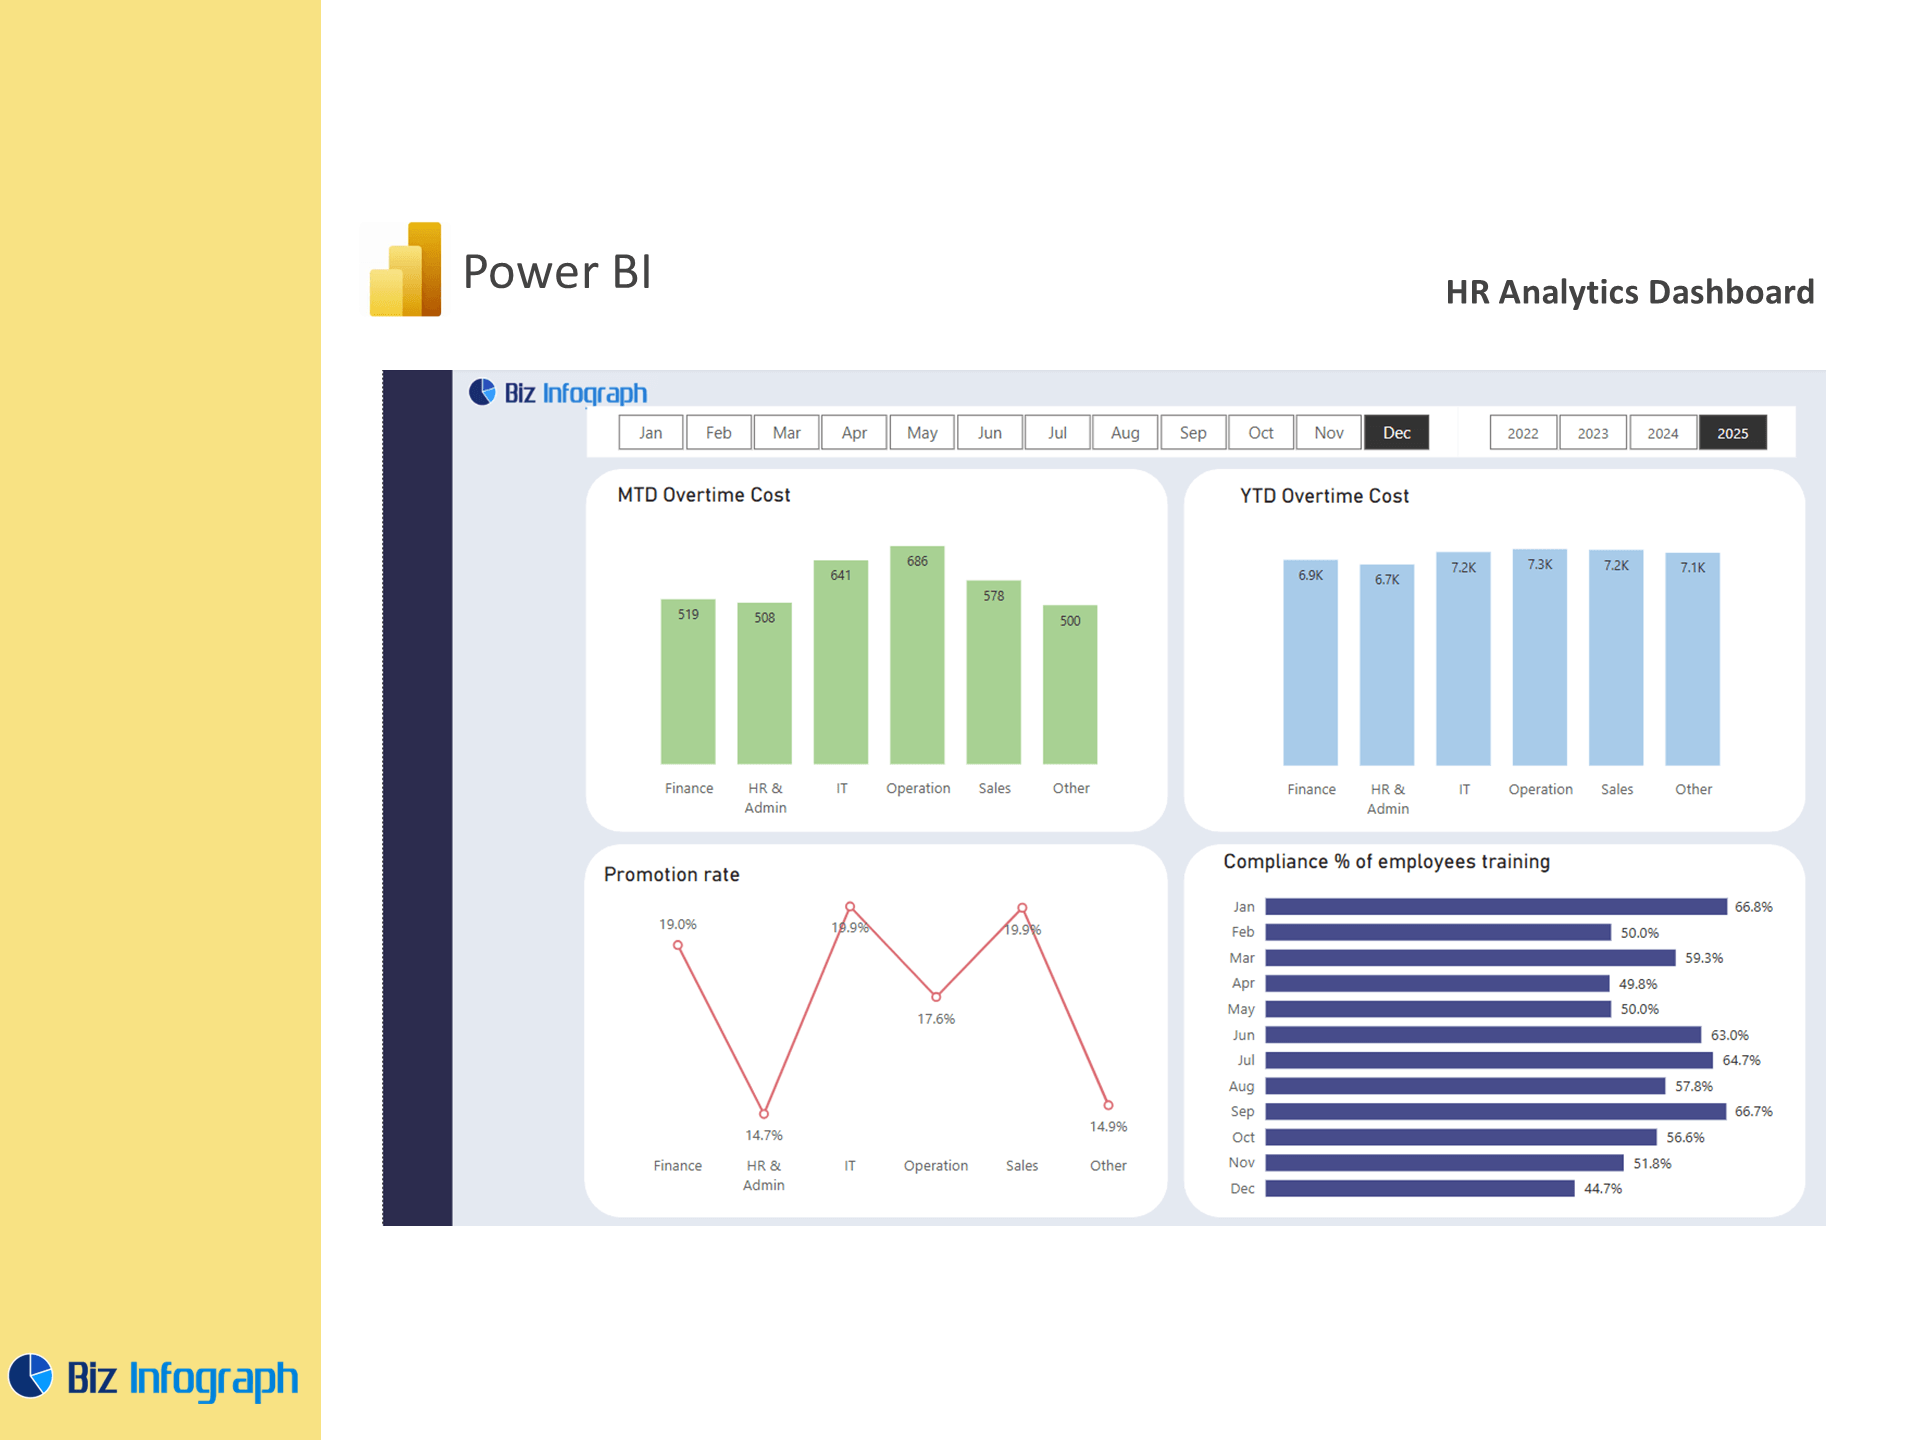
HR analytics using Power BI enables organizations to not only report metrics but to analyze key HR data for operational improvement. For instance, comparing employee engagement scores with turnover rates may reveal departments where leadership changes are needed. Filtering performance scores by job satisfaction levels may help uncover development opportunities. Through data analysis, teams can align learning and development with performance trends, contributing to overall workforce optimization. The strength of Power BI HR lies in its ability to combine qualitative and quantitative data, offering a holistic view of the employee experience while surfacing areas that require strategic action.
Delivering Key Insights through Analytics Dashboards
The goal of any HR analytics dashboard Power BI project is to deliver key insights that drive transformation. Dashboards should help understand employee behavior, predict turnover, and enhance employee engagement through targeted interventions. With BI HR analytics, stakeholders can view historical patterns and use predictive analytics to make more proactive workforce decisions. These analytics dashboards serve as powerful storytelling tools—combining clean visuals, robust data models, and impactful KPIs. The ability to publish the dashboard across teams and leadership through the Power BI end-to-end project lifecycle ensures alignment and fosters a data-driven HR culture.
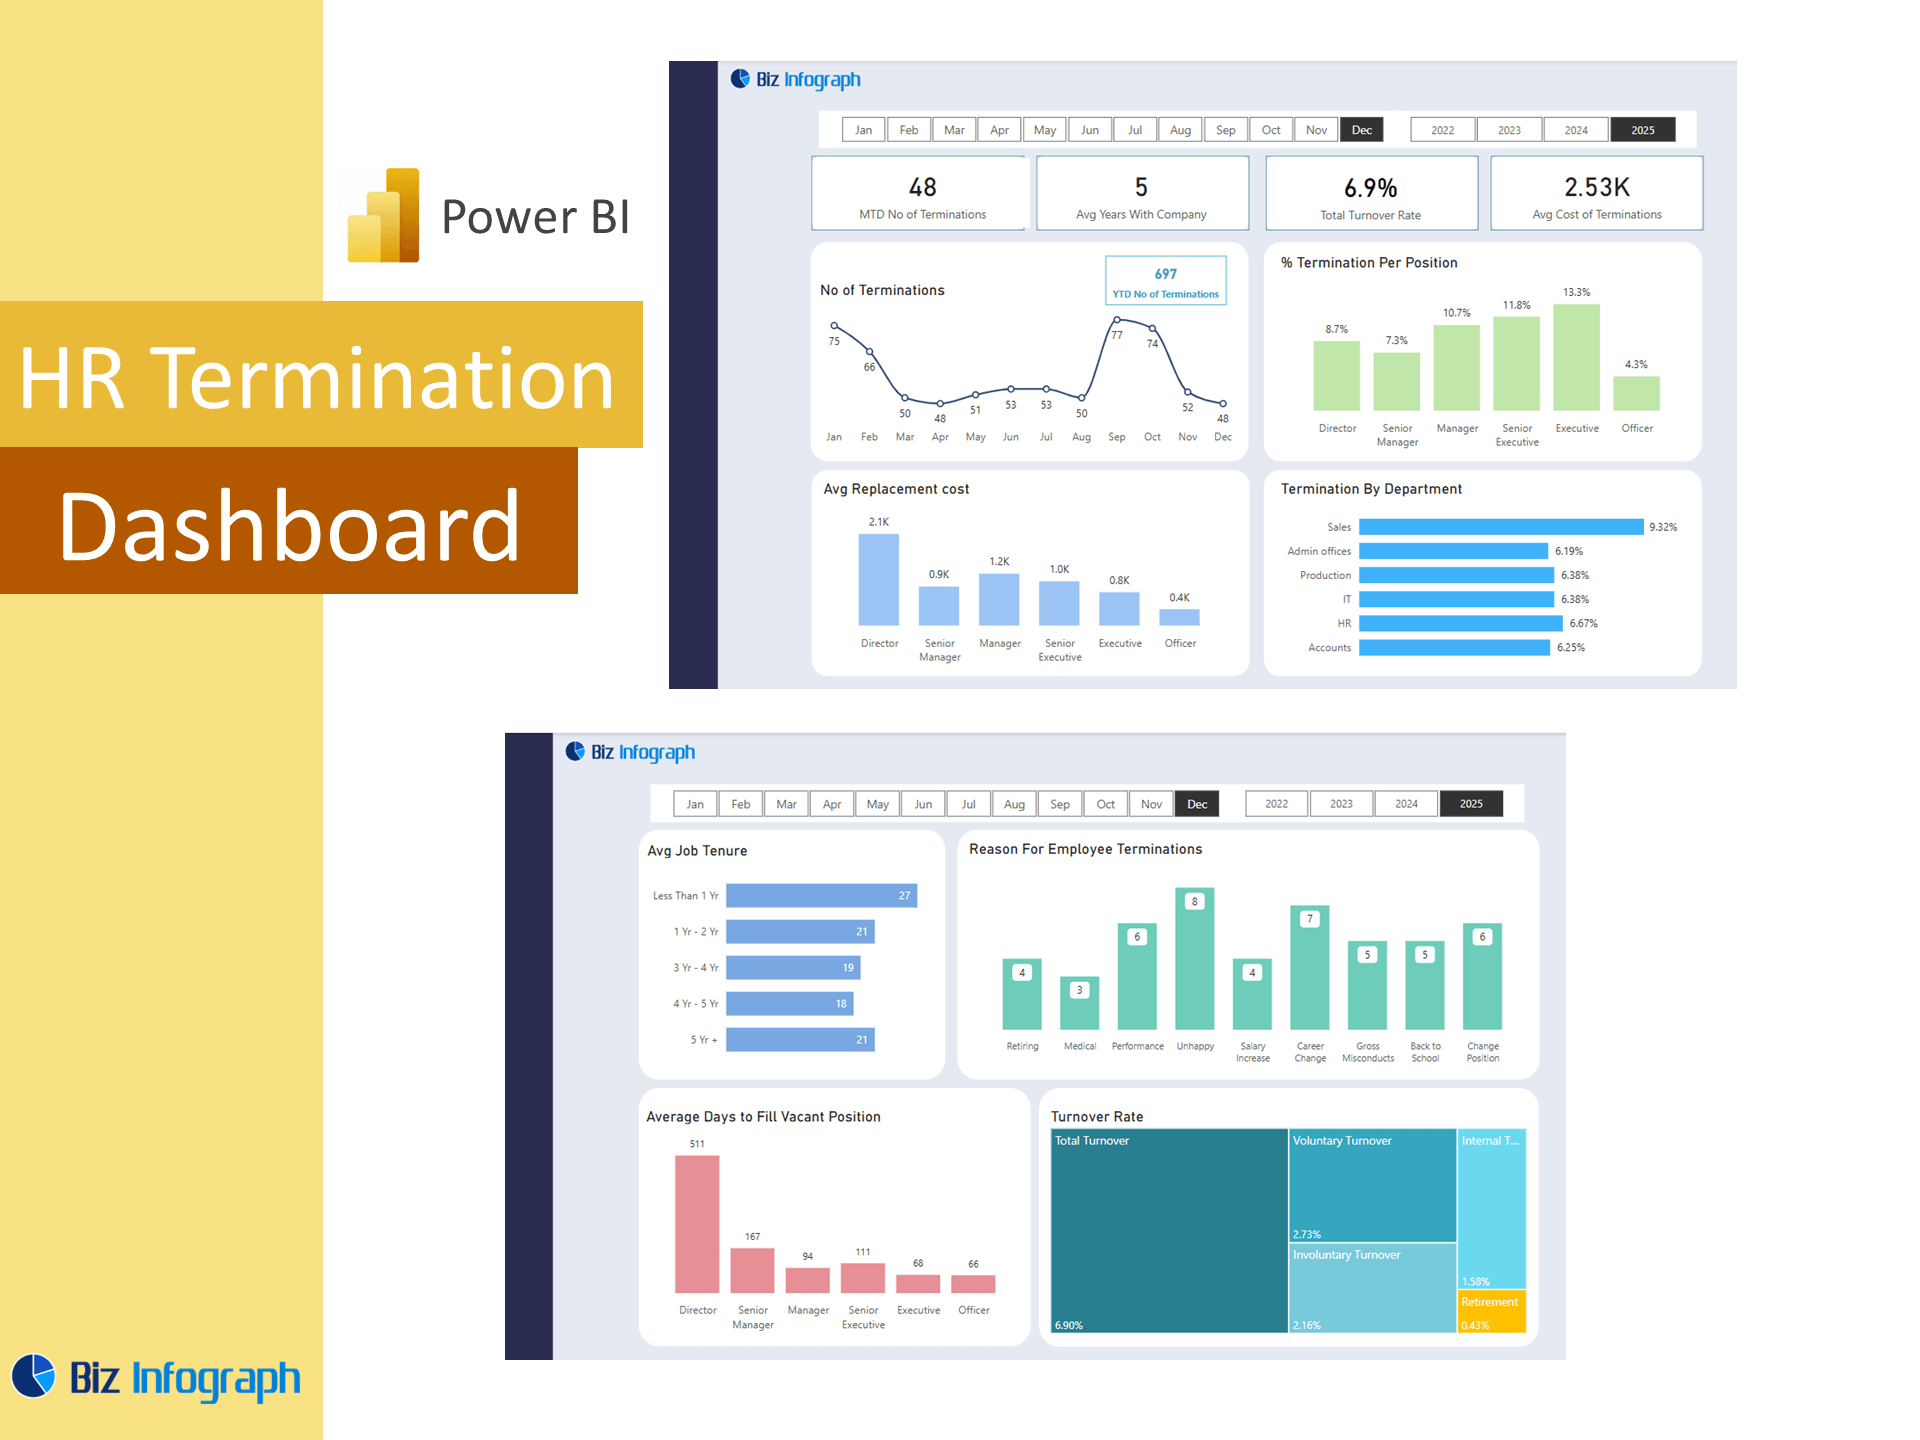
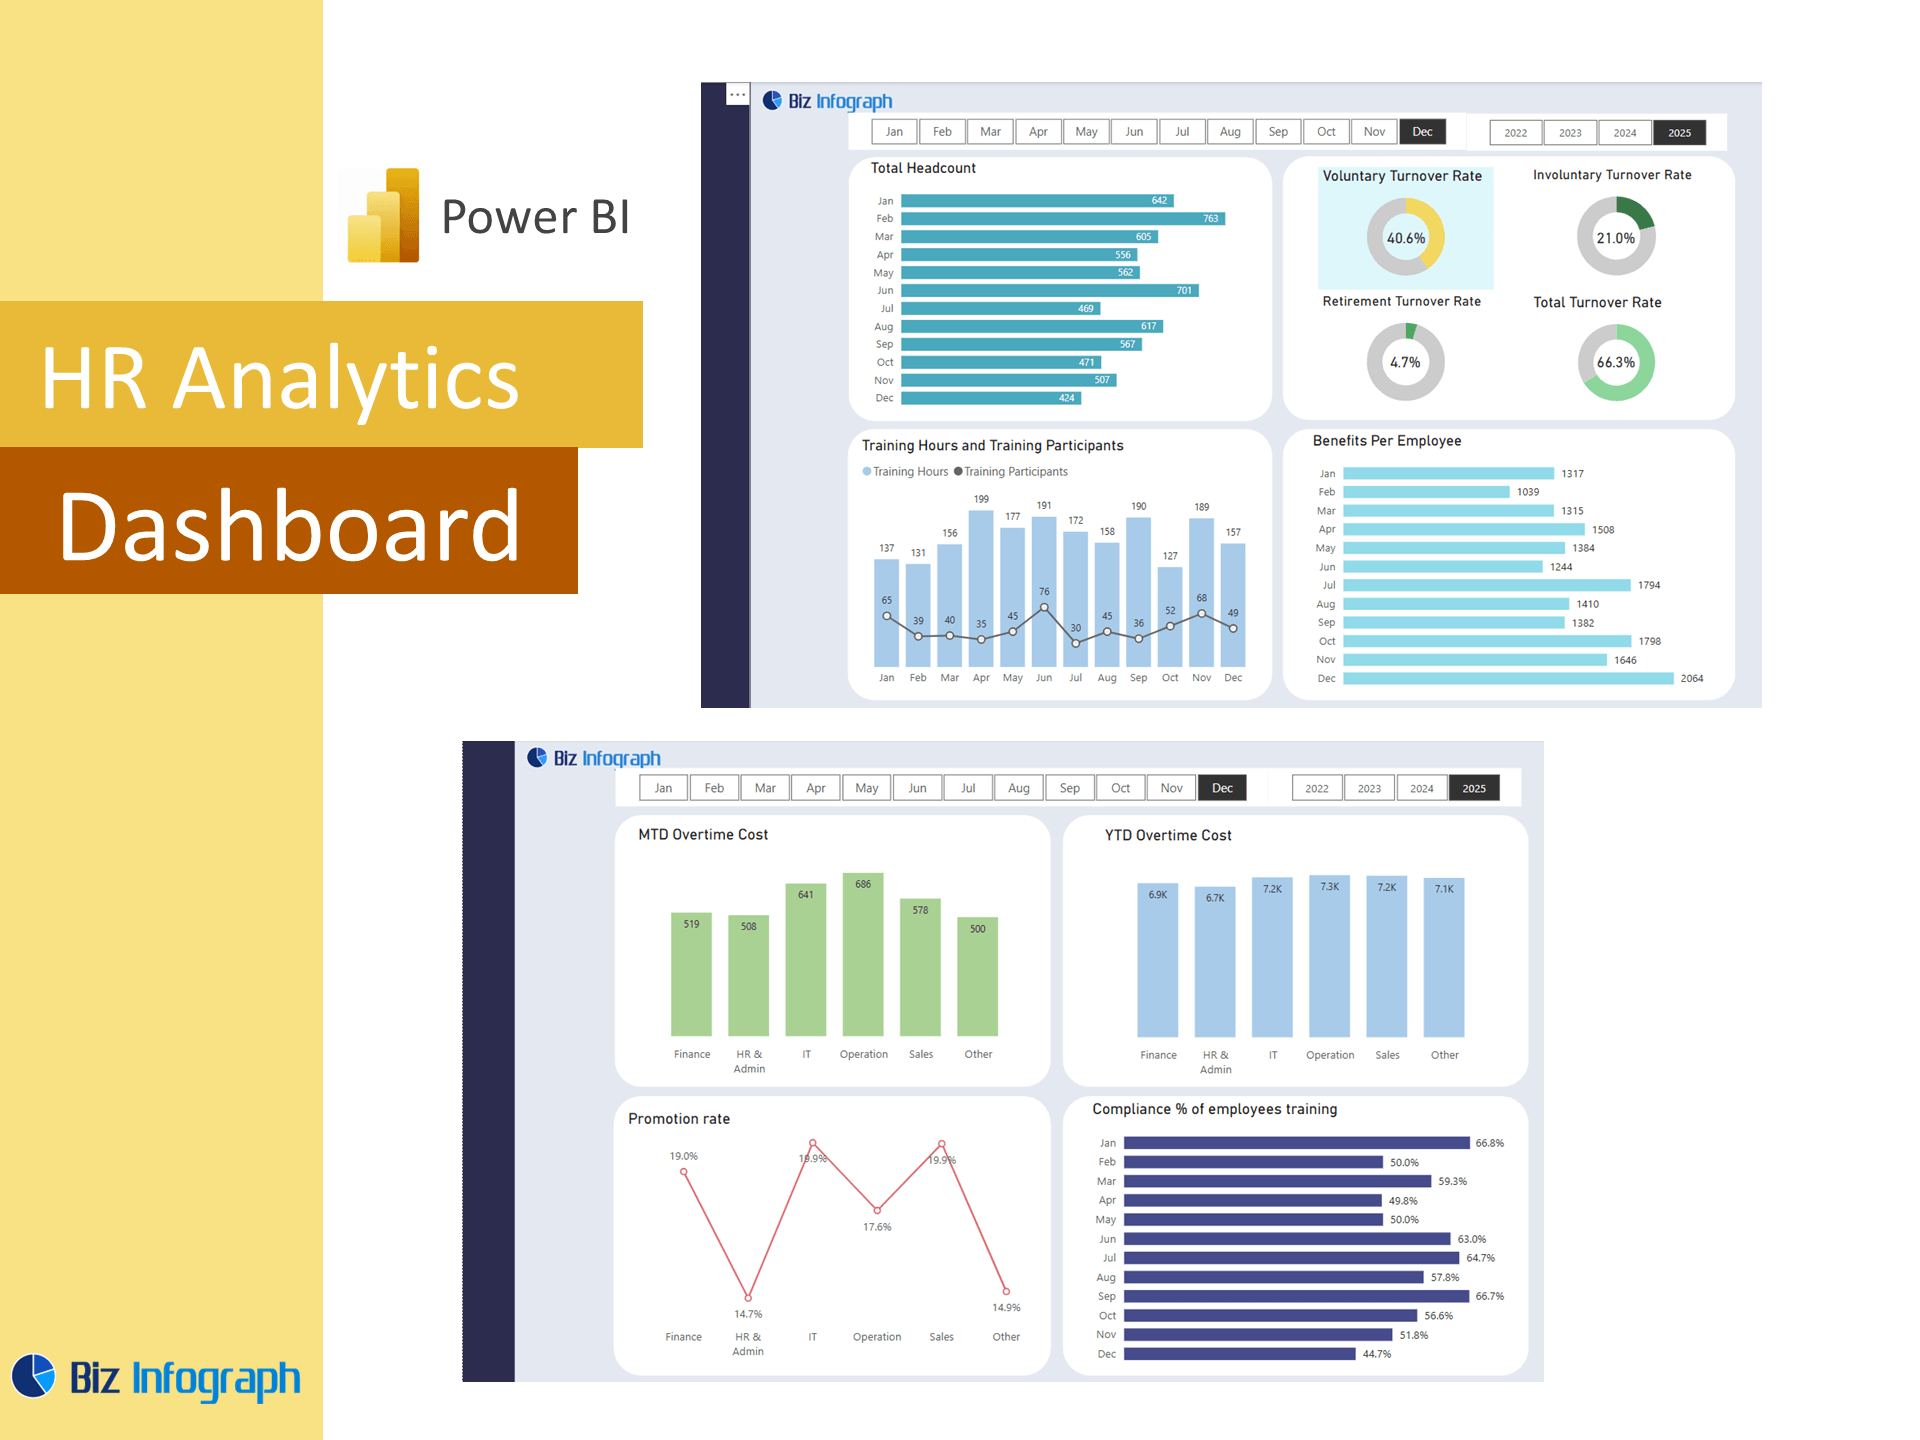
The HR Analytics Power BI dashboard delivers actionable insights to optimize workforce planning, improve employee engagement, and support strategic decision-making with clear, data-driven, and actionable metrics.
For ready-to-use Dashboard Templates: