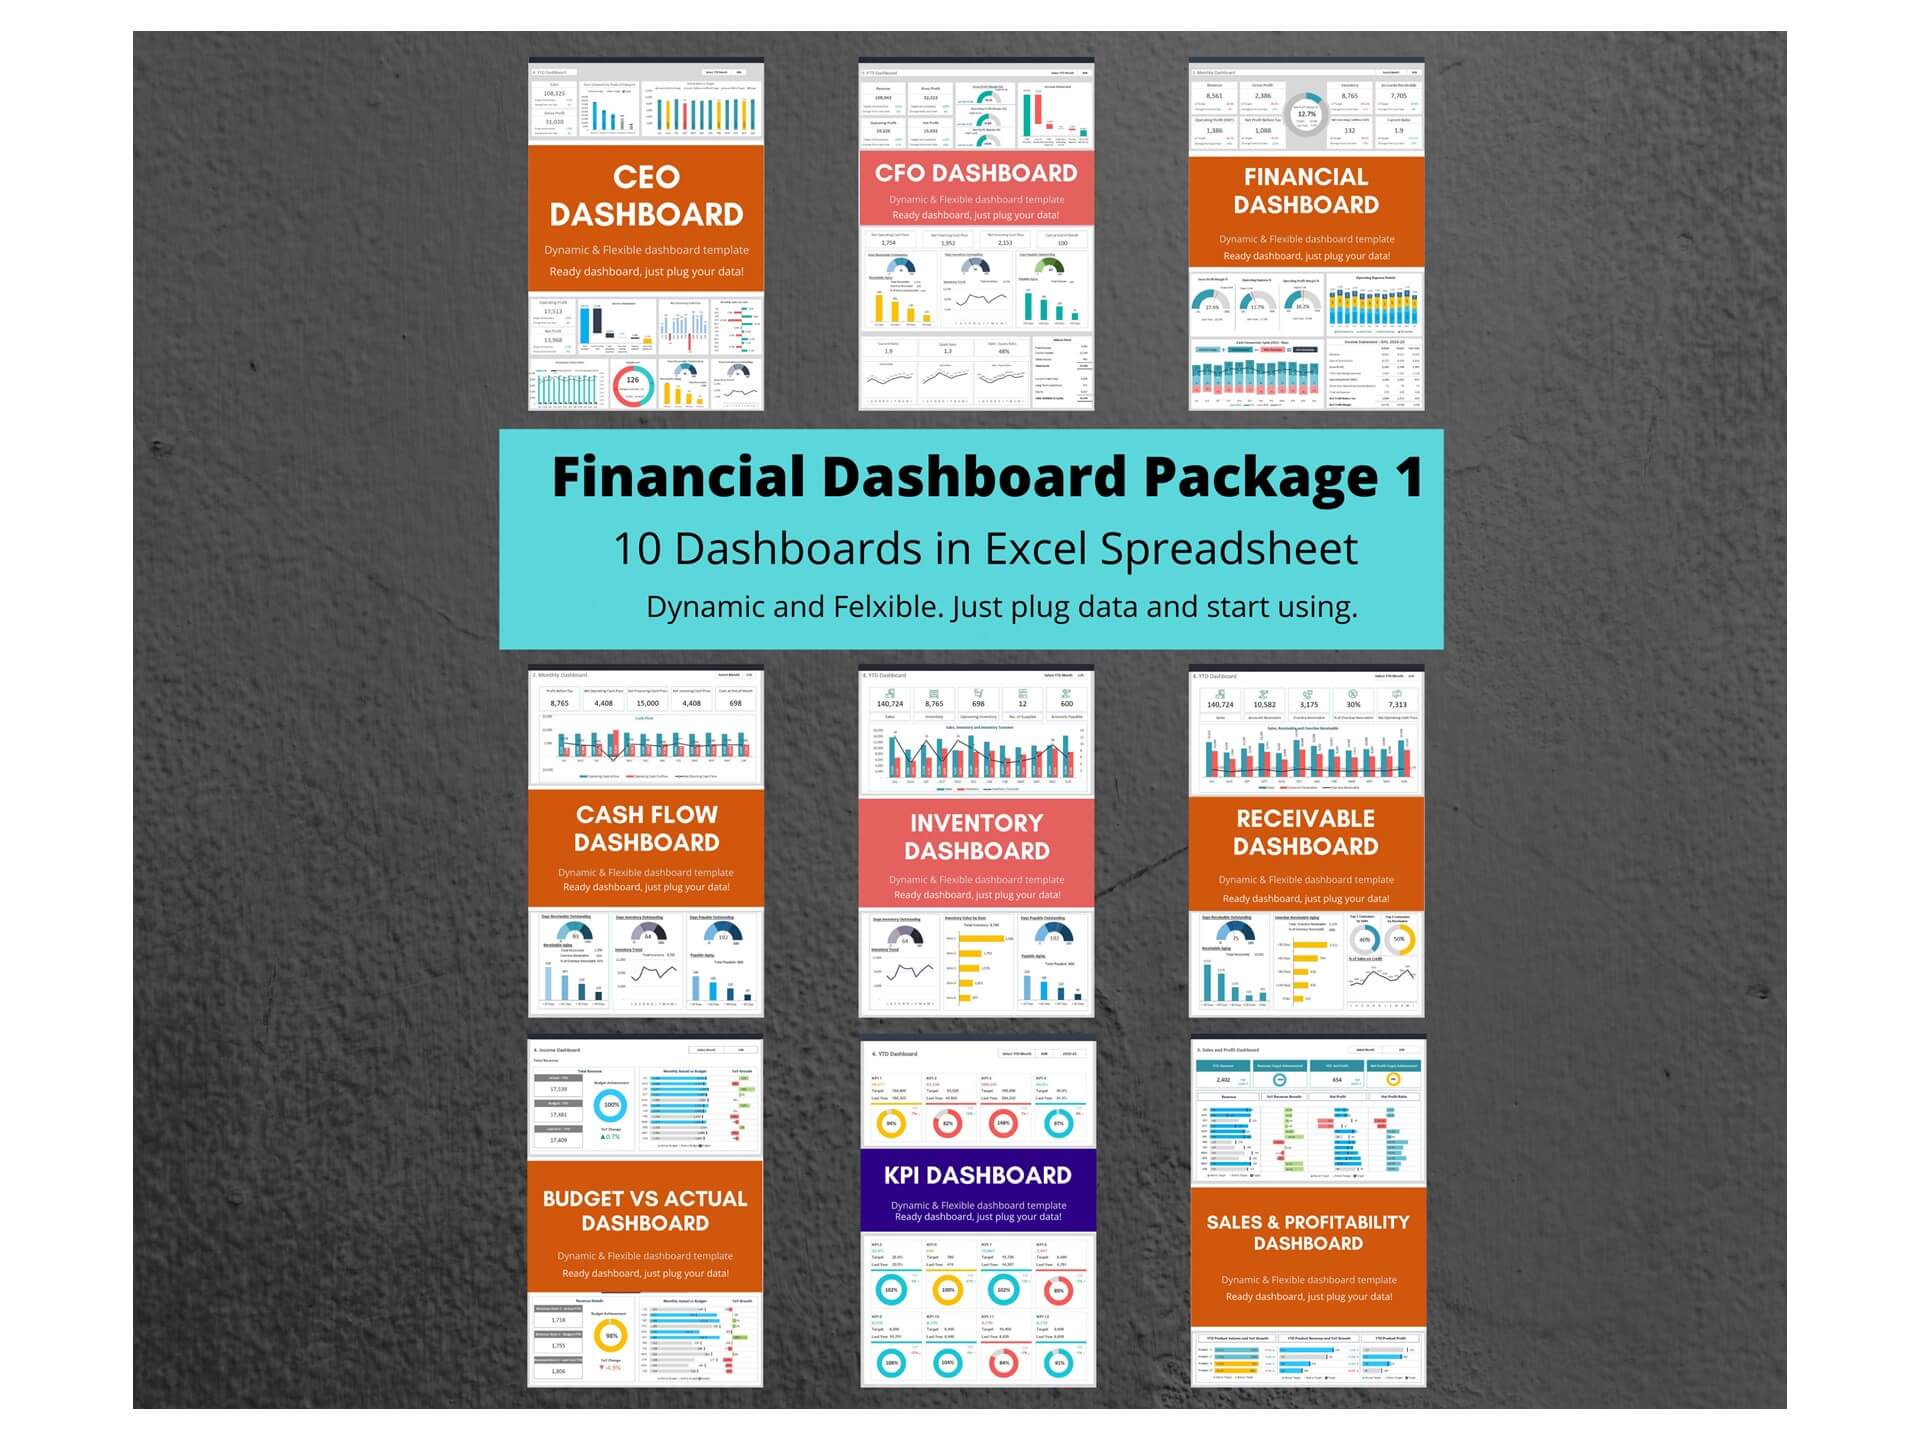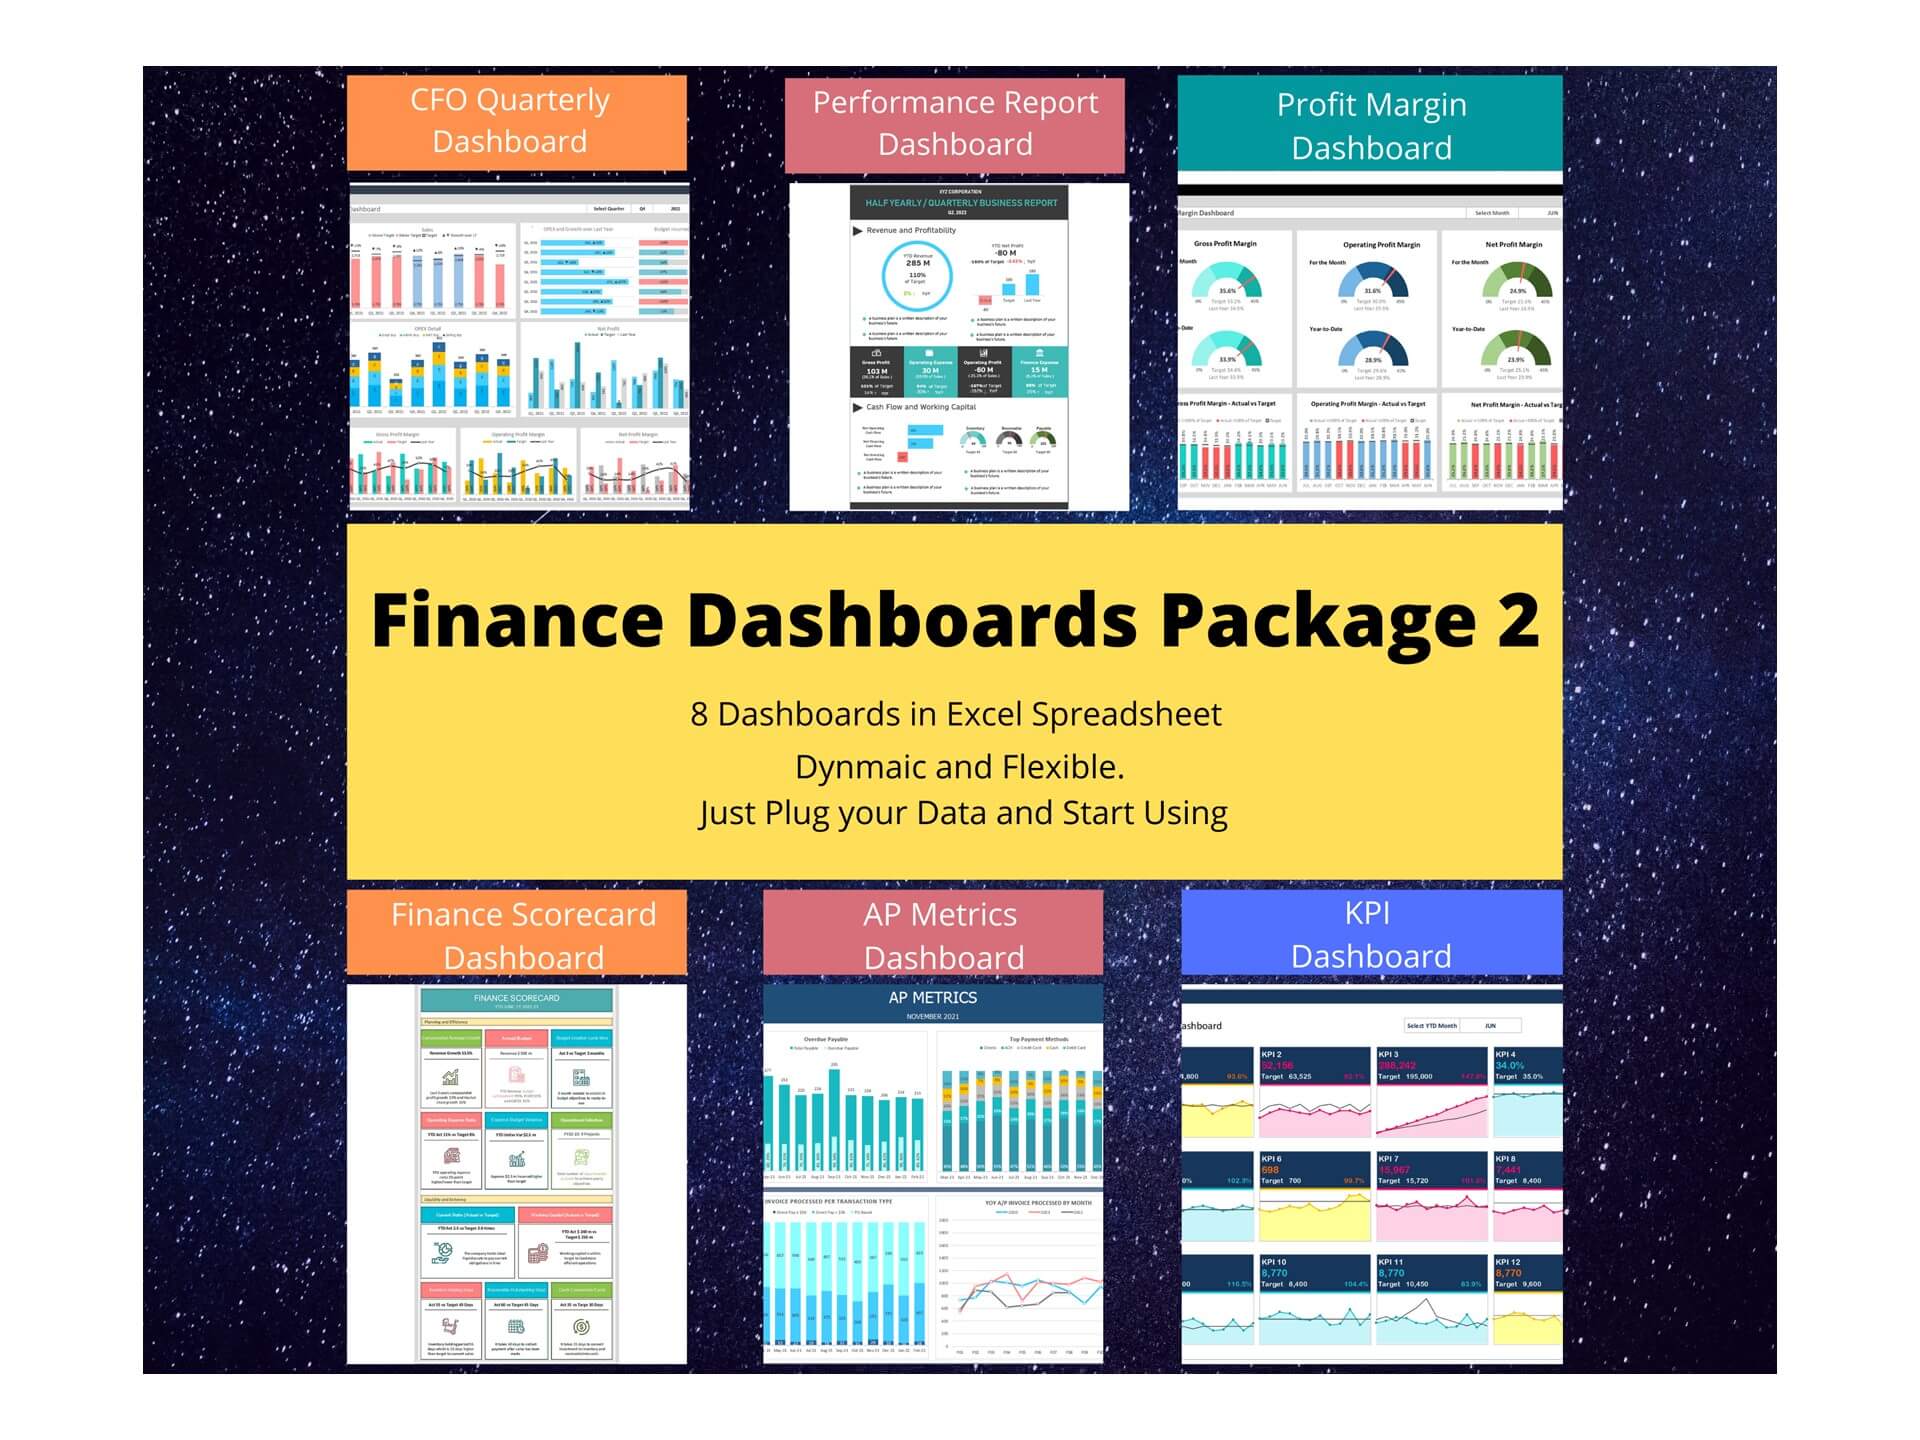
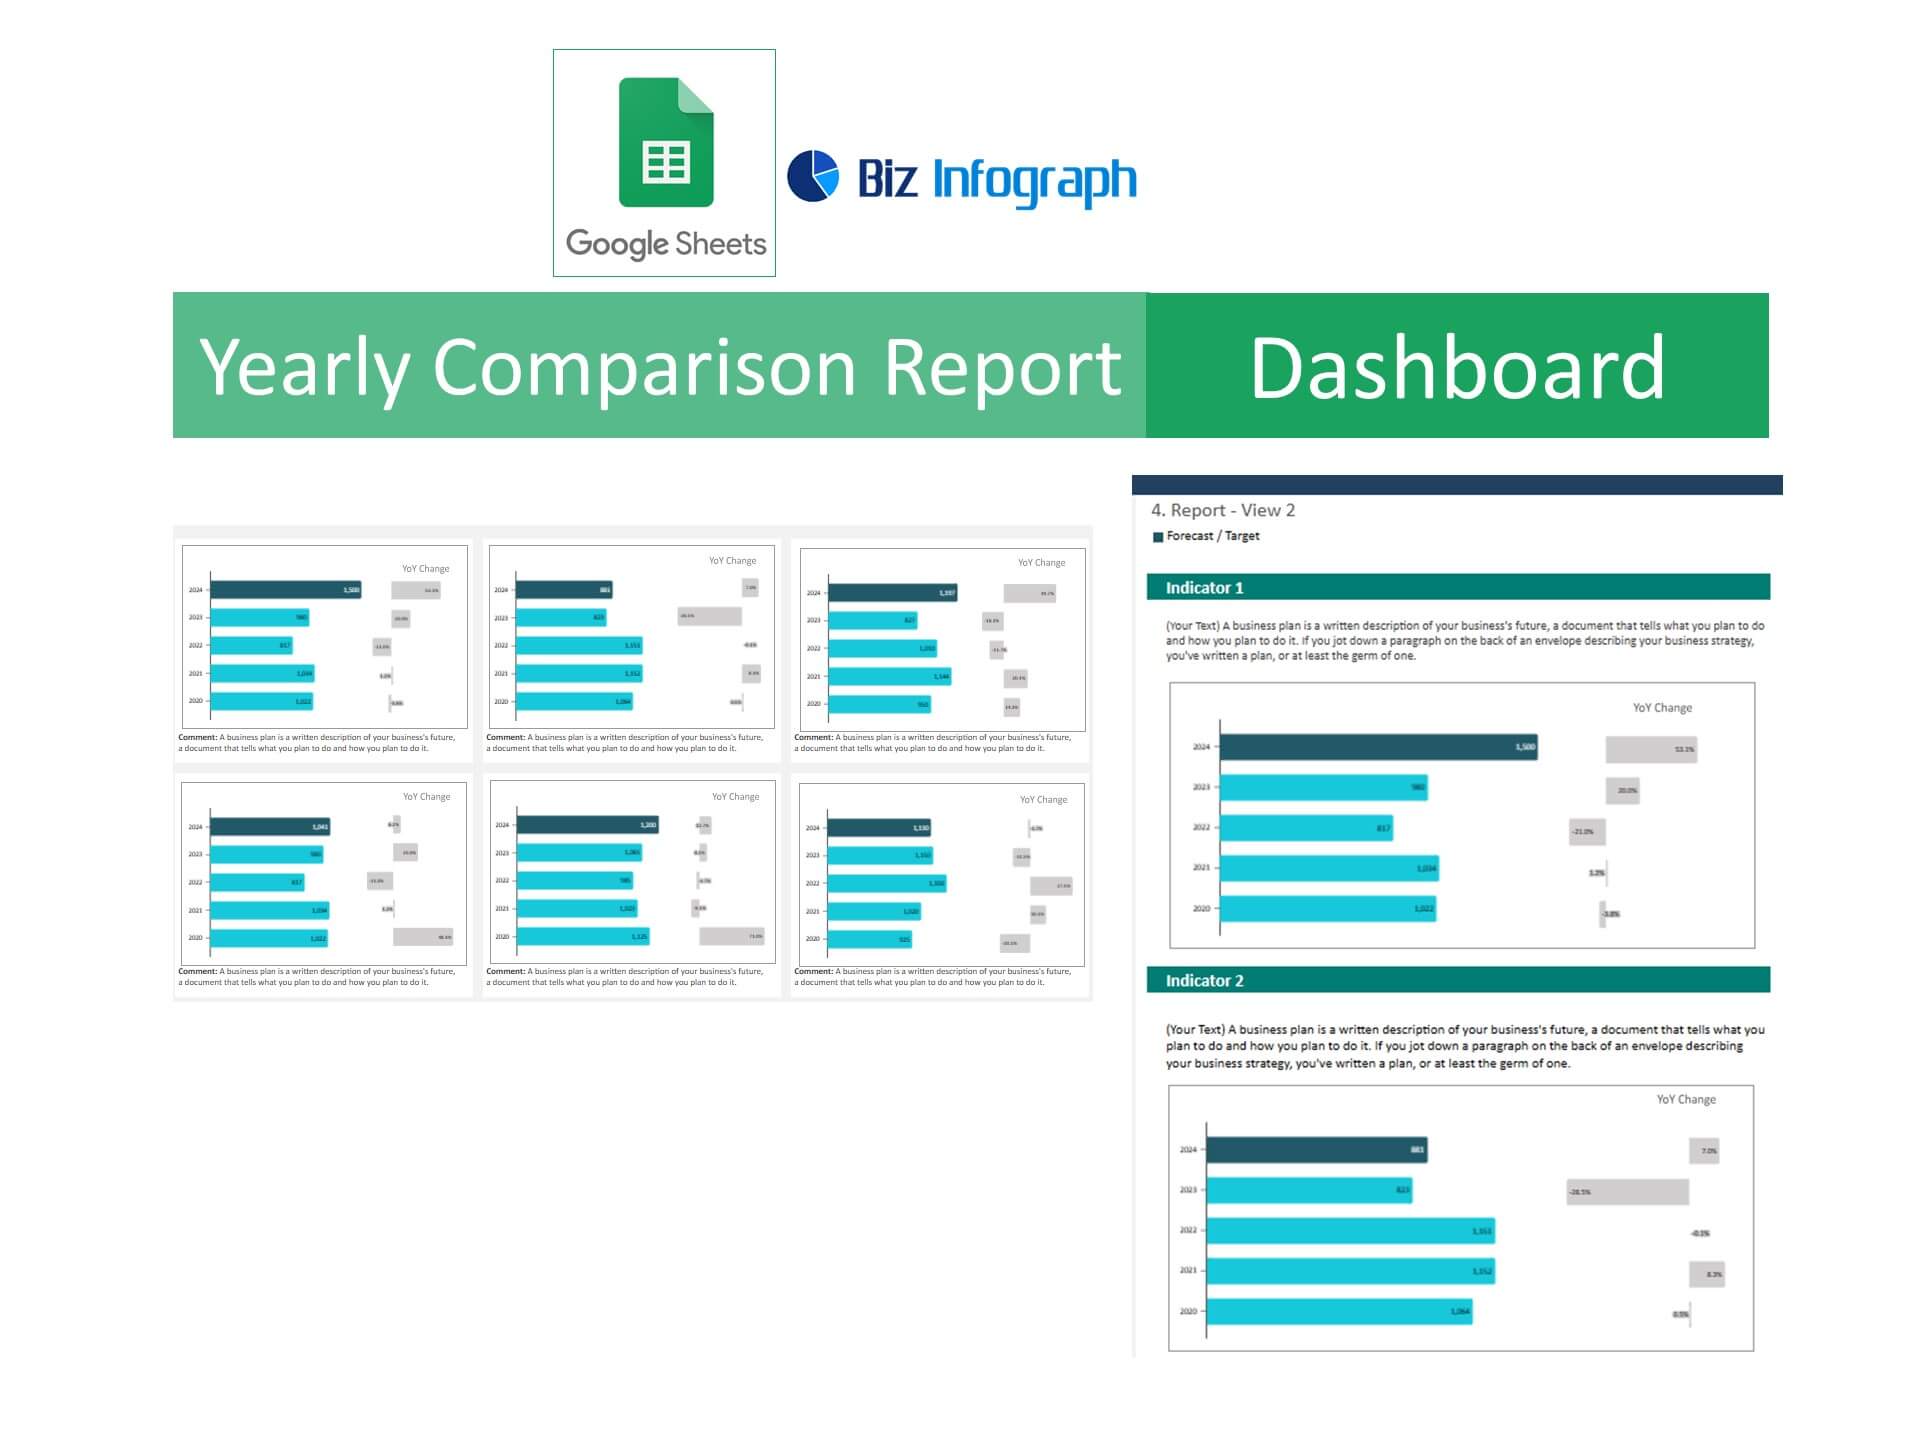
Yearly Comparison Report Template is designed for you to compare key performance indicators over a 5-year period, including a forecast year. Use this spreadsheet template to turn old reports into visually appealing documents that people will actually read. Impress your colleagues with your organization and communicate with them more effectively.
Key Features:
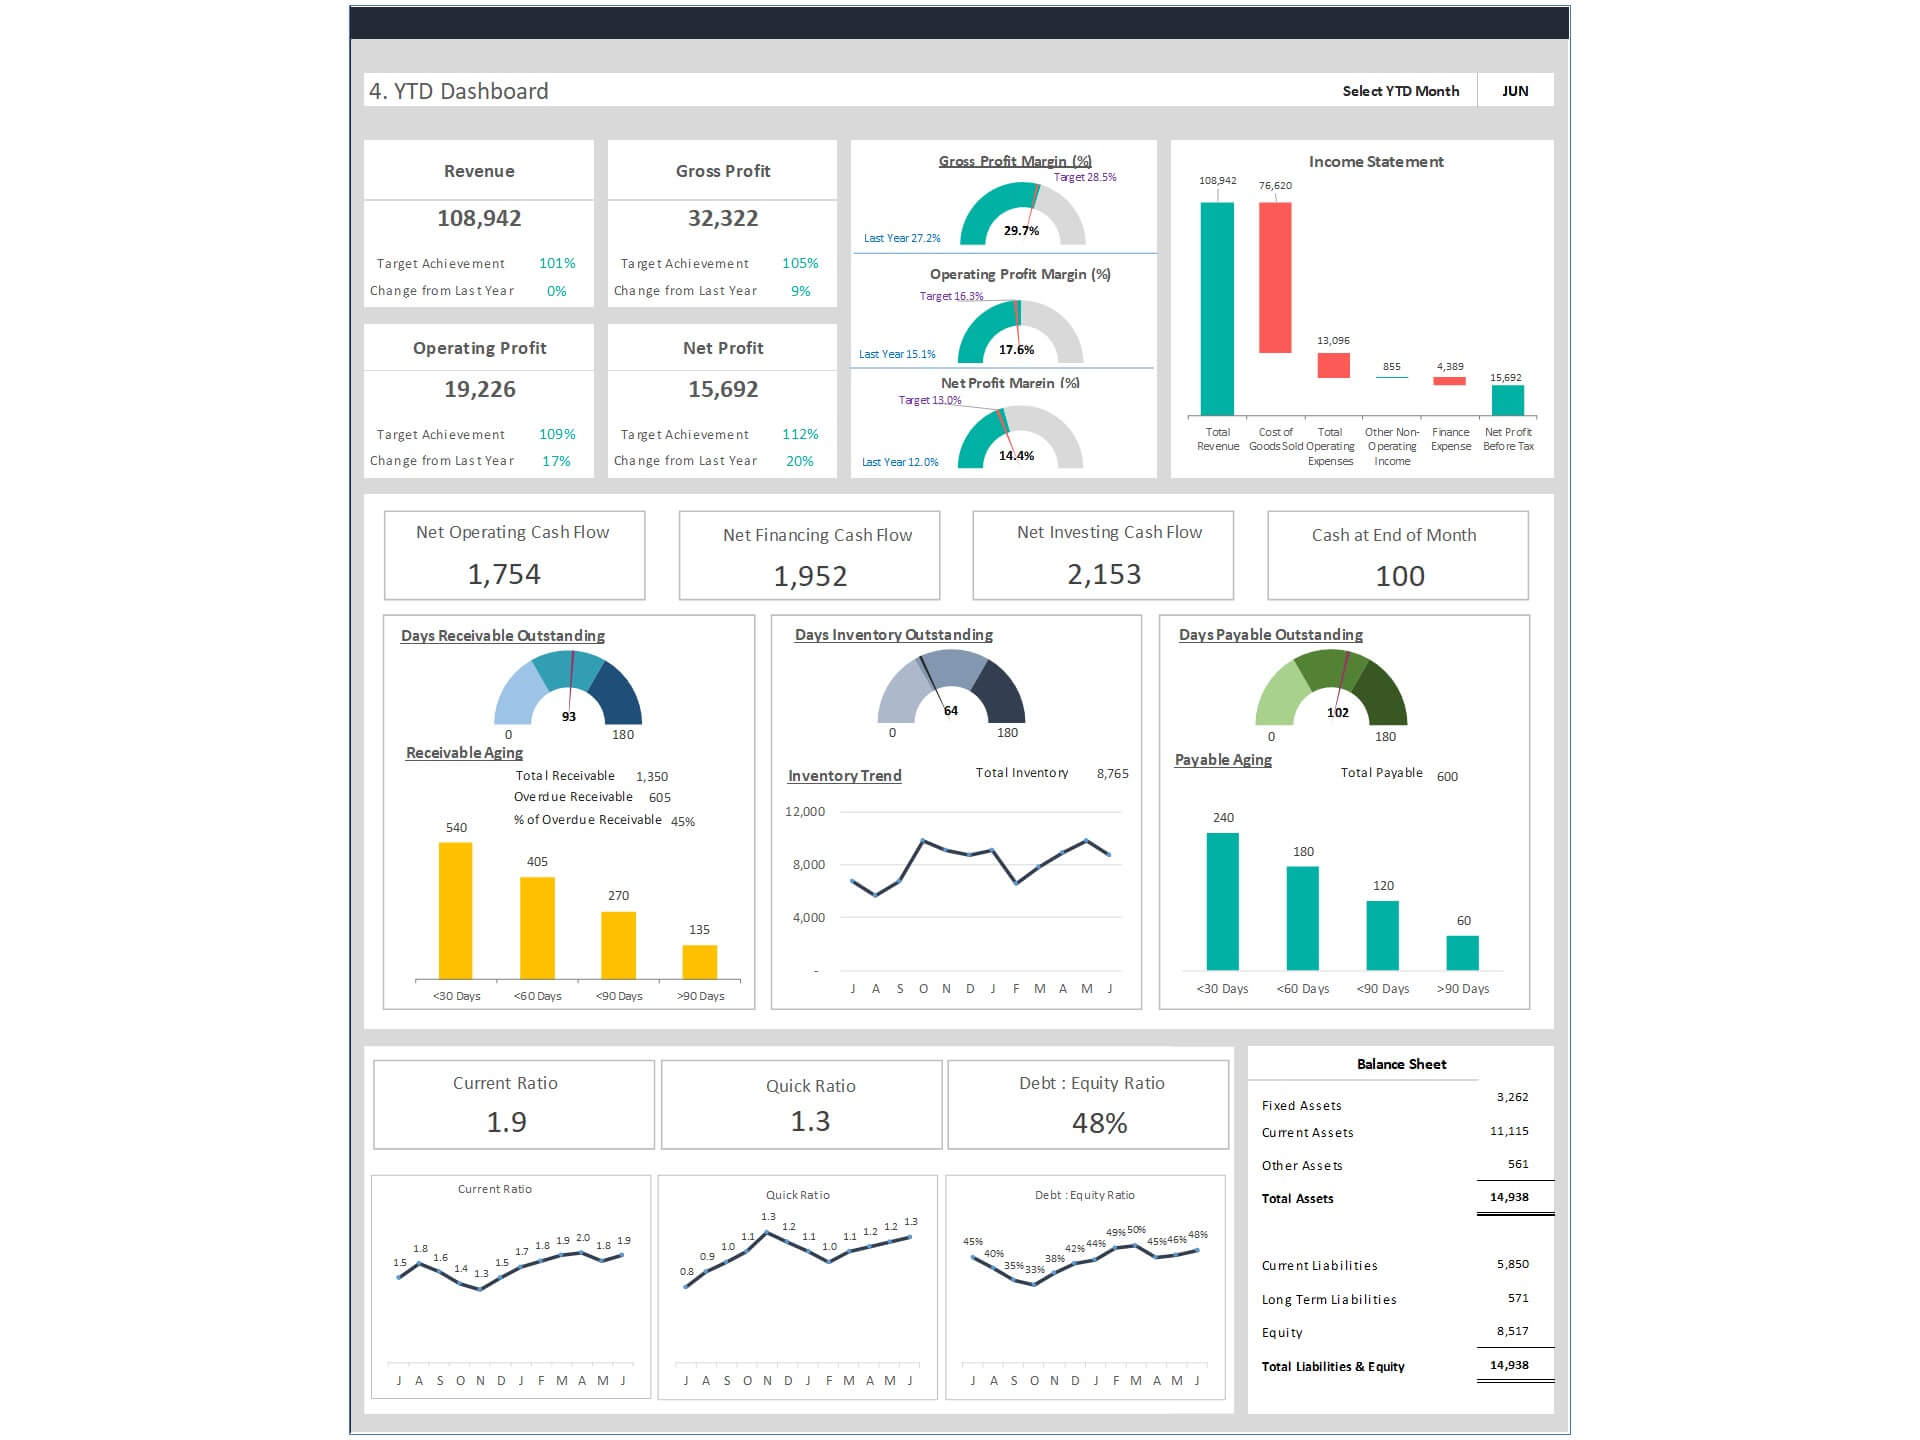
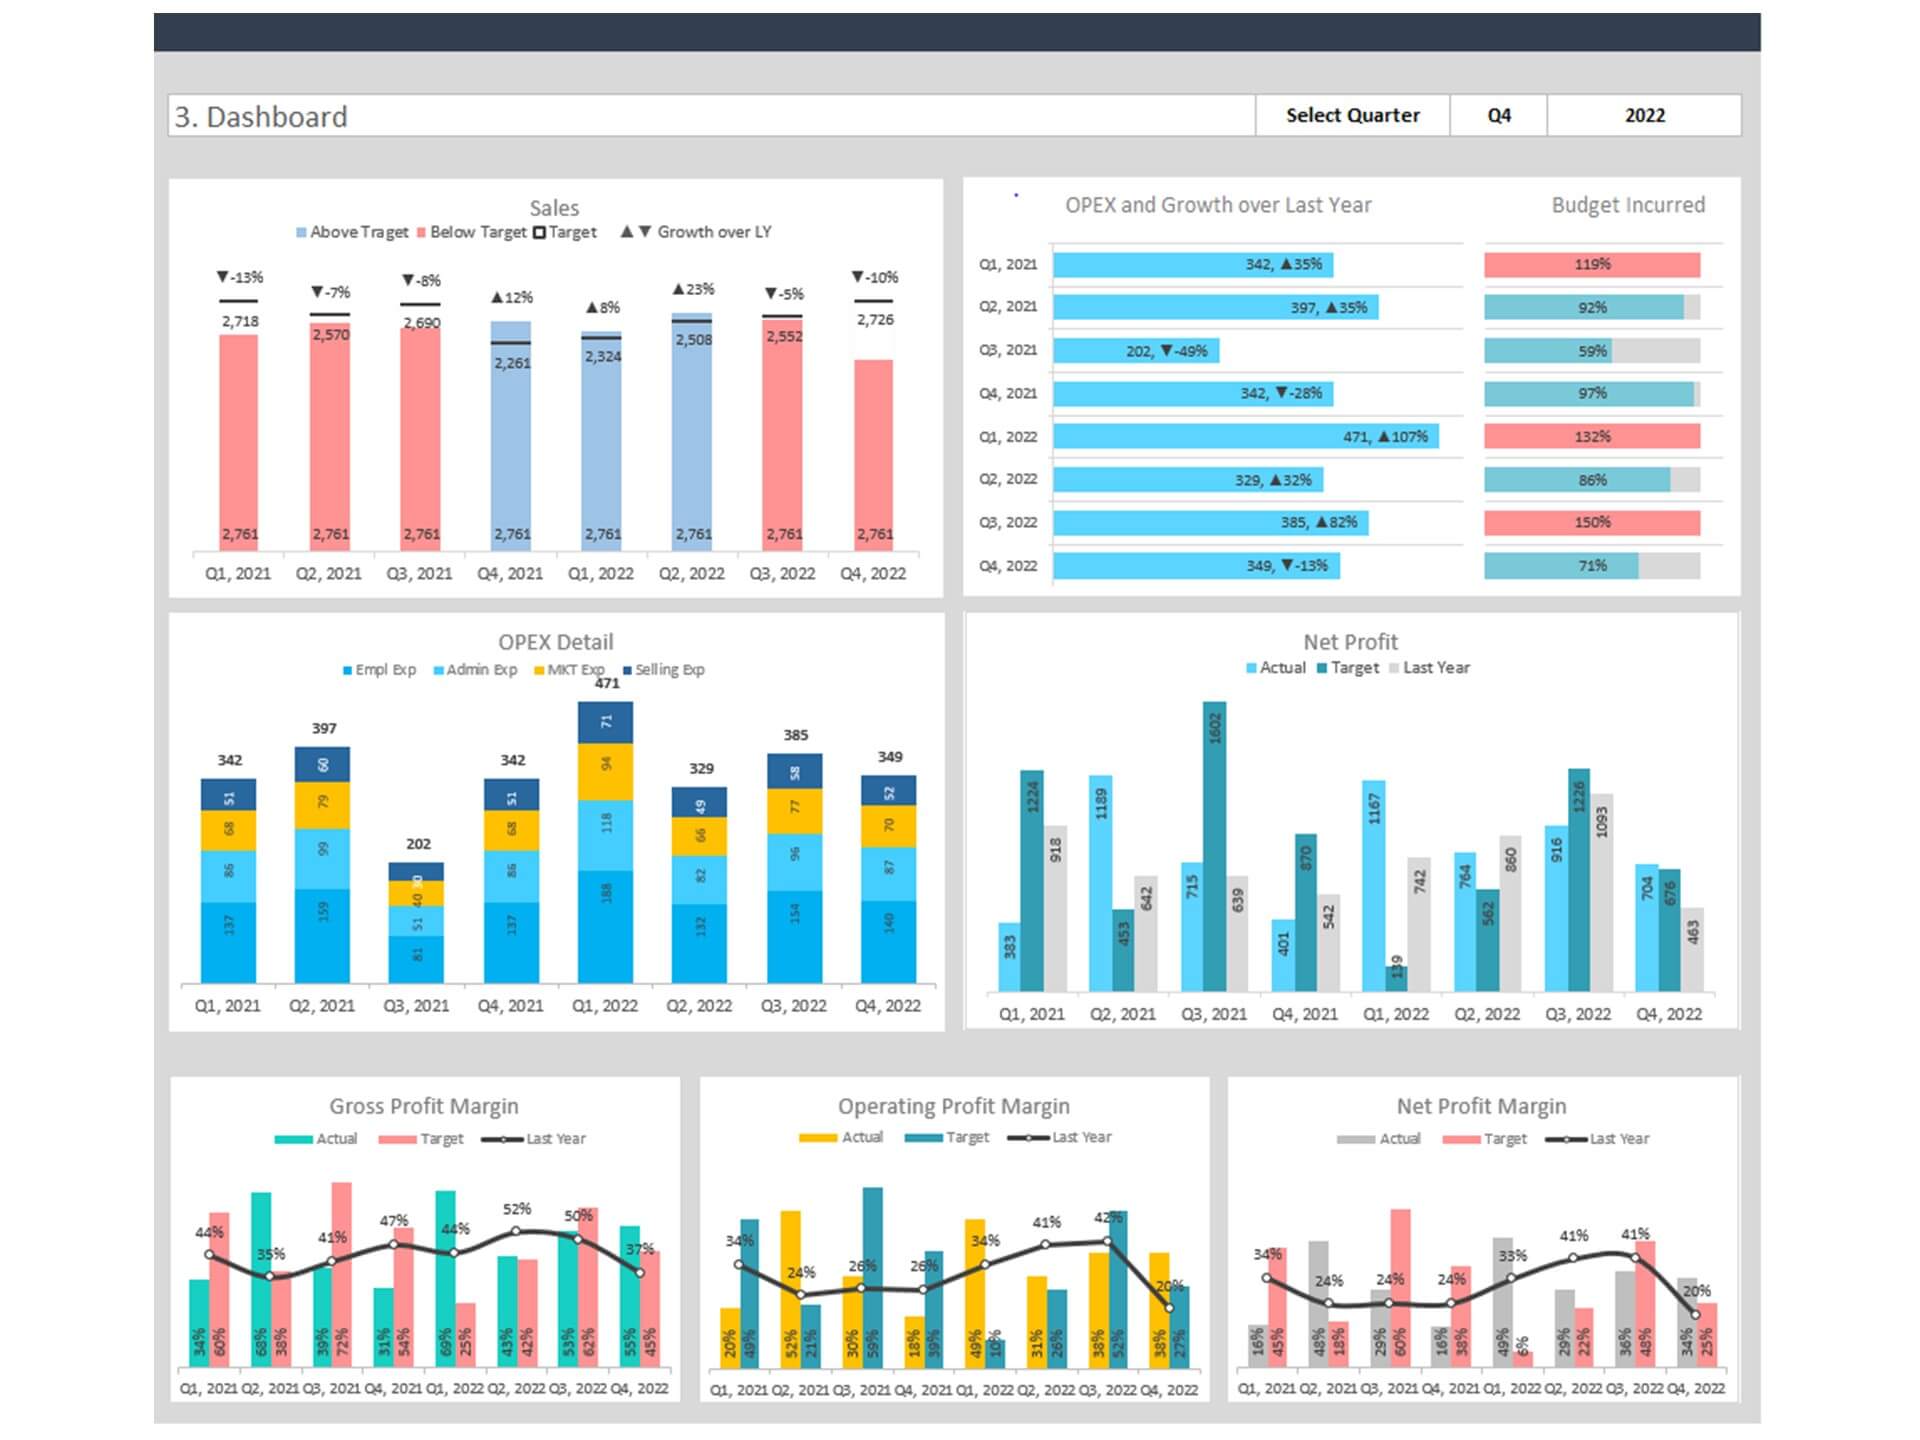
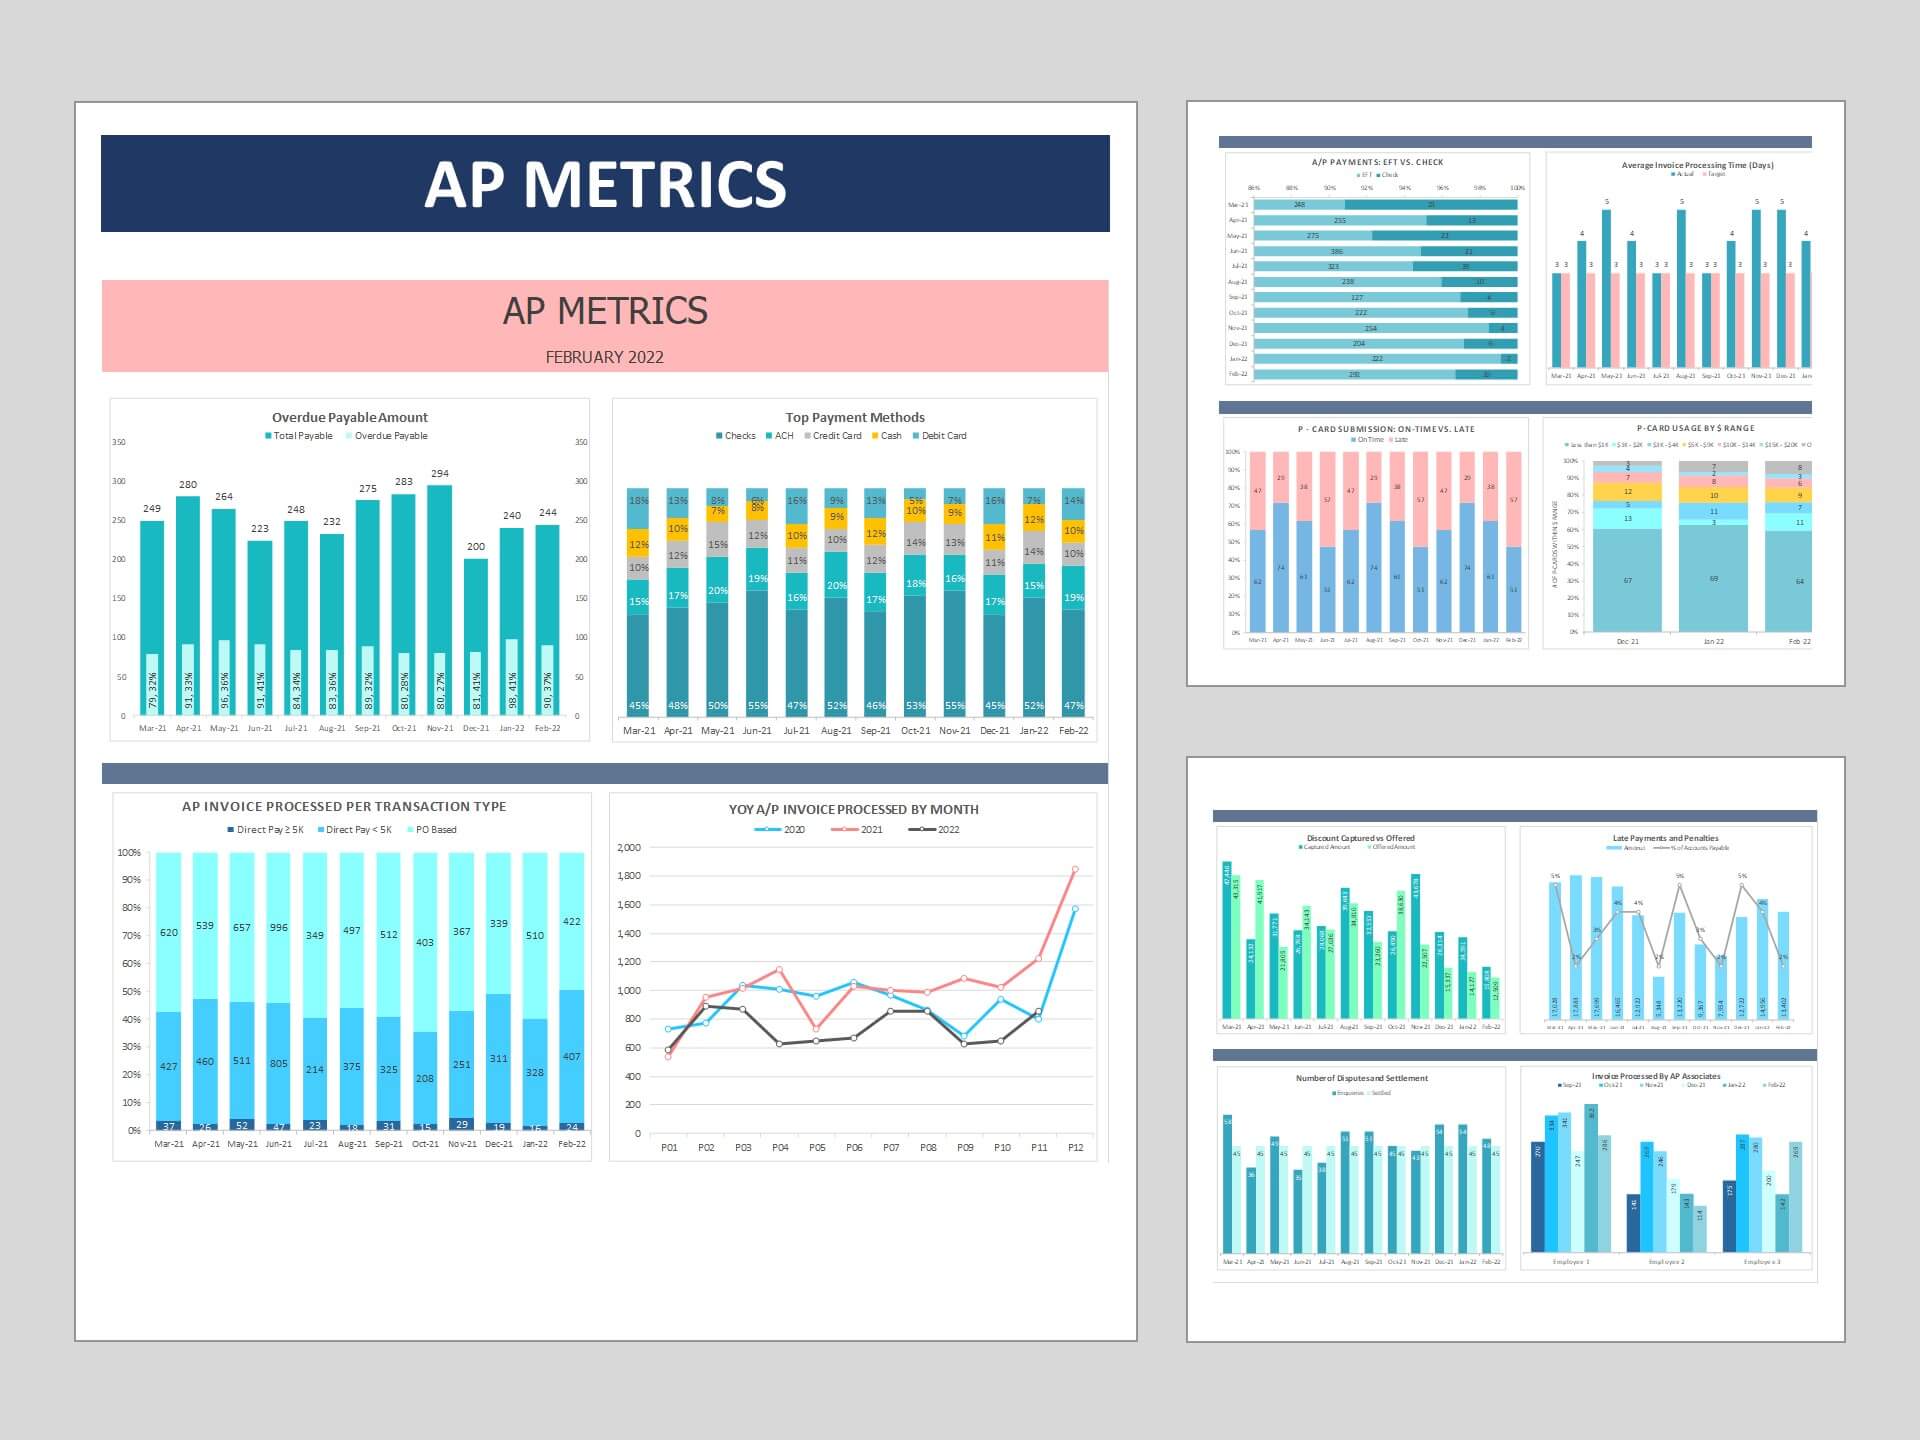
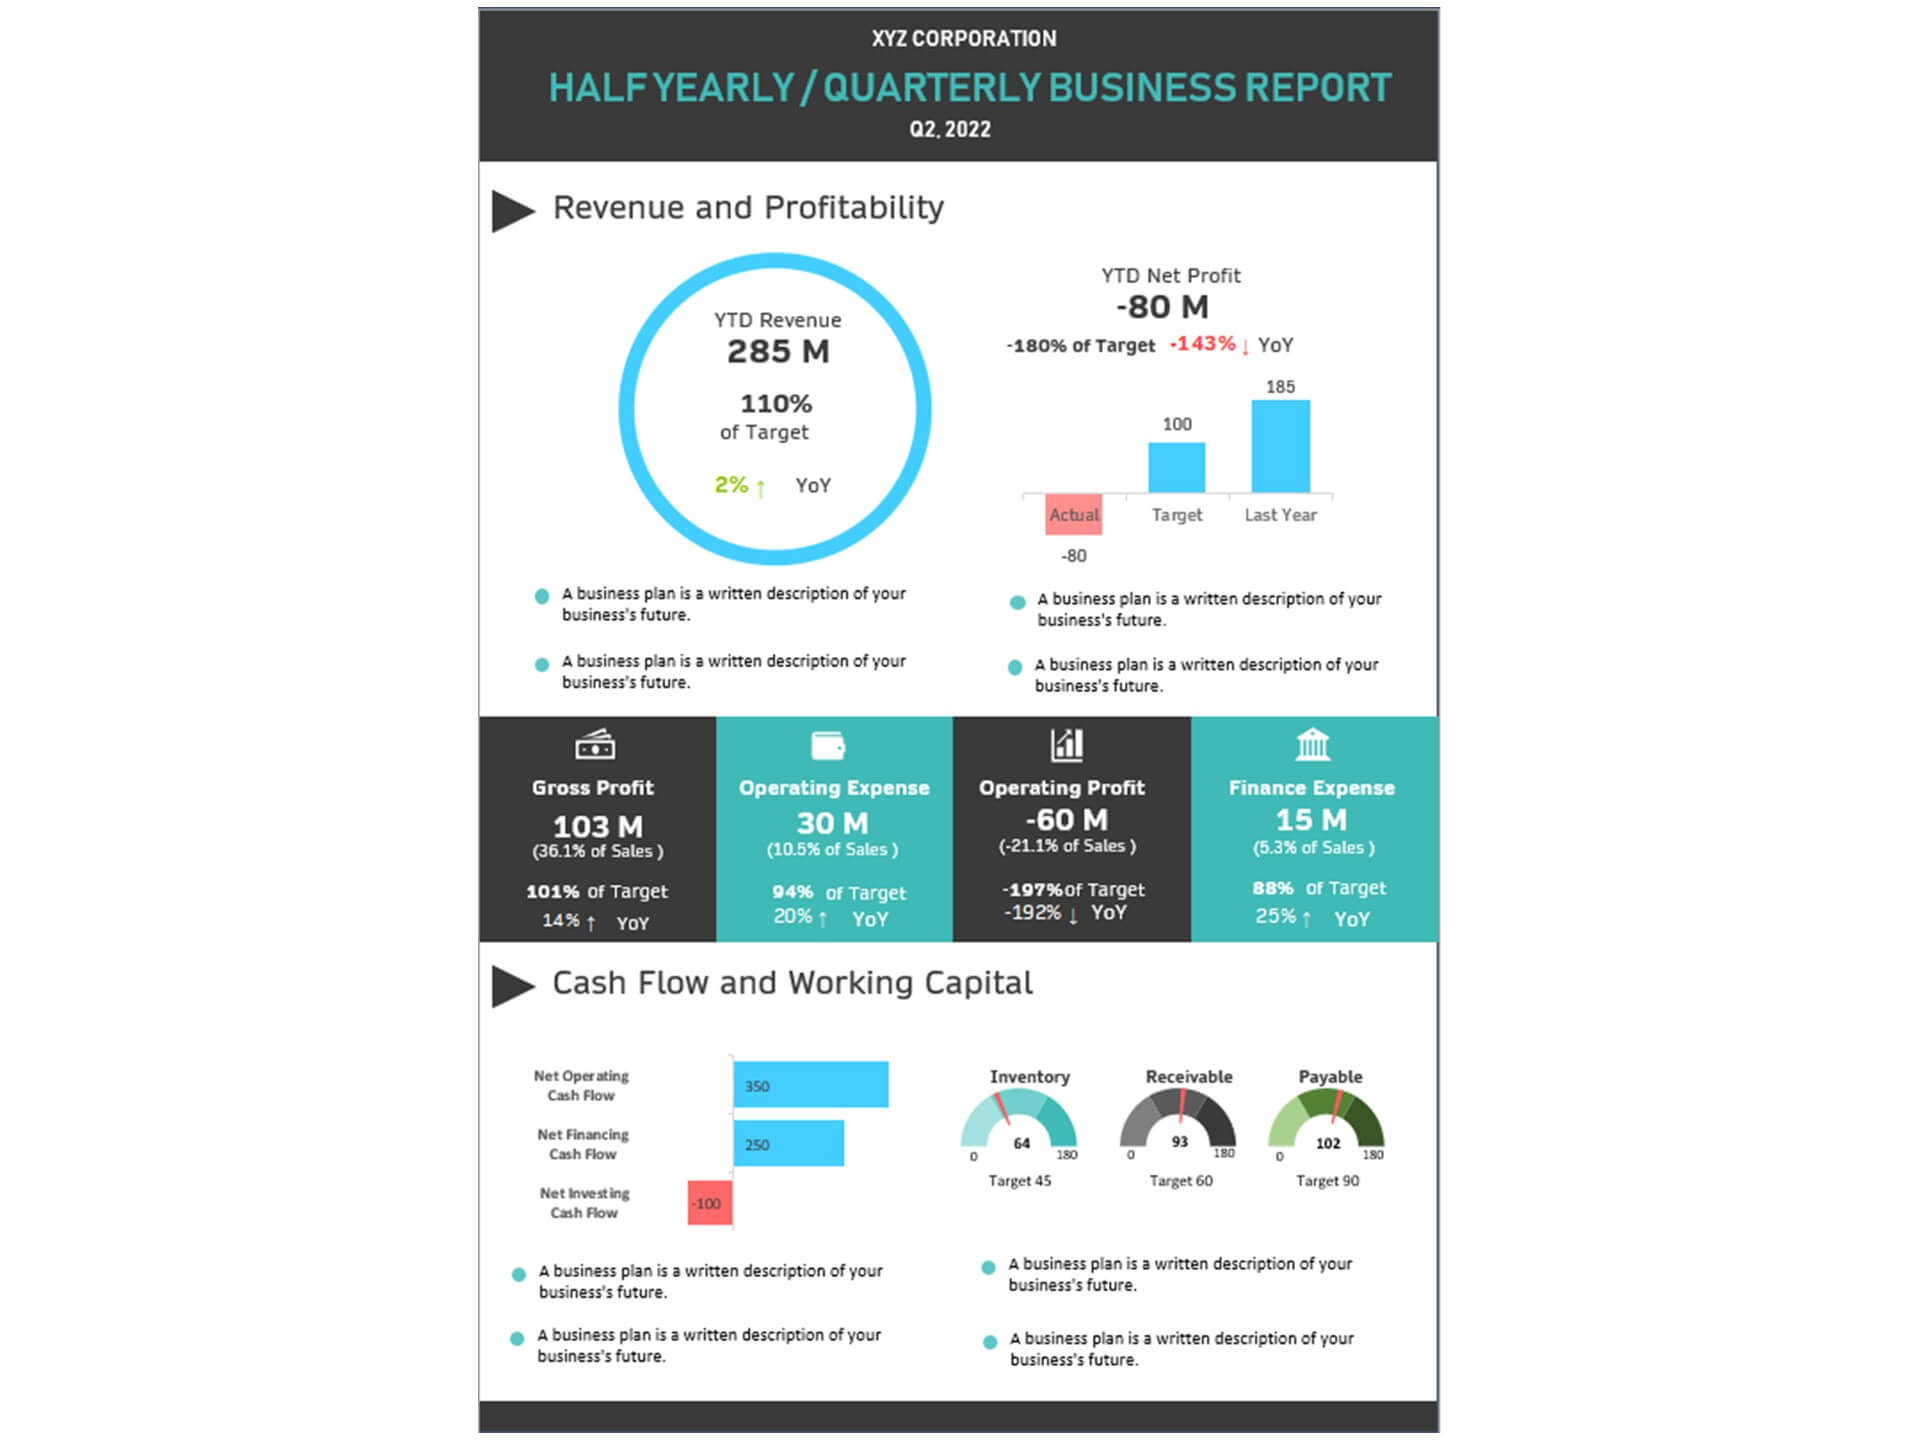
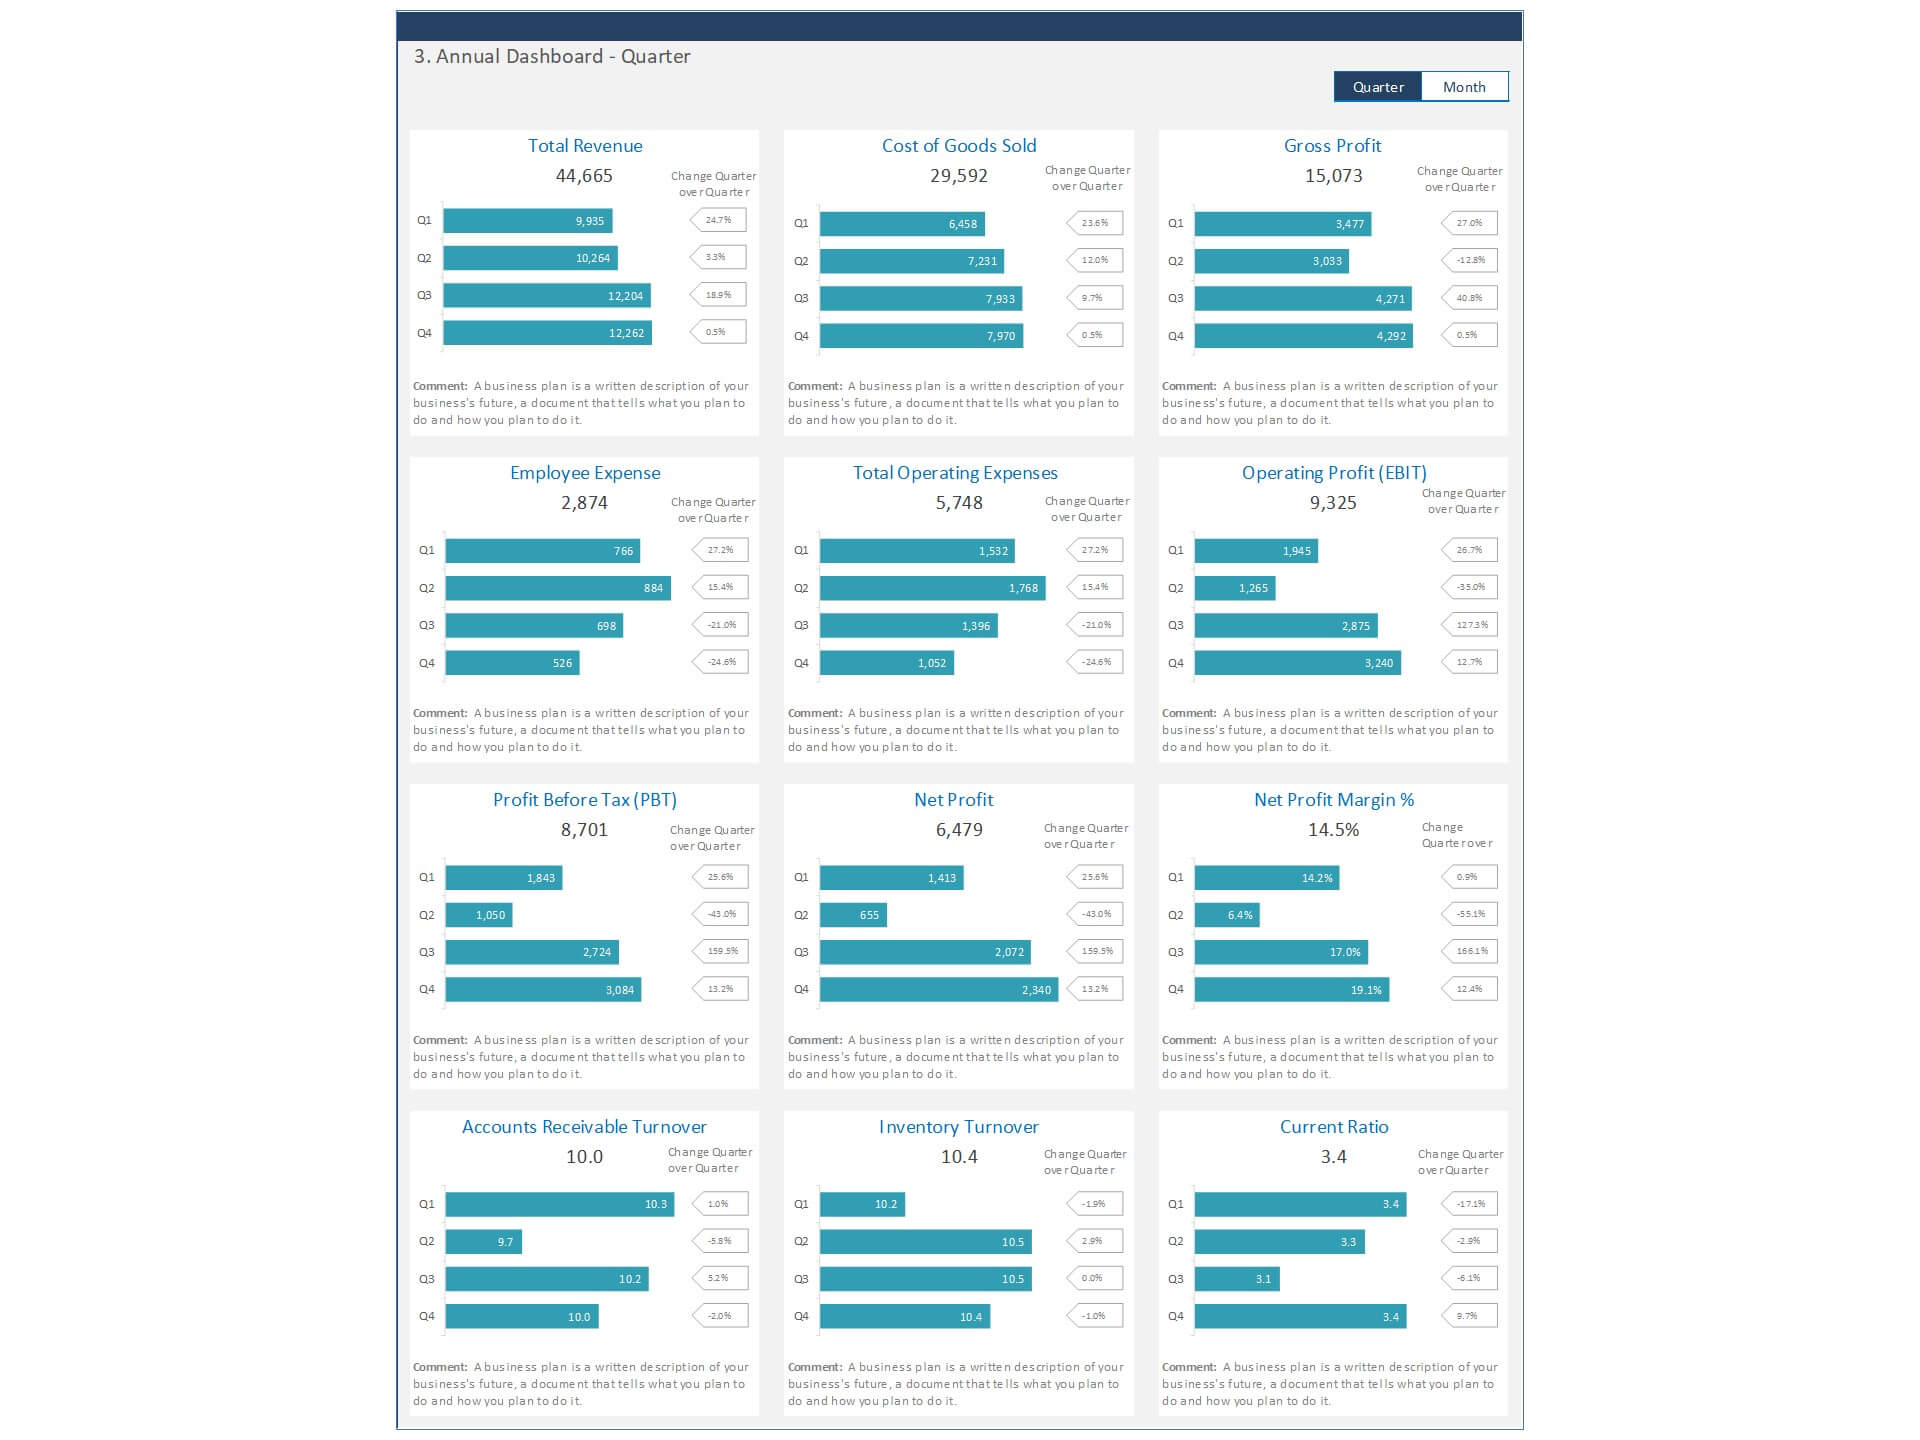
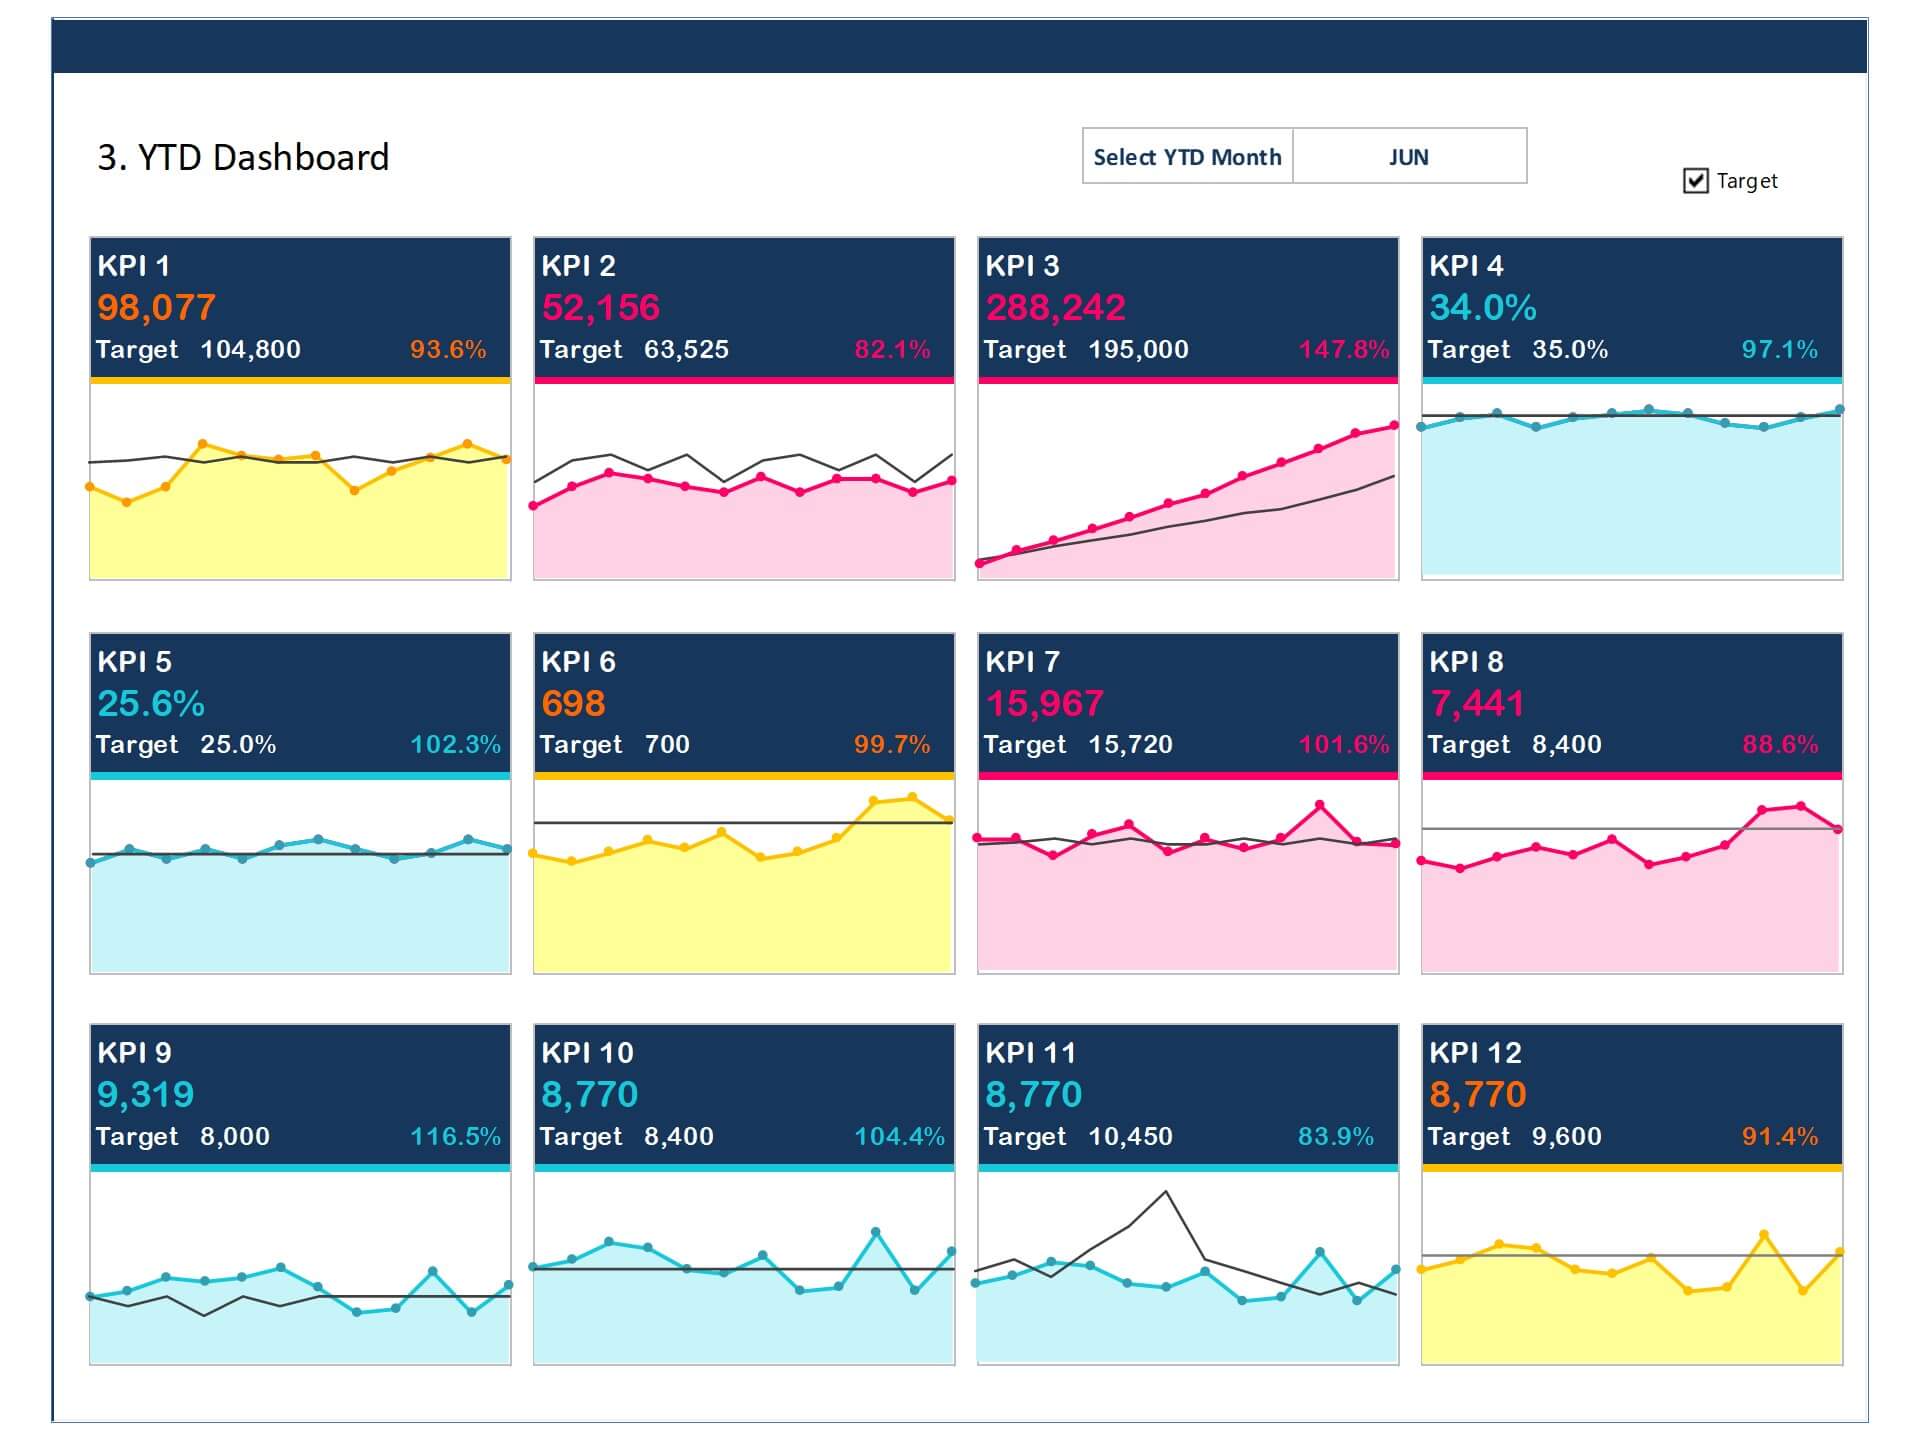
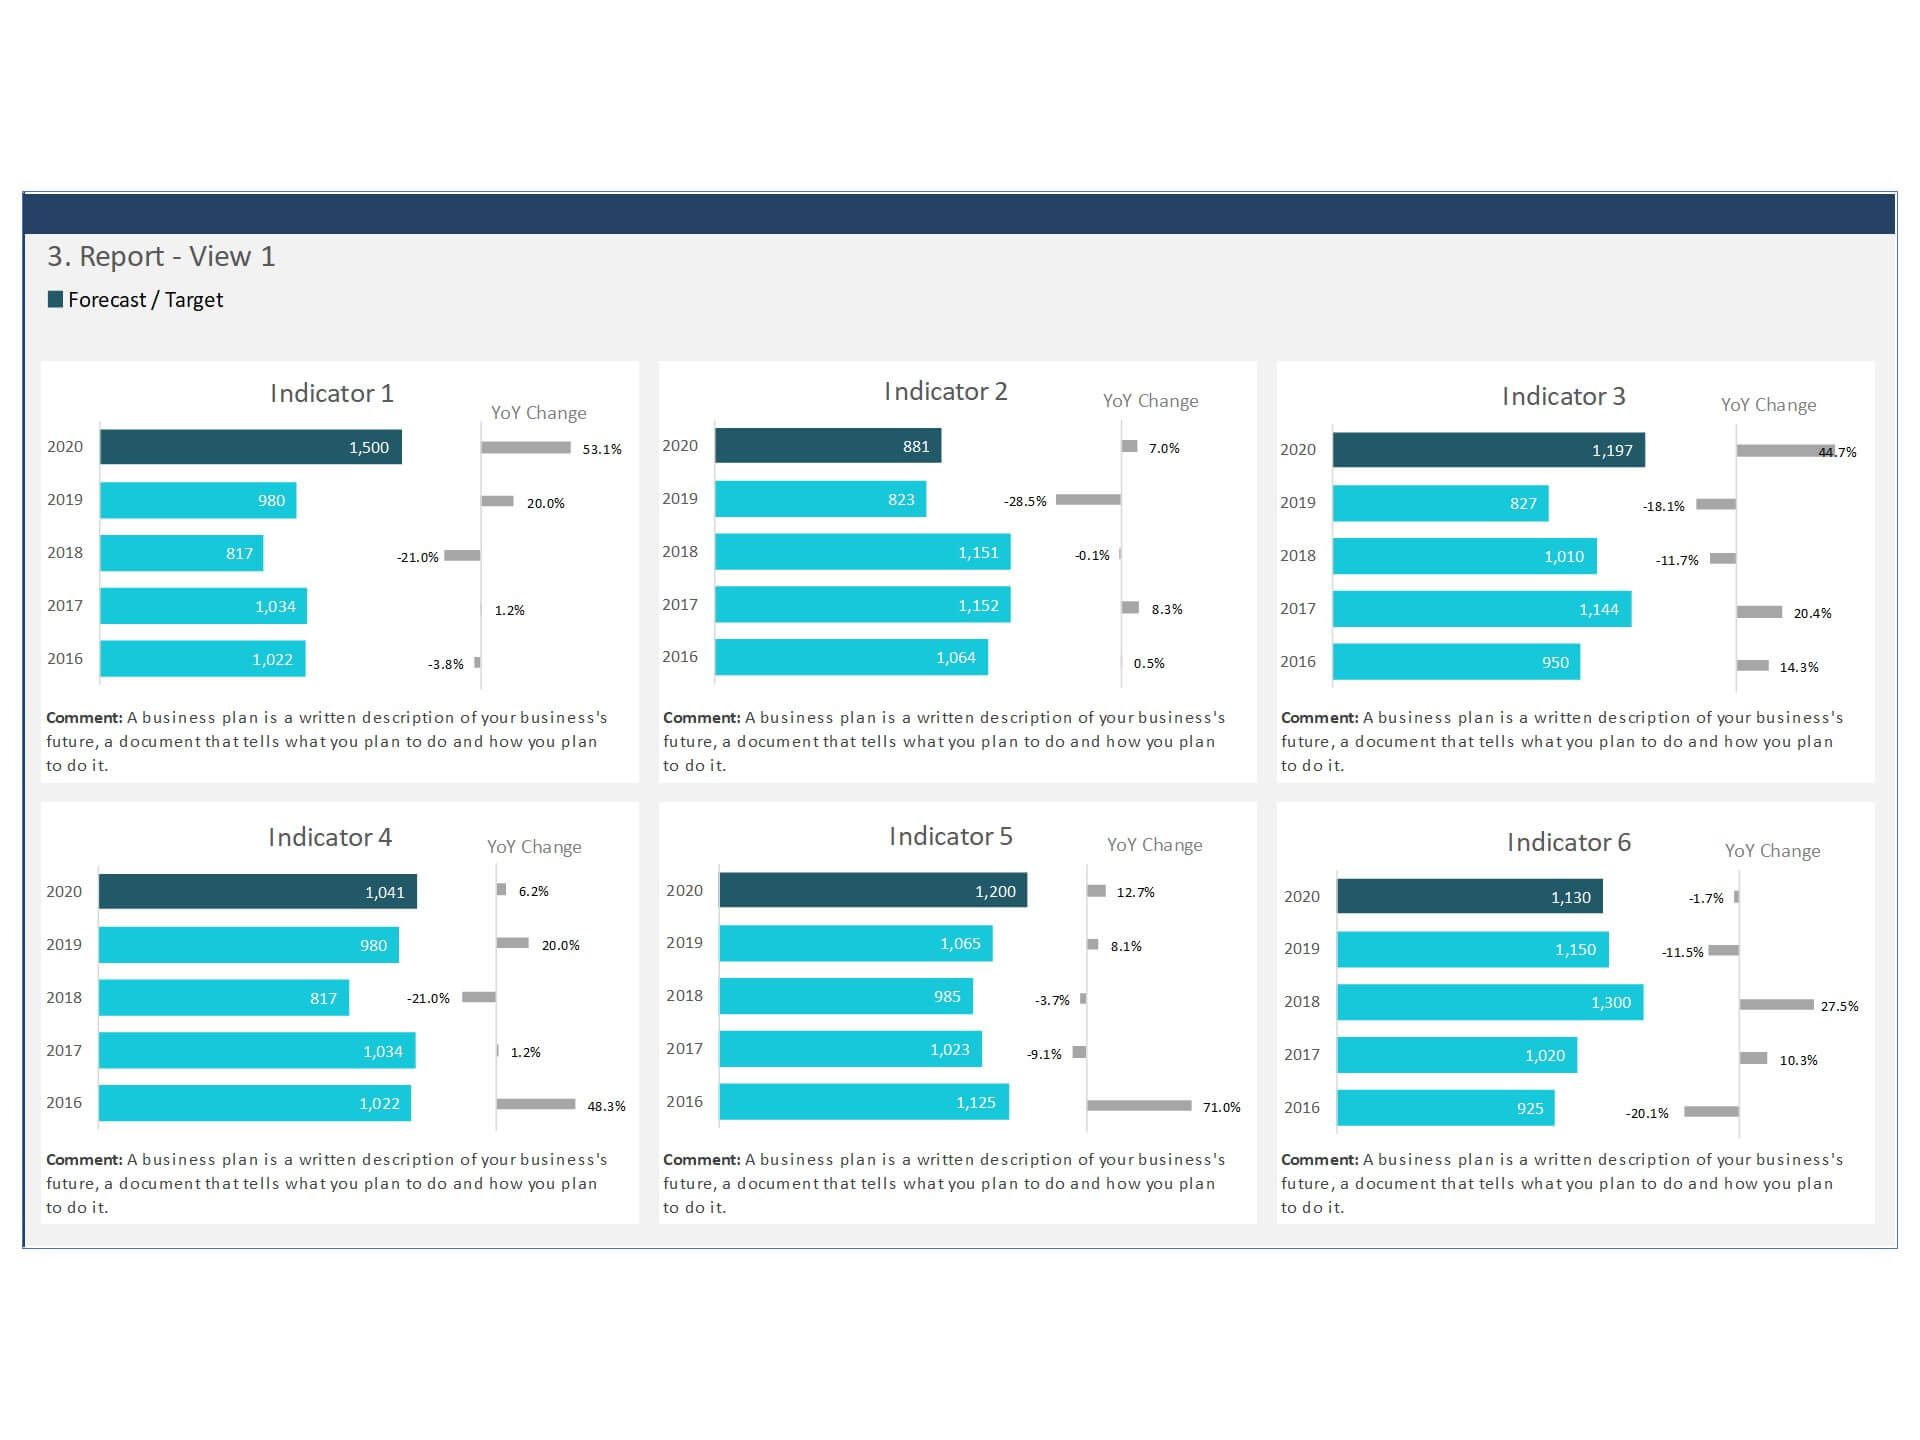
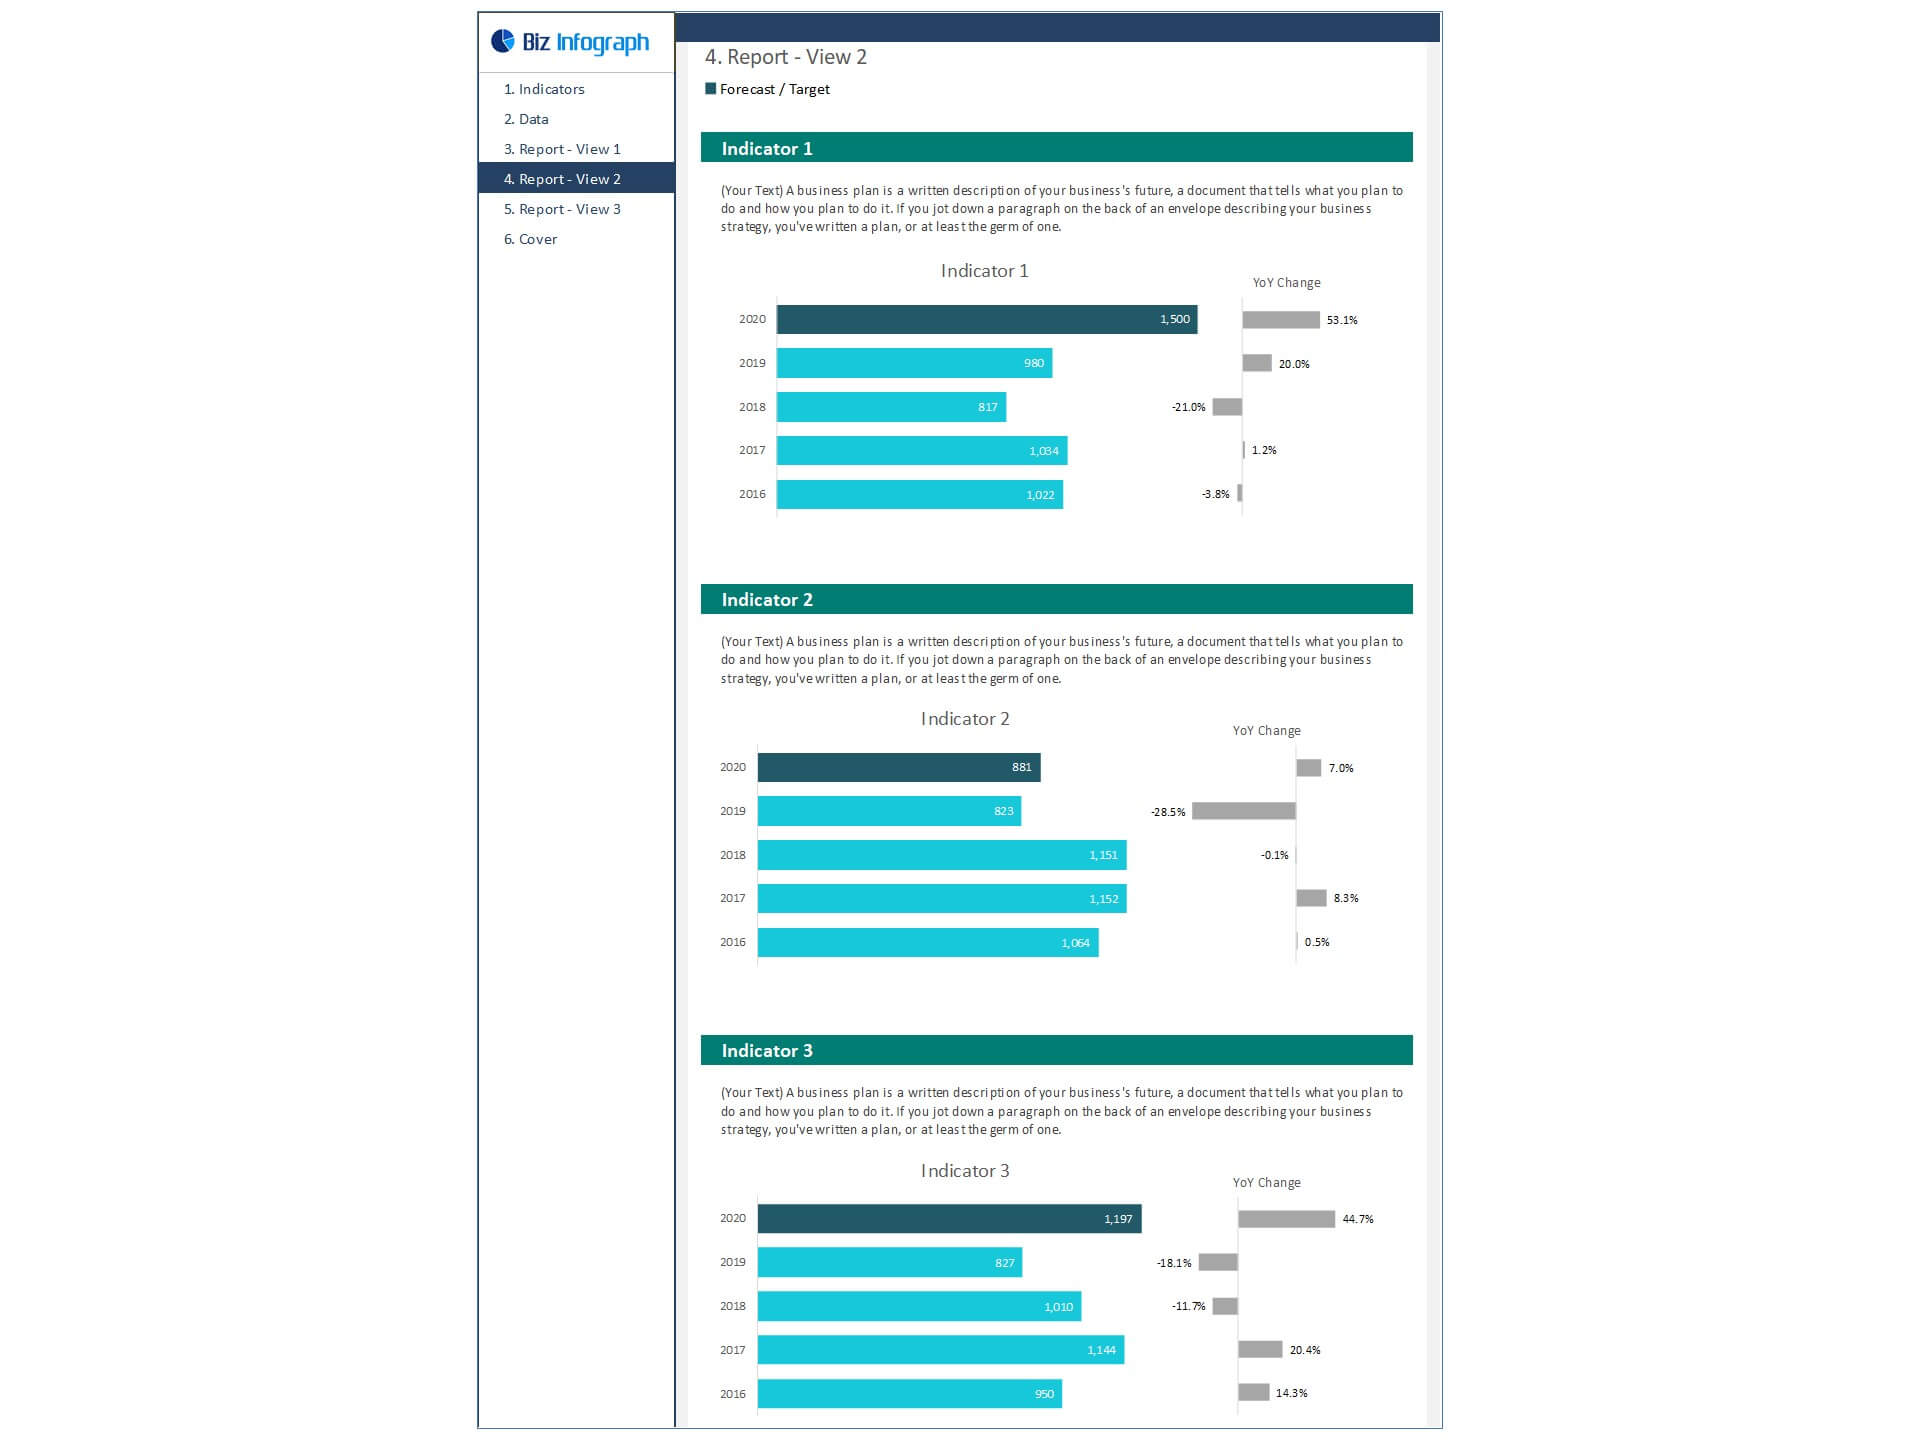
- Beautiful charts to display historical performance indicators
- Easily compare KPIs over a 5-year period, including a forecast year
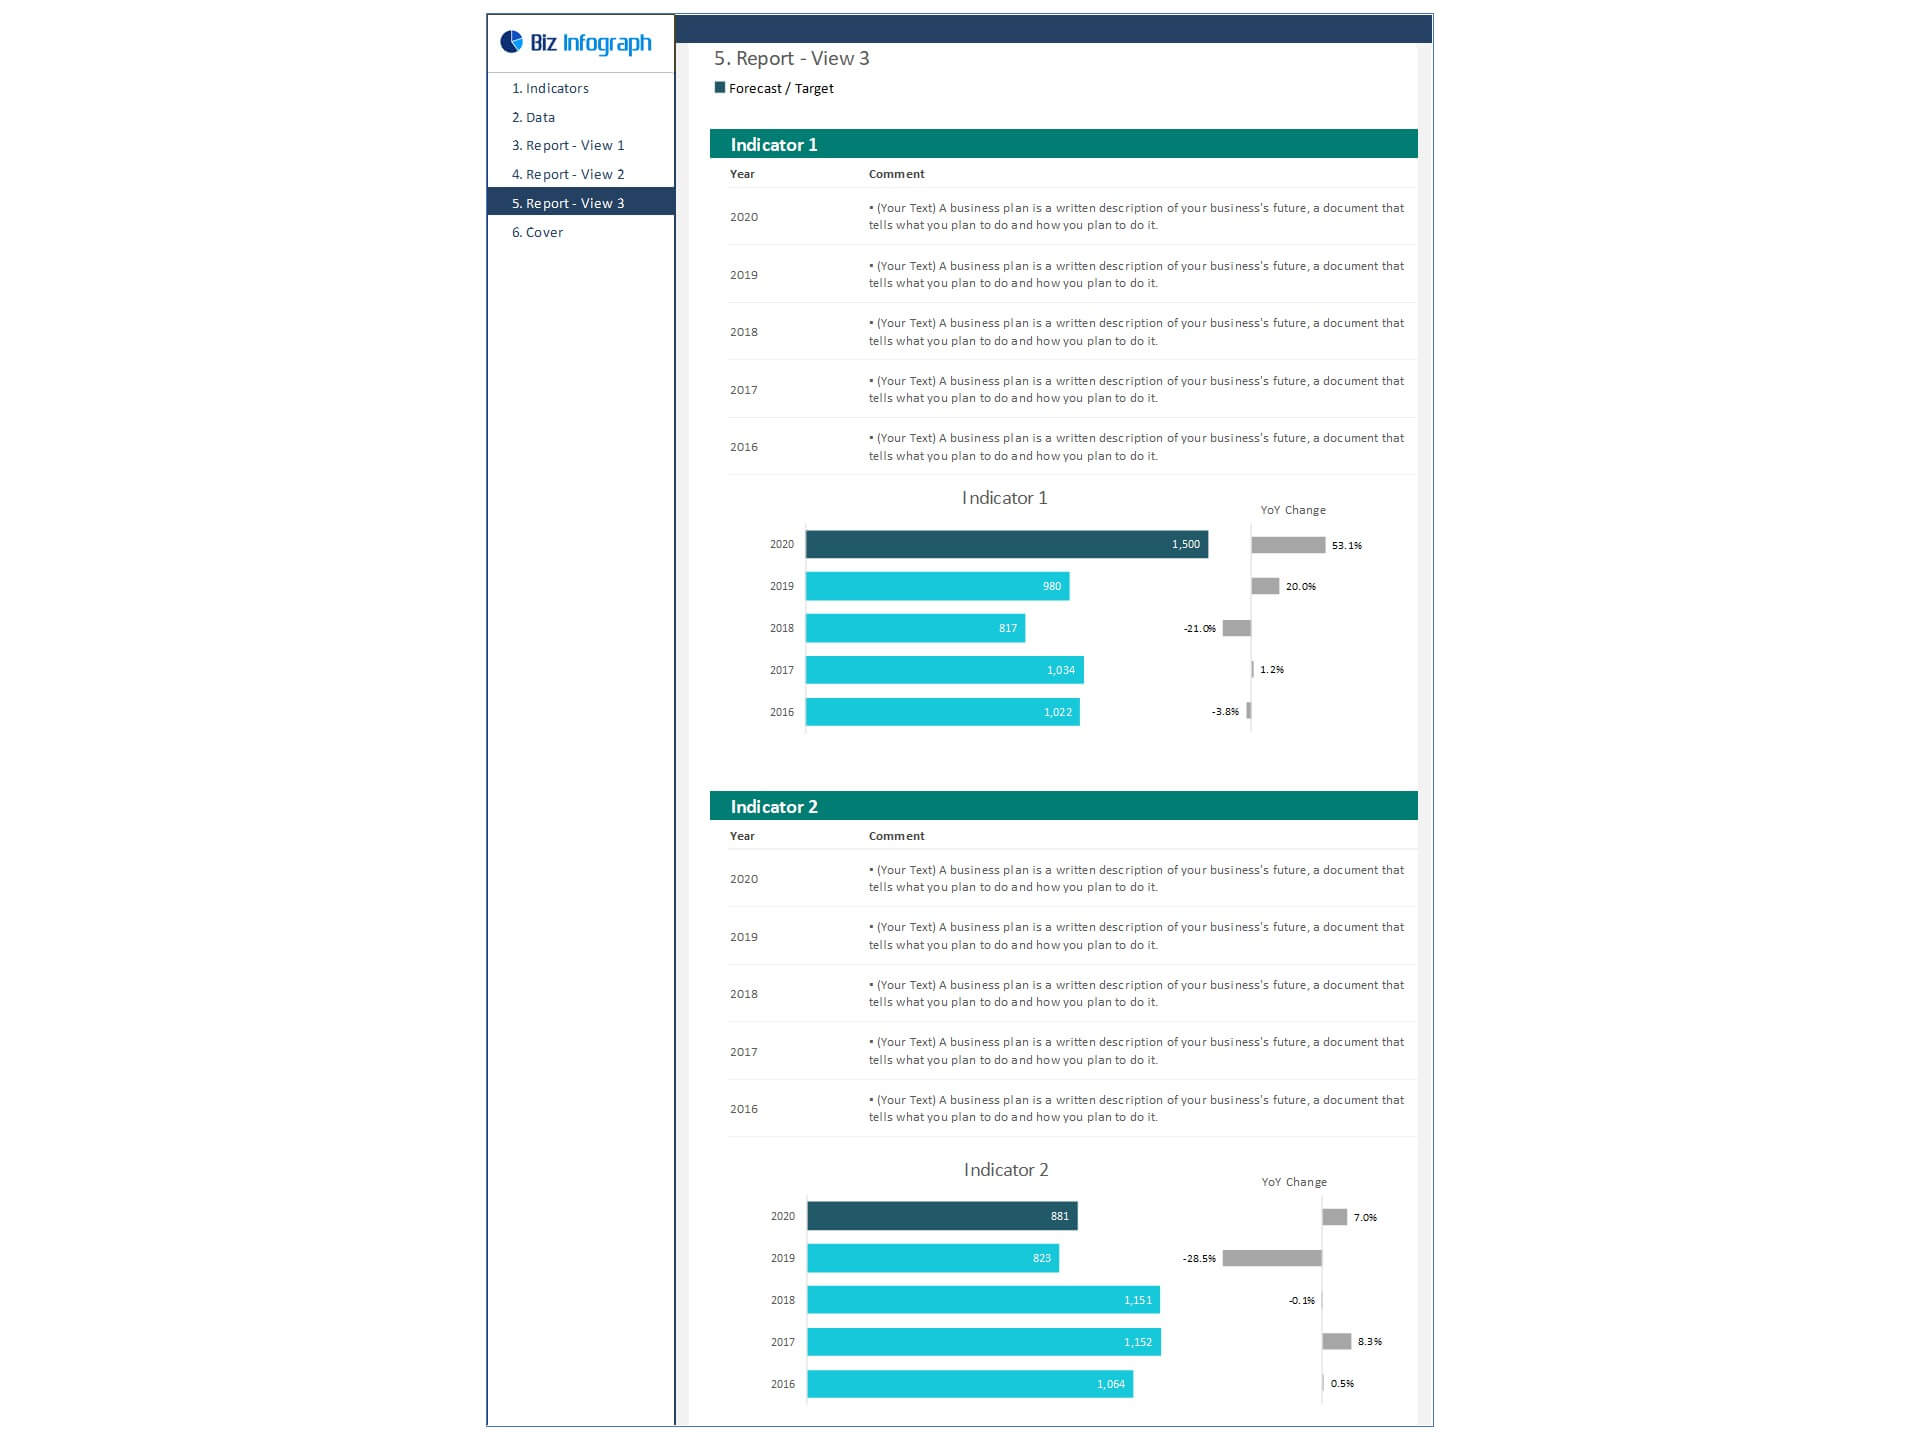
- Spaces available to add comments and analyzes for each chart
- Fully editable, easy to use, template with sample data
- Eye-catching design and customizable
- Change the sample data with your data
- Spreadsheets ready for printing without Biz Infograph logo
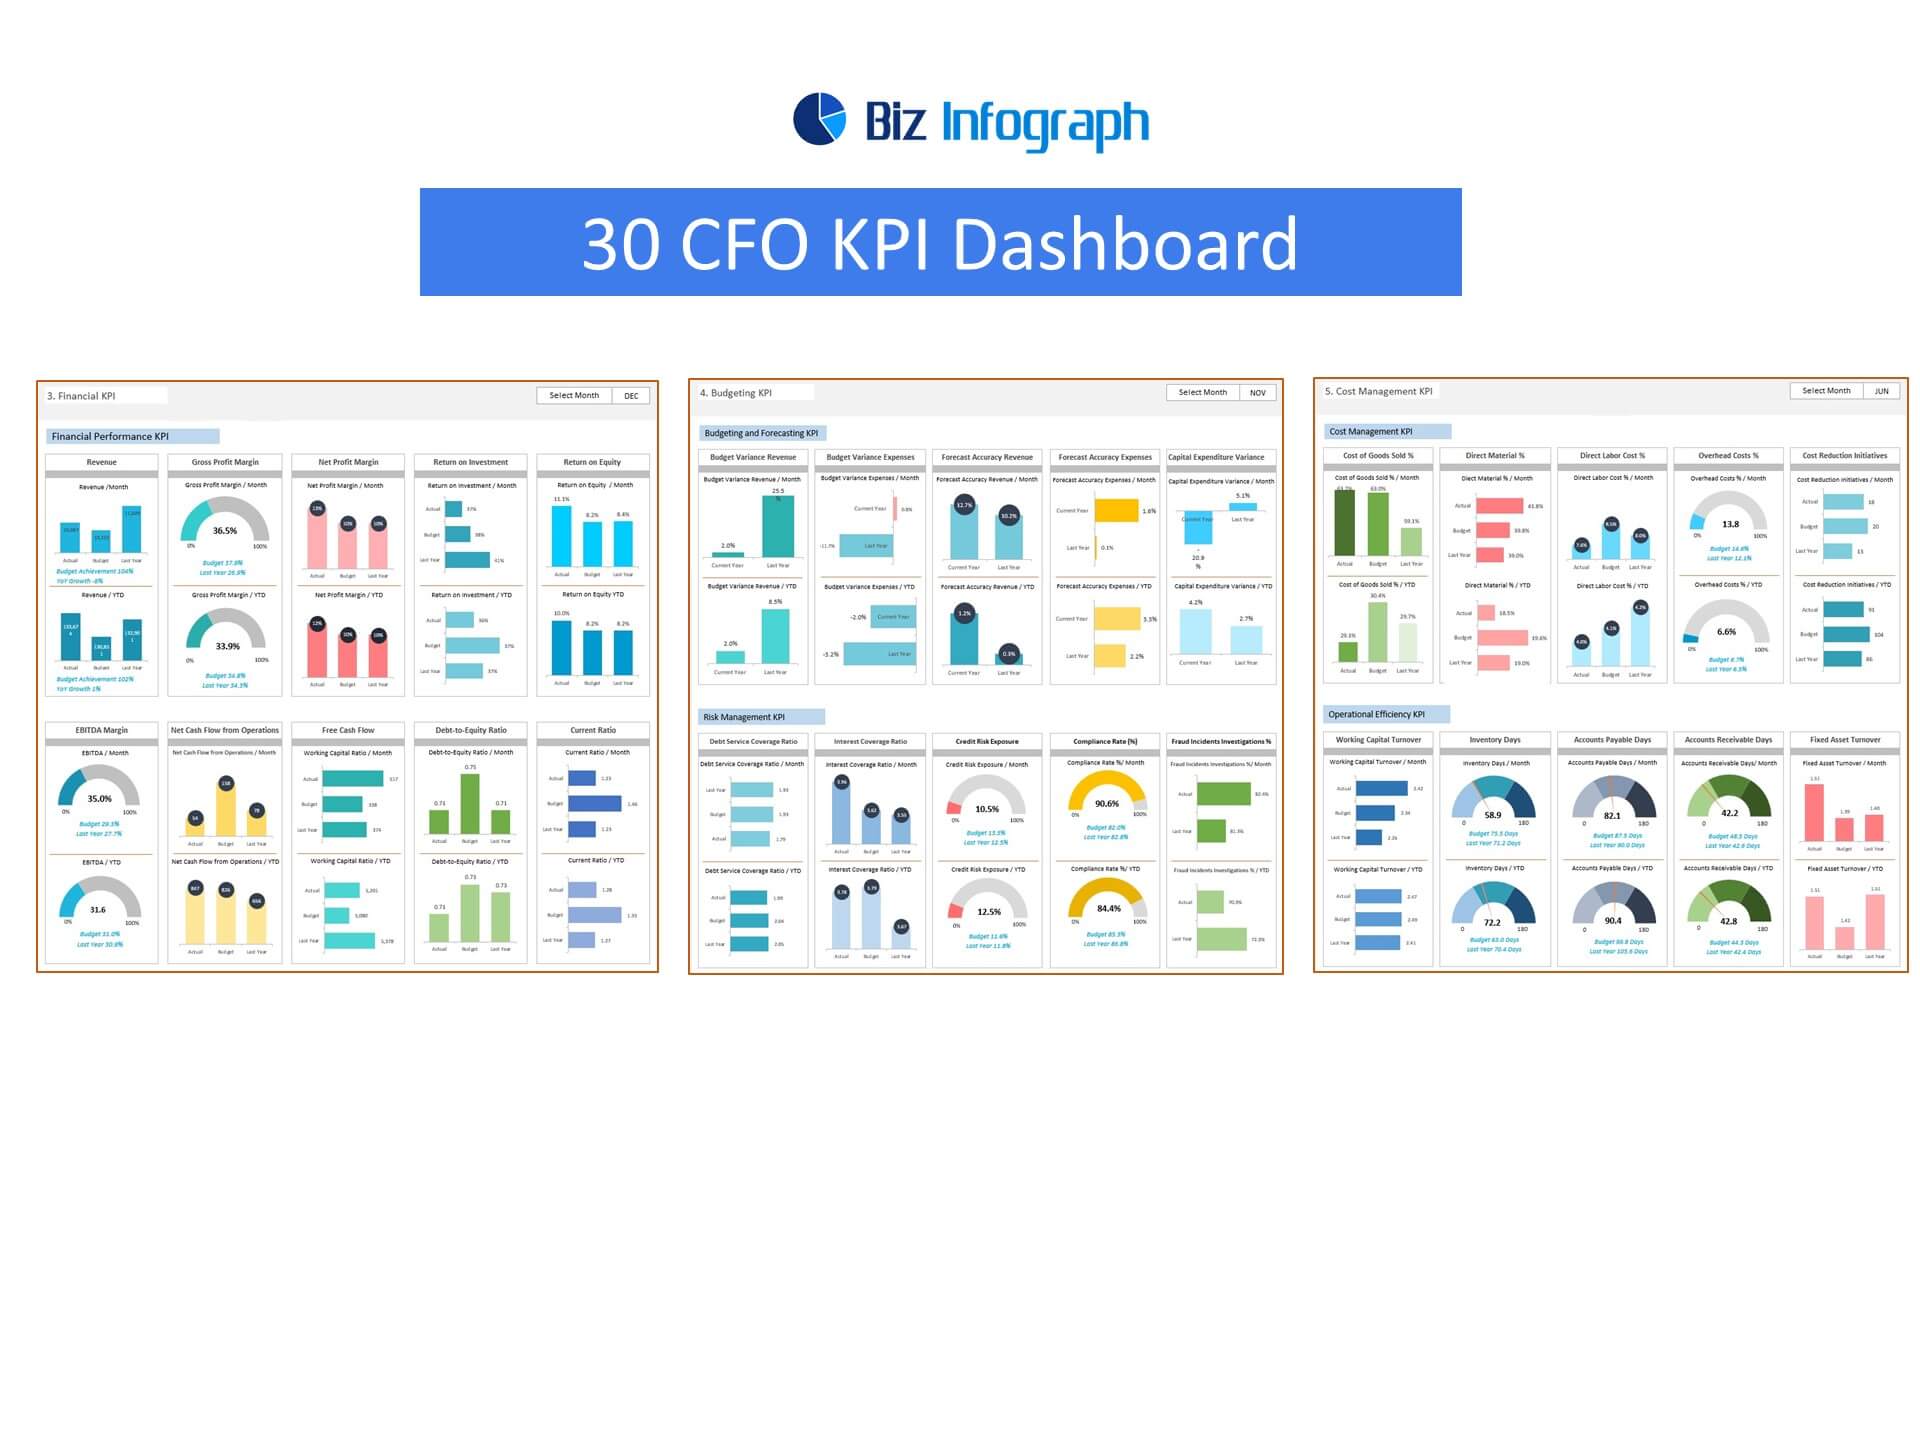
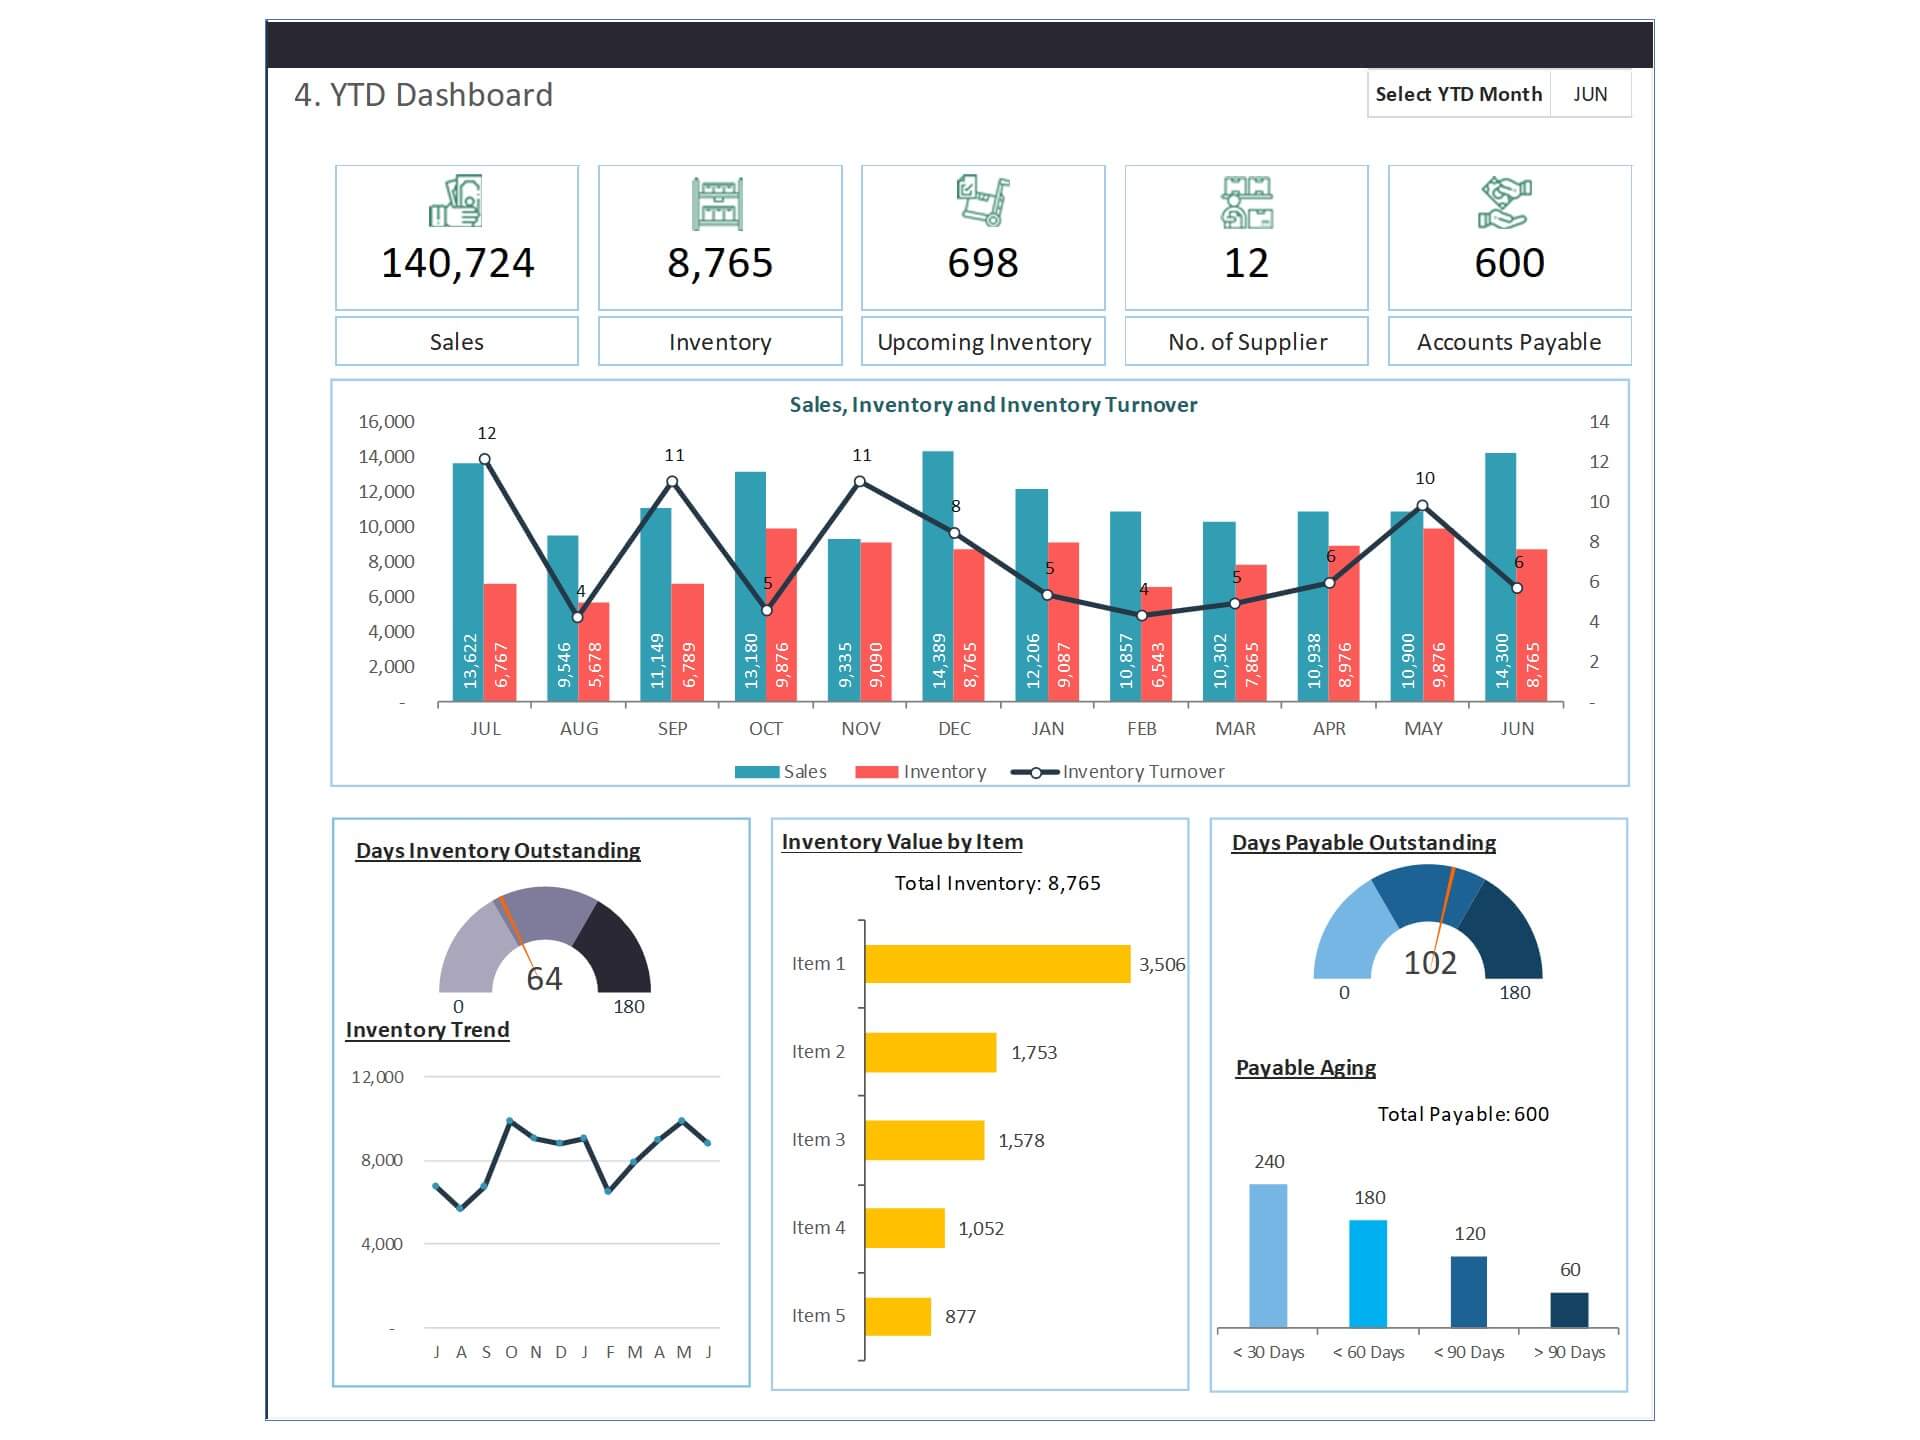
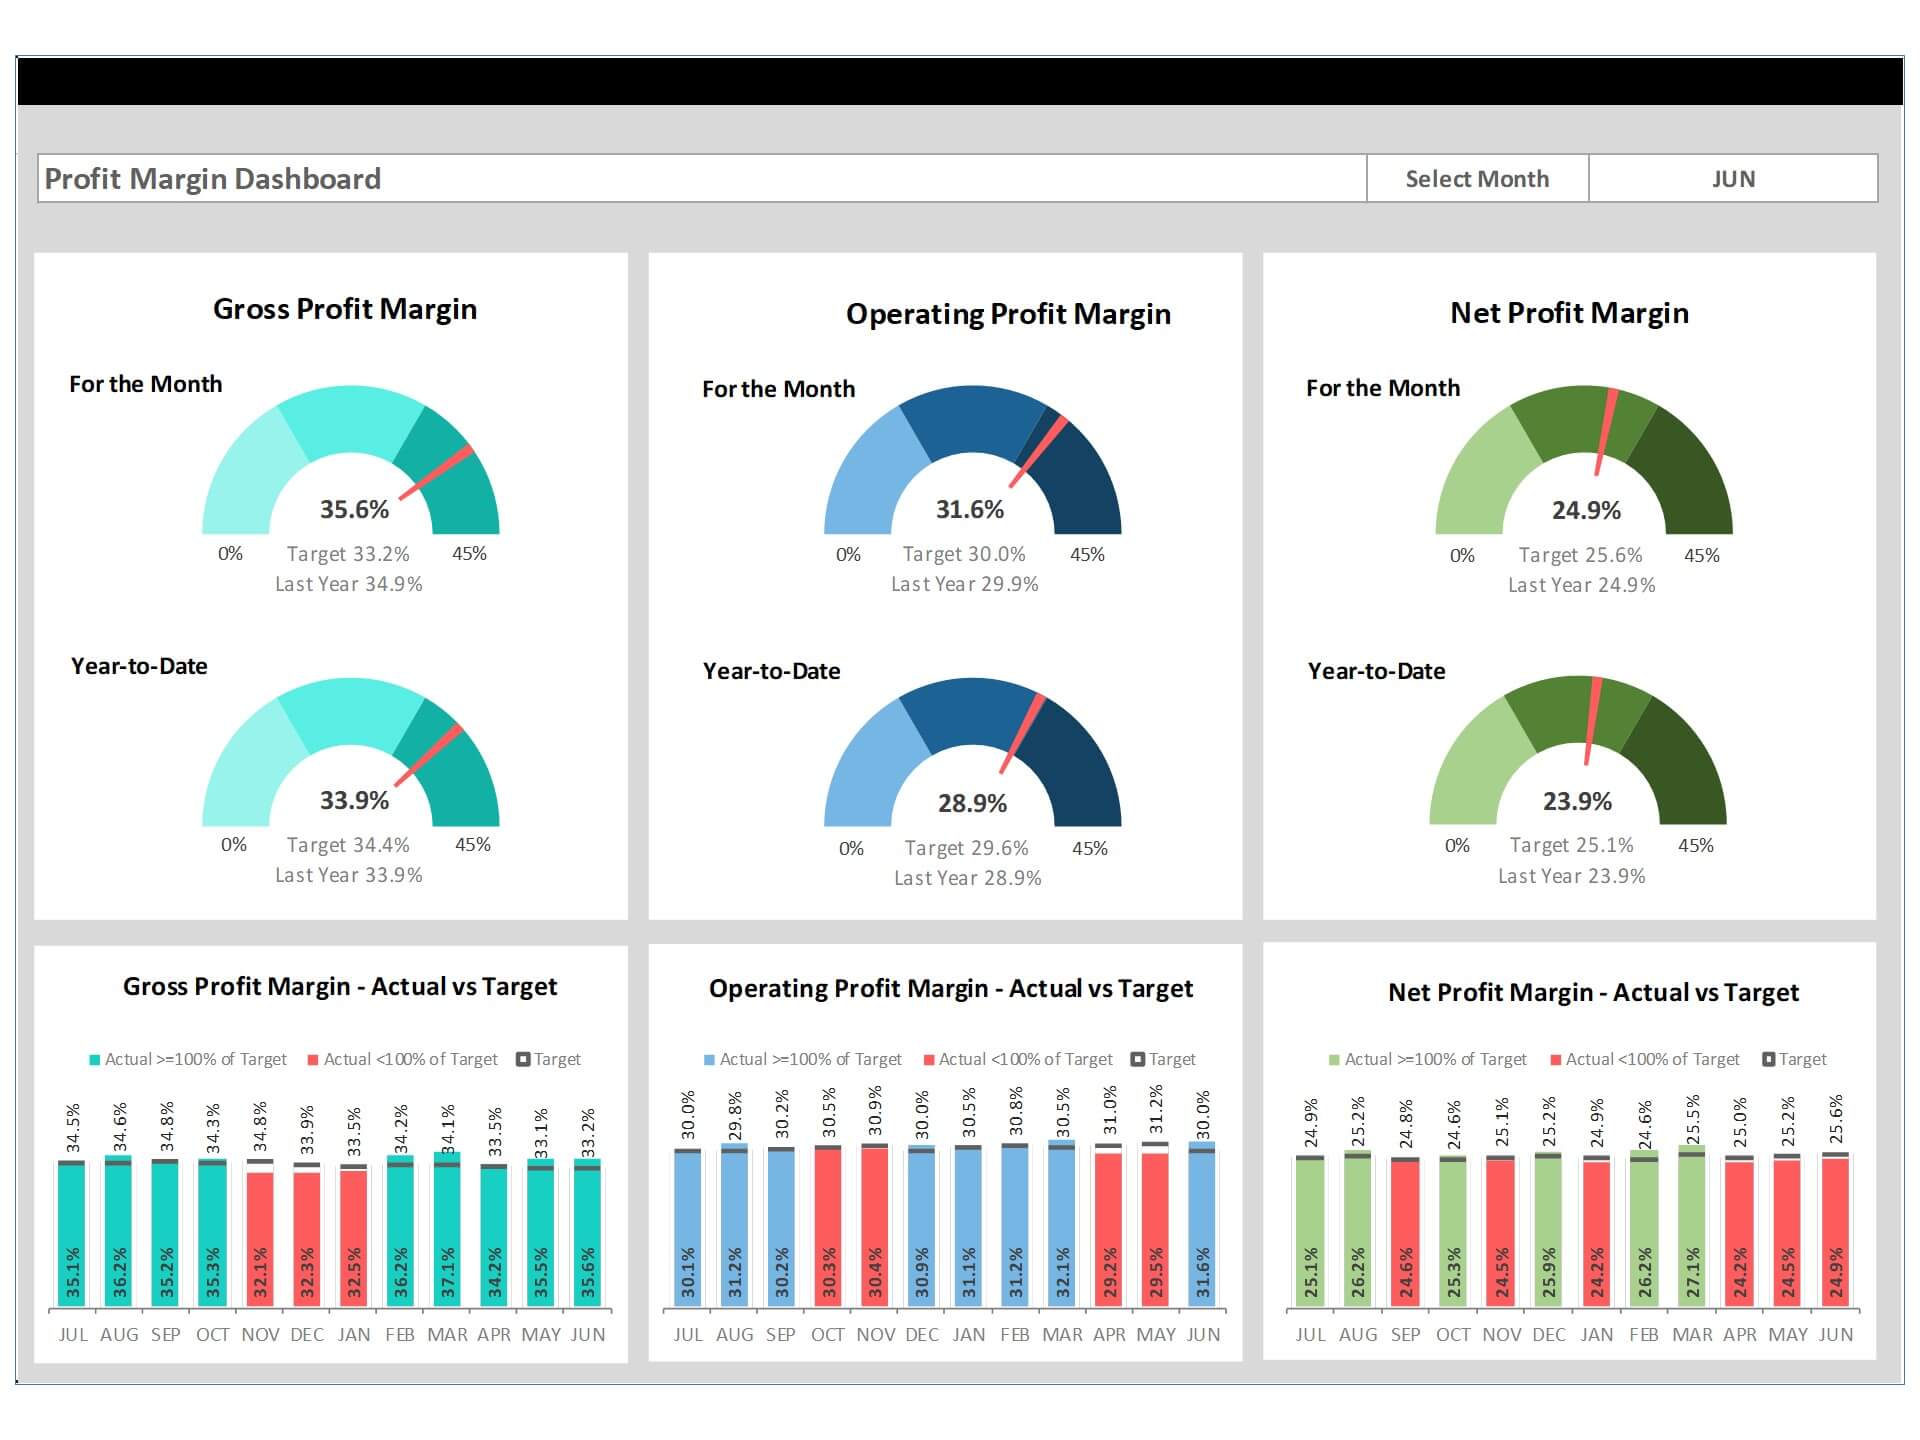
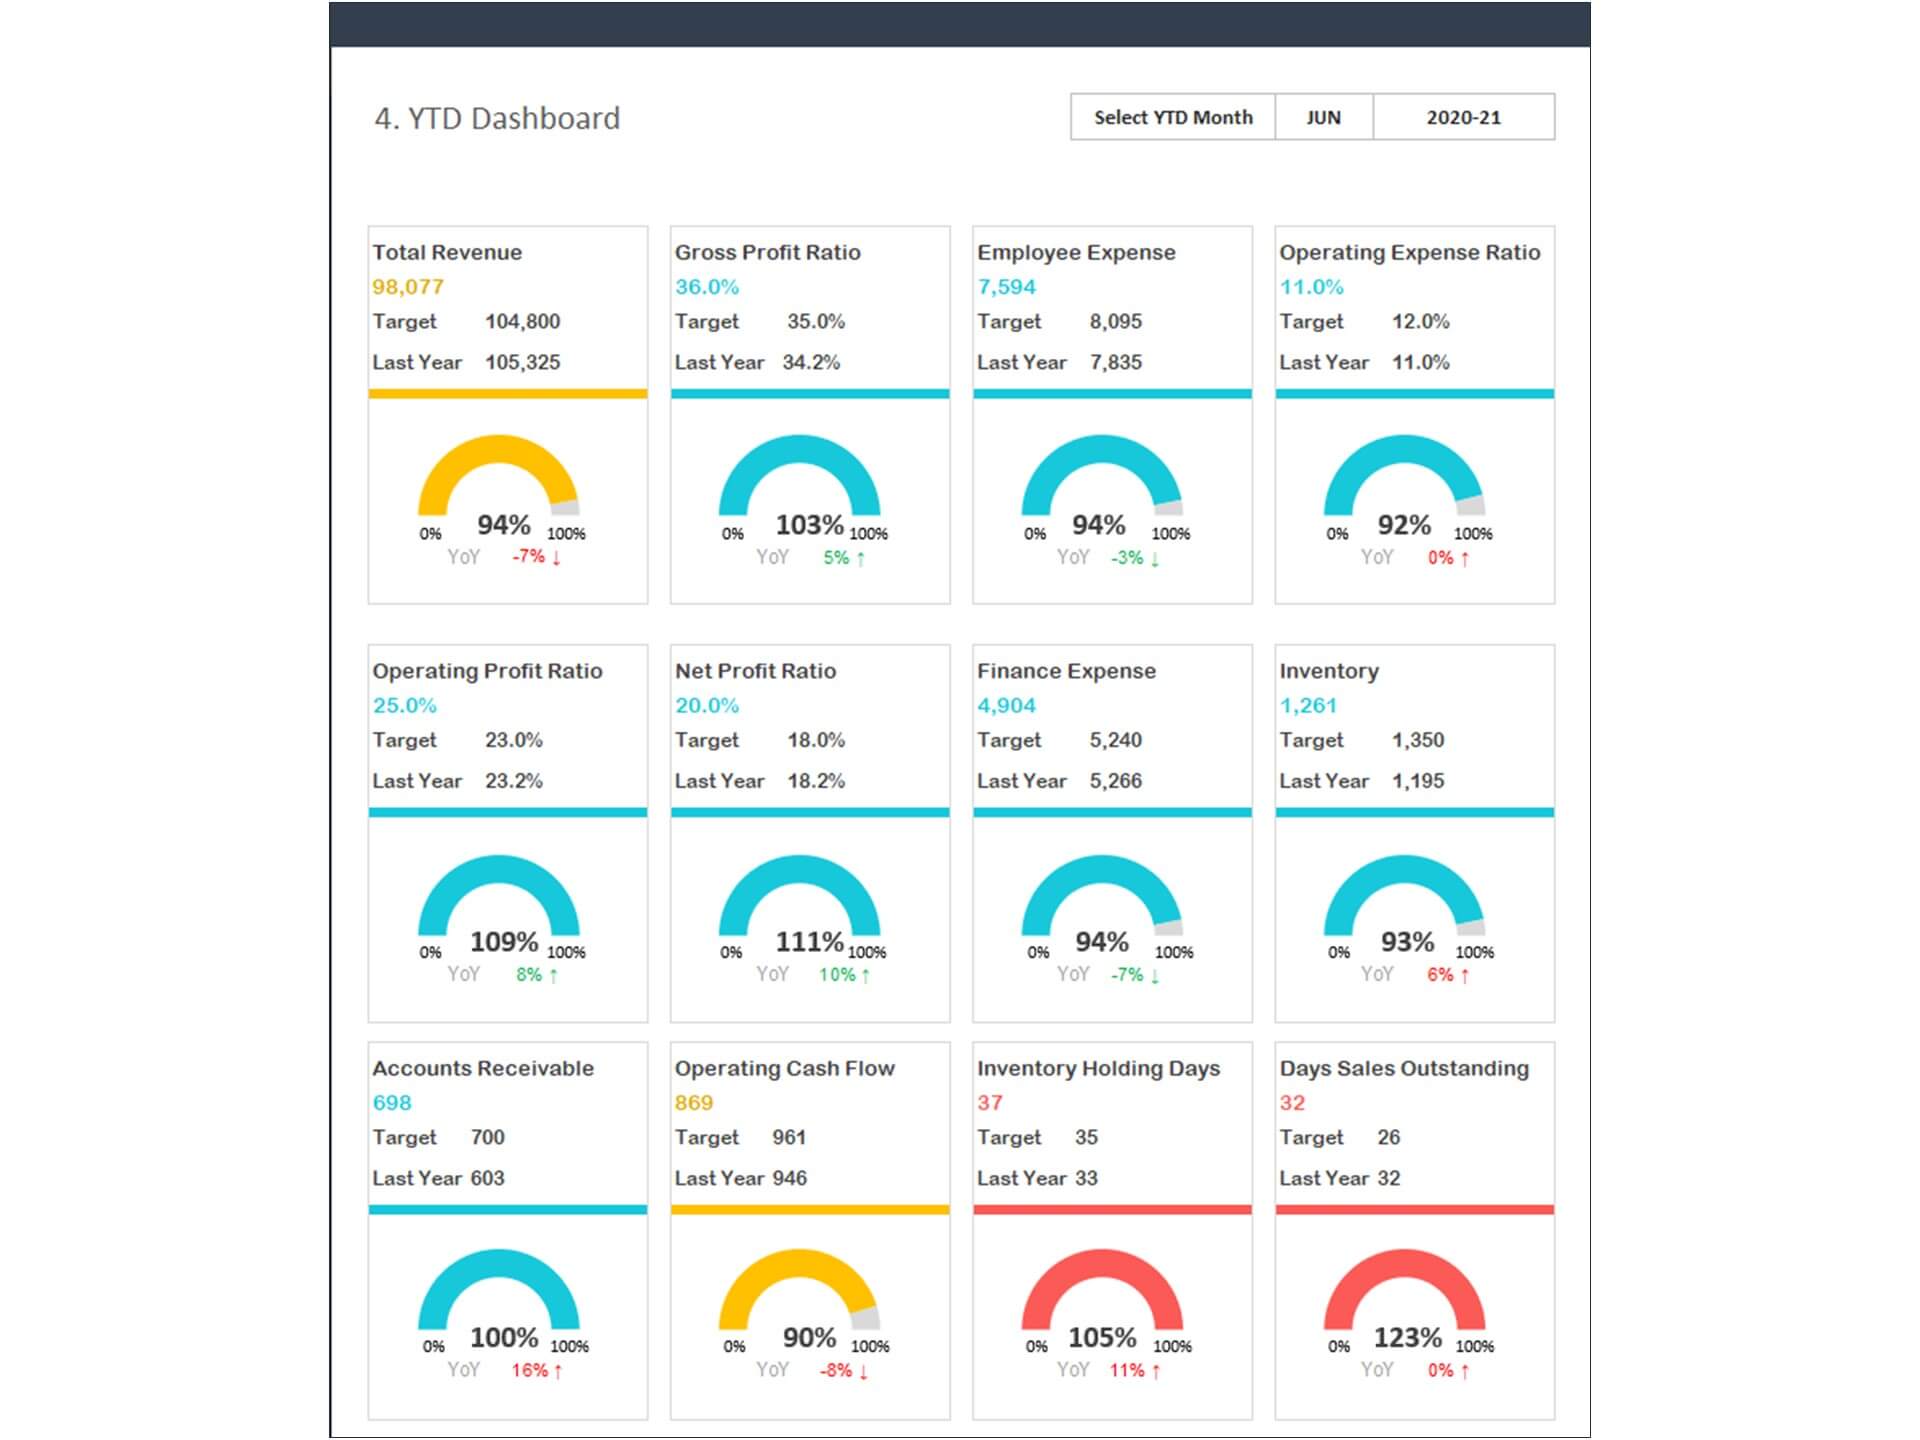
- Consolidate key financial performance indicators in one dashboard
- No monthly fees
- Immediate download
- No VBA, no Macro
- No installation necessary
- Professionally designed
What is included in this dashboard template?
- Just plug your data, the dashboard will be ready instantly and start using.
- A text file which contains a password to view and edit the formula
- A guide to unlocking all the elements in the dashboard
Professional Support:
- Video tutorial guide on how to navigate and use the Yearly Comparison Report Template
- Professional service to customize dashboard template in excel as per business need
- Help and support in post-purchase
- Payment secured by Stripe and PayPal (no PayPal account needed)
A brief guide to using the dashboard template:
- Open the dashboard template
- Go to ‘Indicators’ menu – choose the start month of the fiscal year (i.e. Jan, Feb, Jul, etc.)
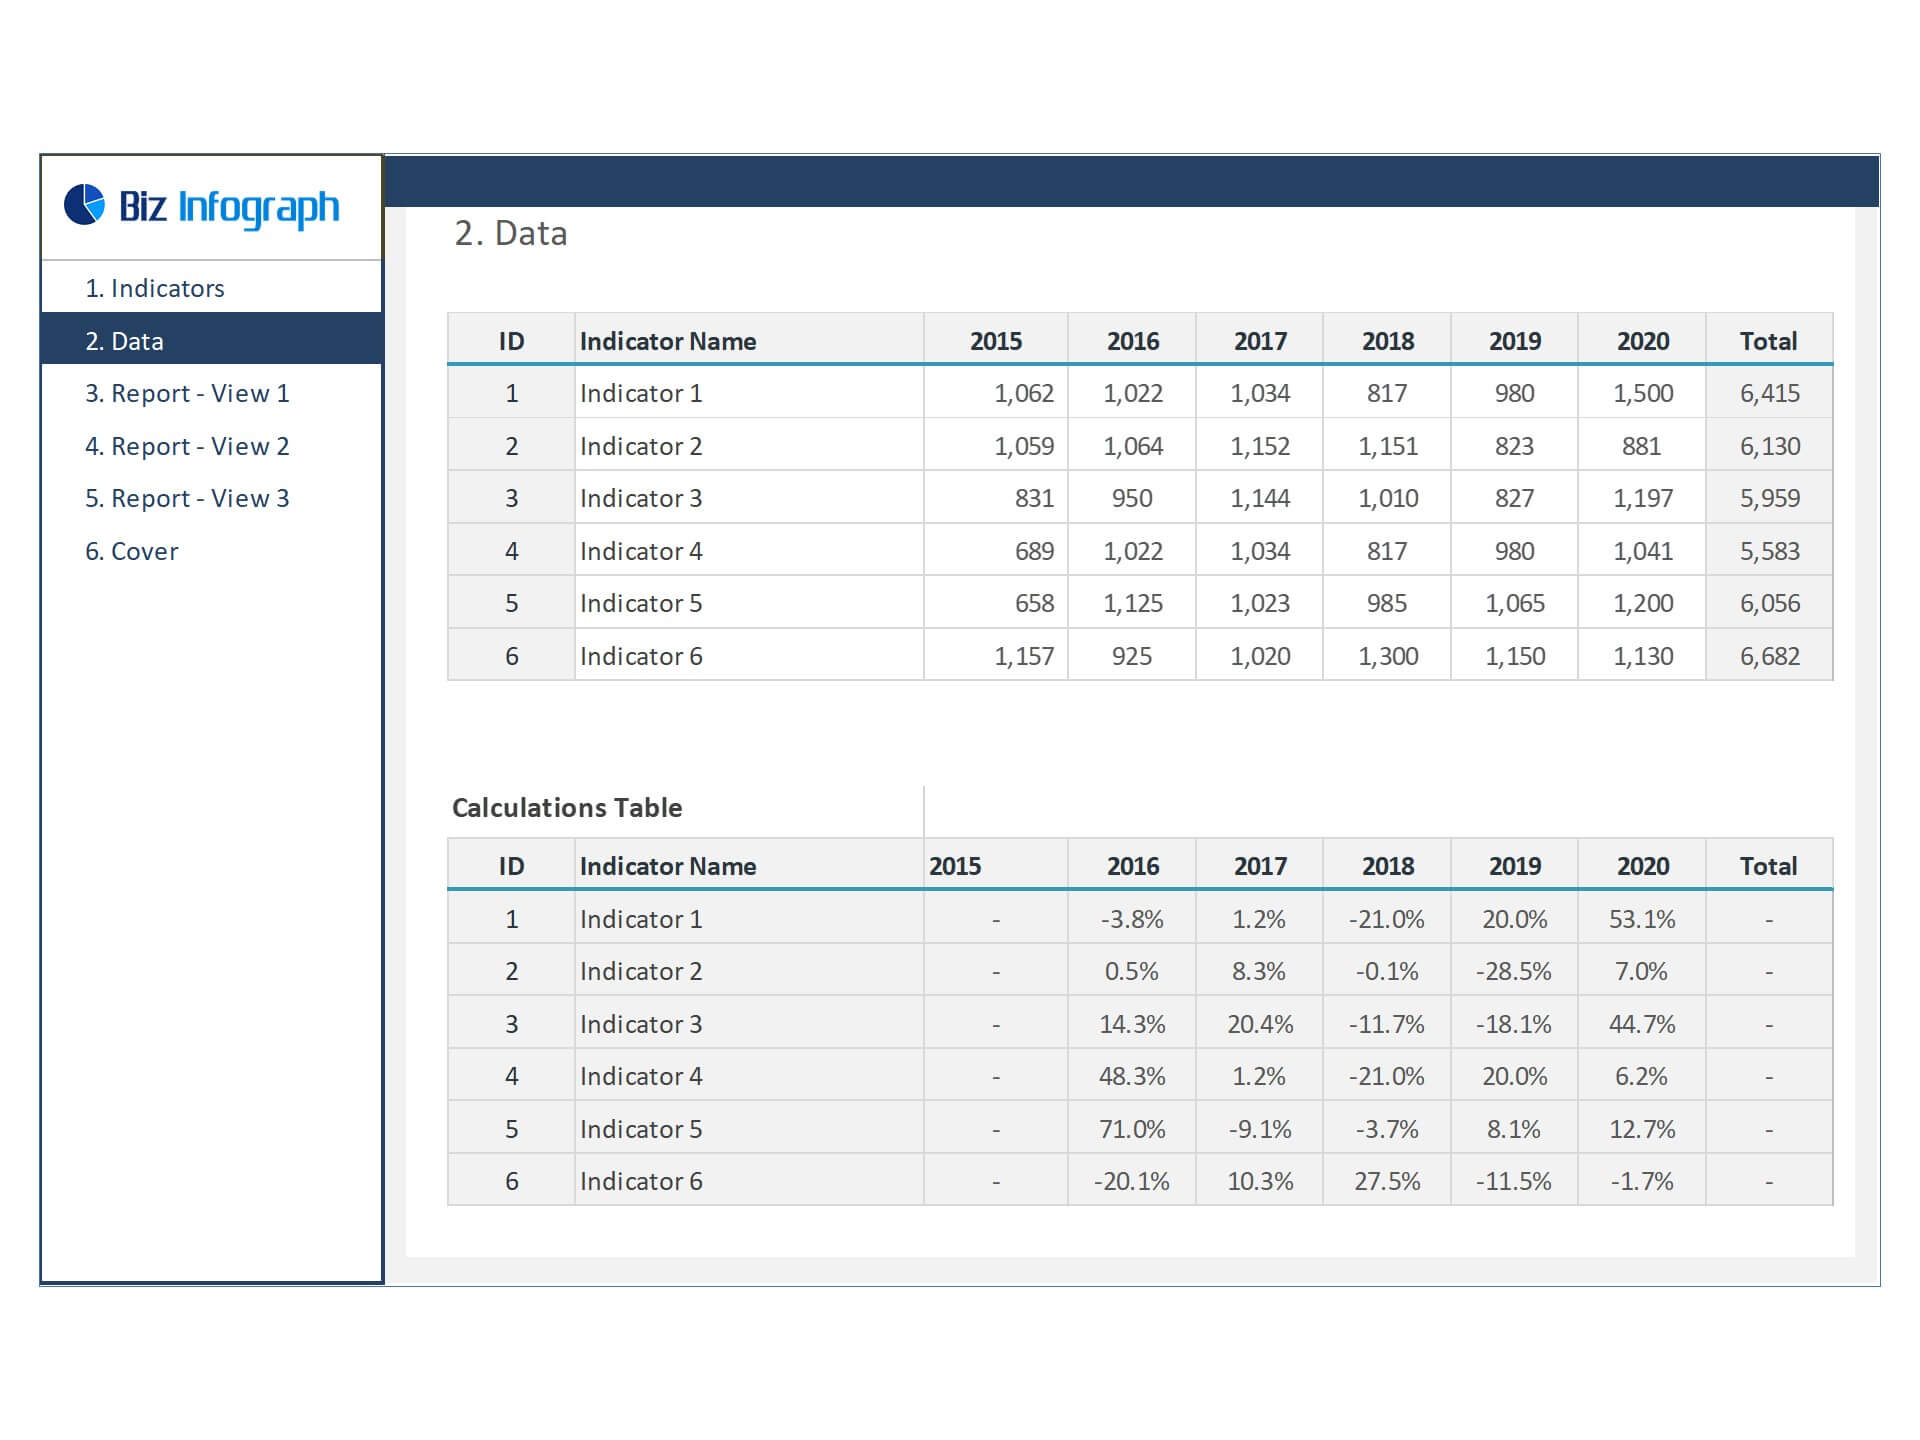
- Go to the ‘Enter Data’ menu – remove the sample data and give your actual data in the respective cells. Formula cells are locked, and you cannot edit it without a password.
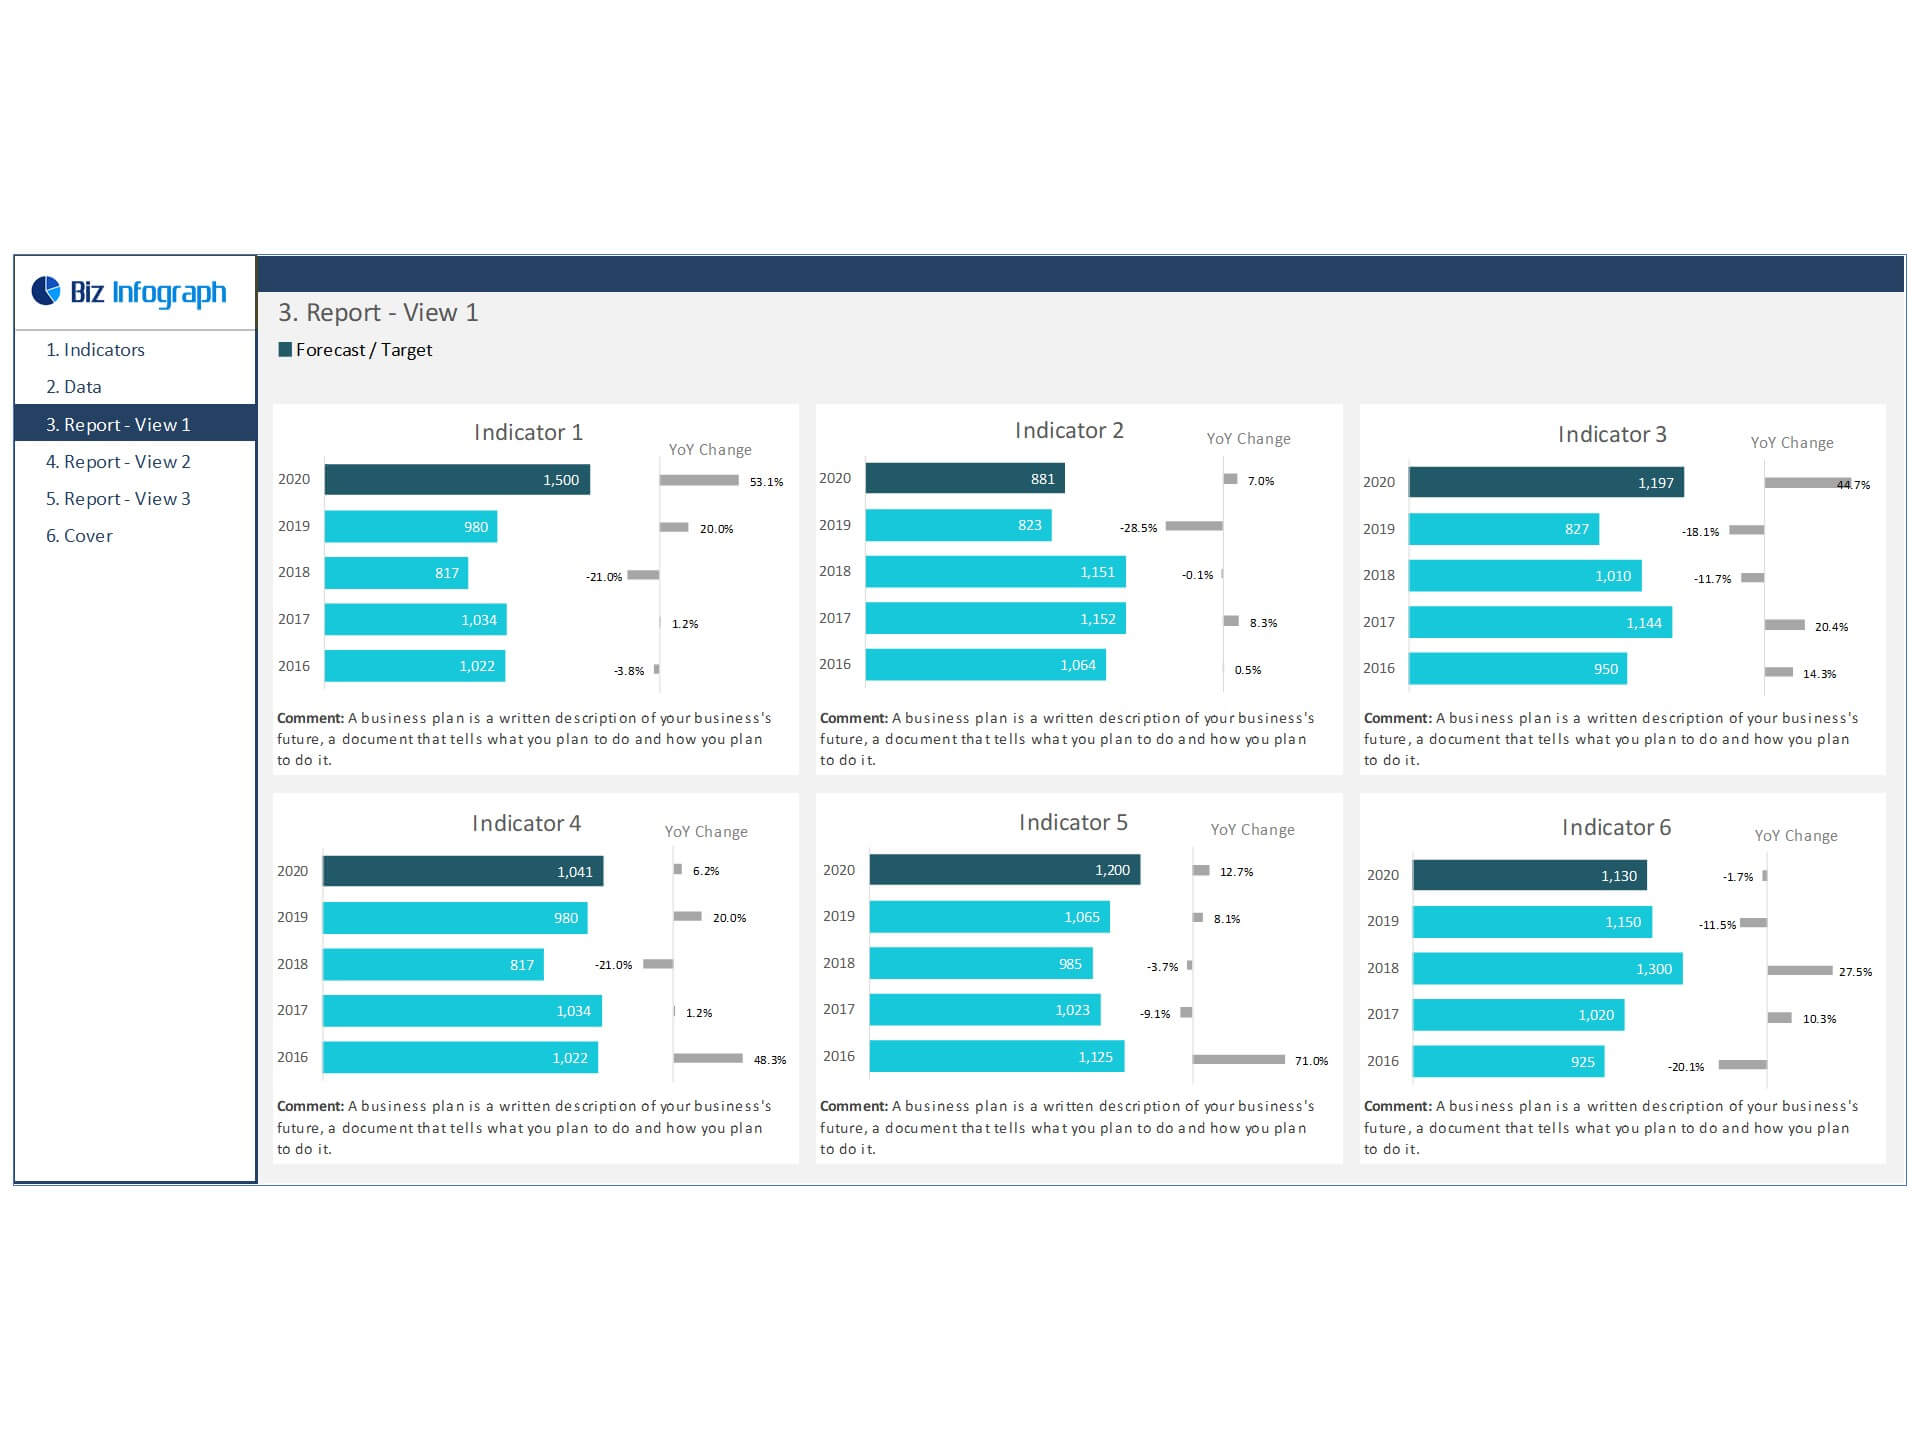
- Go to the ‘Report View-1’ menu – to see the summary performance of the last five years
- Go to the ‘Report View-2’ menu – to see the detail of each year with a summary note
- Go to the ‘Report View-3’ menu – to see the detail of each year with separate notes for each individual year
- Each page is ready for printing – just press CTRL+P
This Excel dashboard template is password-protected to avoid mistakes, such as accidentally deleting formulas. When you completed the purchase, the password will be available.


Similar Templates