A startup owner needs to be very vigilant about where their finances are coming from. Every penny counts—especially if your business is in its initial stages of business life cycle. At a time like this, you need a financial manager who tracks your expenses, keeps a check of the revenue, and analyzes the data into a more meaningful format. Don’t have funds to hire someone? A financial dashboard can help you!
Keep a check on your finances
As a startup owner, you’re probably the only one looking after most of the small business functions. This includes finances, operations, procurement, supply chain, marketing, and handling clients’ queries. In the middle of all the chaos that goes into your everyday work life, you probably don’t have enough time on your hands to jot down the financial statements.
Drafting financial statements, cash flow analysis, profit and loss accounts, and recording transactions take up a lot of time and expertise. On the other hand, a financial dashboard gives you a single-glance insight into your startup’s financial health and profitability analysis. All you need to do is spend a few minutes analyzing the dashboard and it’ll tell you how well your financial indicators are doing.
Streamlines reporting
Most startups solely rely on investor funding for the sake of their operations. As a startup owner, you need to present the finest possible case in front of your potential investors to get them to pitch in their funds. Investors don’t have a lot of time to attend detailed presentations and seminars or engage in extensive conversations regarding the prospective funds.
Instead, you can get your potential investors to take a detailed look at dashboards. Dashboards are very cohesively organized, informative, and concise. They also offer great readability and can be skimmed through quickly. Your potential investors can analyze the dashboards in detail to understand how potentially viable the project is.
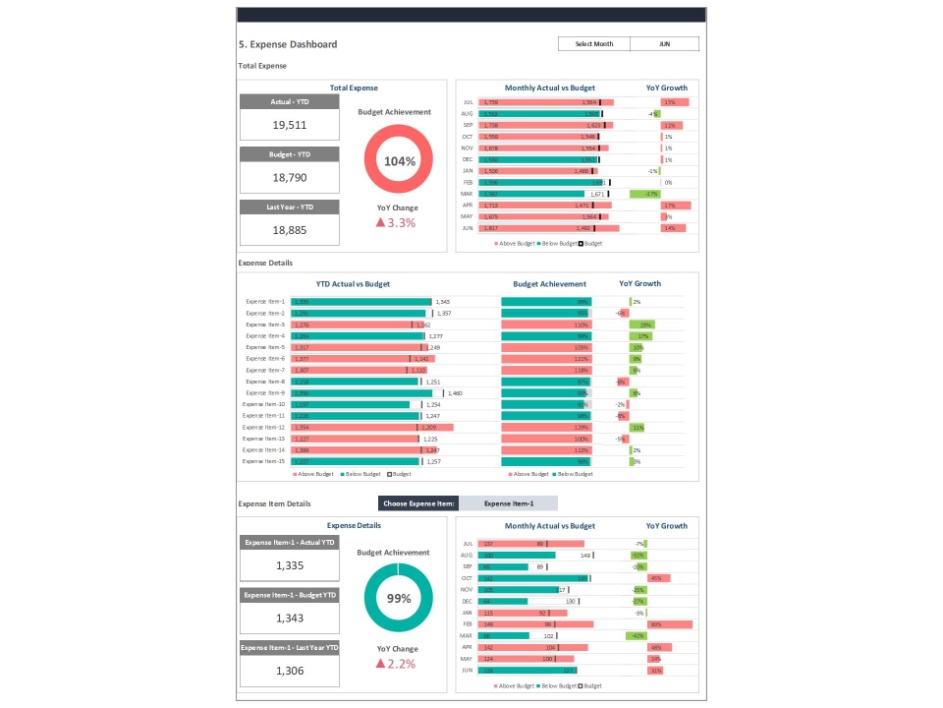
Budget comparison
Startups are usually on a strict budget and need to comply with a strict schedule. A financial dashboard also helps you compare your budget values with actual expenses and identify any discrepancies. You can always compare the values to see where your company needs to cut down on costs, expenses, and pay-outs.
The comparative dashboard also points out important areas of improvement that you can work on to do better. When you approach the end of your fiscal year, a comparison with the budget values tells you how you’ve done throughout the year. This will help you reevaluate your strategies for the next year.
Biz Infograph offers a number of pre-designed dashboard templates that are completely editable, customizable, and readable. All you need to do is plug in your data and the dashboard will fill up as per your specifications. The dashboards are also very visually pleasing, so you don’t have to hire expensive graphic designers to beautify your reports. Please take a look at our business dashboard and PowerPoint templates here.