If you’re new in the industry, your success highly depends on your financial metrics and revenue. Your customers, investor, and stakeholders will look at your financial KPIs and metrics when they want to evaluate your business’s standing. This is why it’s important to include the most meaningful metrics while working with financial dashboard templates.
In this blog, we’ve compiled a list of the most valuable indicators. Let’s take a look.
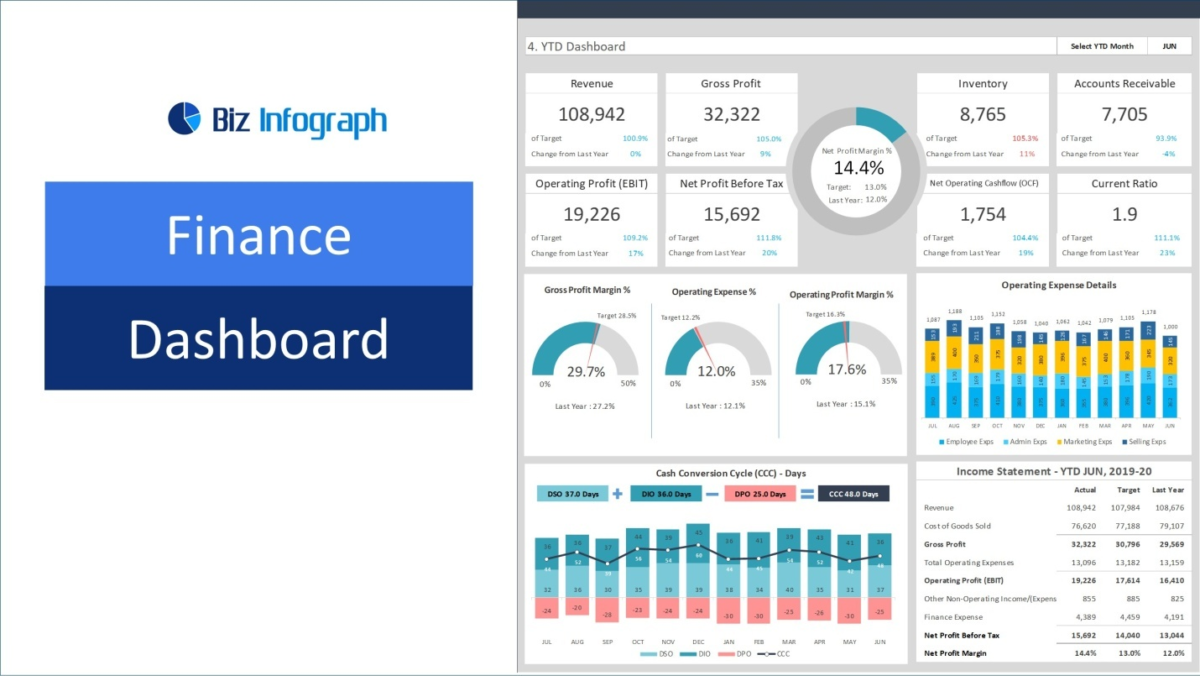
1. Sales Or Revenue
How much money is your business or brand generating every year? You can typically find this at the top of most financial statements. It’ll be helpful to break down overall revenue by region or product. This will give you a clear picture to help you analyze which aspect of your business generates more money.
It’s also helpful because, with this KPI, you can spot revenue concentration. If most of your sales are generated from one customer, one region, or one product, this can leave your business vulnerable. This KPI works better if you examine monthly sales and revenue growth rates alongside it.
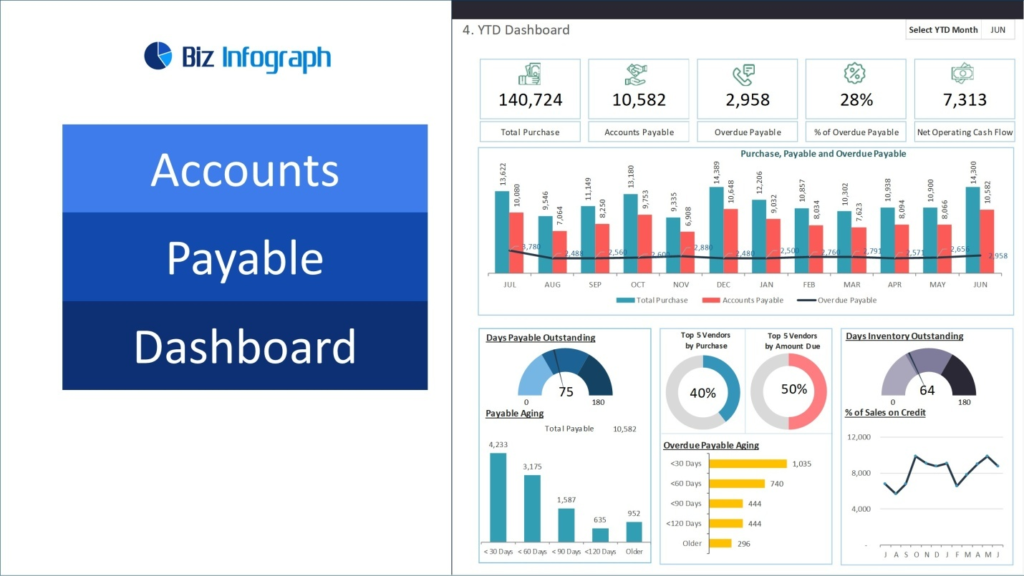
2. Liquidity
This financial metric helps track how much money is left in your business. The difference between your liabilities and current assets is known as liquidity. Liabilities can include factors such as payable business accounts. At the same time, assets include the stock, sending invoices, and cash you have in your business bank account. If you want to maintain a healthy business in which investors and creditors might be interested, you need to ensure a “good” liquidity ratio of around 2.
When evaluating the liquidity, it’s also a good idea to look at the cash conversion cycle. How long does it take you to reap benefits after a monetary investment? If you’ve got a reduced cash conversion cycle, this will also generate better liquidity.
3. Profitability
How much profit are you gaining after your monthly expenses? Do you have a profitable business? You can calculate profitability by subtracting all your business costs from the revenue. This is usually the bottom line because you mostly find it at the bottom of your business financial statements. The key indicator you need to keep an eye out for here is the net profit margin. It looks at the profits in relation to the revenue. Net profit can vary widely across the marketplace, but a good benchmark is to have a 10% goal in mind.
4. Return On Investment (ROI)
This is another crucial financial metric as it’ll help investors make up their minds easily. Investors and stakeholders usually look for businesses that’ll help you get the highest return possible. If a businessman invests 1 dollar in a business and gets 5 dollars back, that’ll be known as a good ROI. In finance, an ROI of 5 to 1 is considered good. Whereas an ROI of 10 to 1 is considered exceptional.
Sign Up For A Financial Dashboard Template
At Biz Infographics, we have a range of financial dashboard templates that includes a sales and profitability dashboard, annual report, finance scorecard, cash flow, KPI dashboard, and a lot more. We offer various other dashboards, including sales budget dashboards, custom dashboards, inventory dashboards, HR training dashboards, and accounts receivable dashboards.
Contact us to learn more about our professionally designed dashboards.