Introduction to Sales Team Dashboard Template in Google Sheets
Overview of Sales Team Dashboards
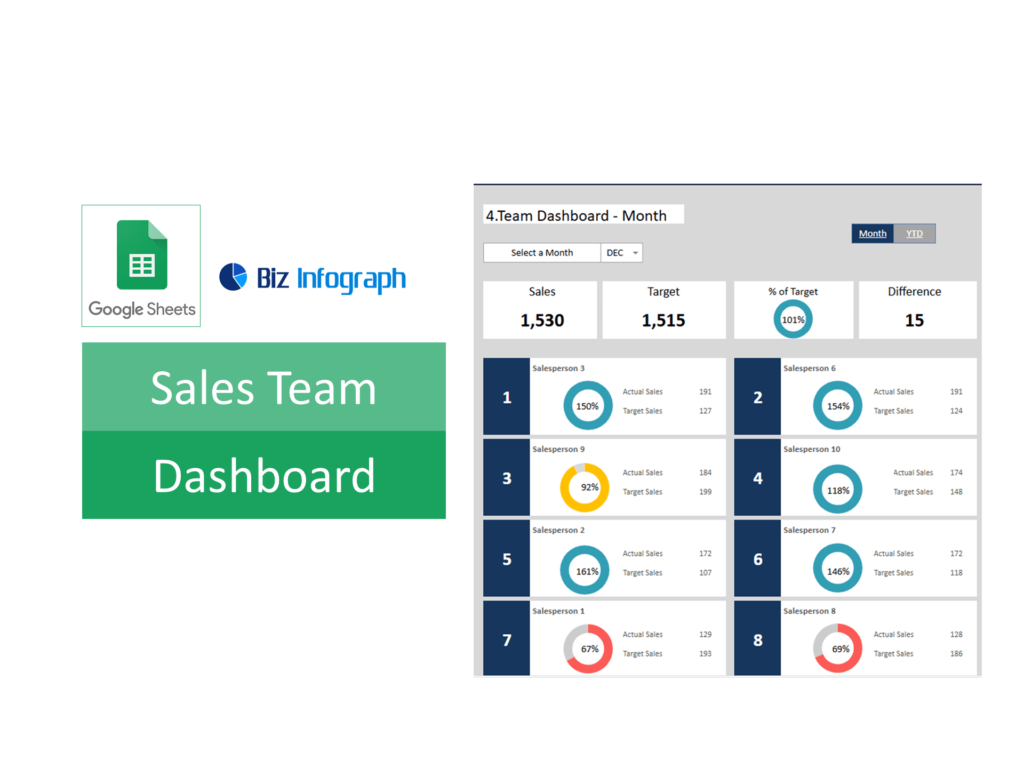
A sales team dashboard is a centralized platform that visualizes and tracks the performance of a sales team. It consolidates various sales metrics into a single view, making it easier for sales managers to monitor progress, identify trends, and make informed decisions. These dashboards often include KPIs such as monthly sales, win rates, and sales pipeline stages. Using a dashboard in Google Sheets is particularly beneficial because of its accessibility and ease of use. Sales teams can collaborate in real-time, ensuring everyone stays updated on performance metrics, which is crucial for effective sales management.
Why Use Google Sheets for Sales Dashboards?
Google Sheets is a versatile tool for creating sales dashboards due to its collaborative features and integration with other Google Workspace applications. Using Google Sheets for dashboards allows teams to easily import data from various sources, including CRM systems like Salesforce. The platform supports dynamic dashboards that update in real-time, providing the latest data insights at a glance. Additionally, Google Sheets offers various management dashboard templates that can be customized to fit the specific needs of a sales team. This makes it an ideal solution for creating performance dashboards that track critical sales metrics and support sales operations.
Features of the Sales Team Dashboard in Google Sheets
Key Performance Indicators (KPIs) Tracked
A well-designed sales team dashboard template in Google Sheets tracks several key performance indicators (KPIs) critical for sales performance. These KPIs include monthly sales, conversion rates, sales pipeline stages, and customer acquisition costs. Tracking these metrics helps sales teams understand their performance and identify areas for improvement. The template can be customized to include additional KPIs relevant to specific business goals. For instance, an executive KPI dashboard might focus on high-level metrics, while a sales operations dashboard could delve into detailed metrics like lead response times and deal closure rates.
Interactive and Dynamic Dashboard Elements
Creating an interactive and dynamic dashboard in Google Sheets involves incorporating elements that allow users to filter and manipulate data easily. Features like dropdown menus, slicers, and interactive charts make it simple to view specific data sets and gain deeper insights. For example, a sales team can use a dynamic dashboard to filter monthly sales data by region or product category. This interactivity enhances the user experience and provides valuable insights into sales performance. Google Sheets’ flexibility allows for the creation of dashboards that can be tailored to meet the unique needs of any sales team.
Pre-Built and Free Google Sheets Dashboard Templates
Google Sheets offers a variety of pre-built and free dashboard templates that can be easily customized. These templates provide a quick and efficient way to set up a sales dashboard without starting from scratch. Free Google Sheets dashboard templates are available on the web and in the Google Workspace Marketplace. These templates come with pre-configured charts and formulas, making it easy to plug in your data and start tracking performance. Using these templates can save time and ensure that your dashboard includes all the necessary elements to track sales metrics effectively.
Setting Up Your Sales Team KPI Dashboard
Step-by-Step Guide to Building a Sales Dashboard
Building a sales team KPI dashboard template in Google Sheets involves several steps. First, gather and import your sales data into Google Sheets to create a Google Sheets template. Use formulas to calculate key metrics and organize the data into a structured format. Next, create charts and graphs to visualize the data, ensuring they are interactive and user-friendly. Customize the layout of the dashboard to highlight important KPIs and make the information easily accessible. Finally, set up automation to update the dashboard in real-time, keeping the data current. This step-by-step approach ensures that you create a comprehensive and effective sales dashboard.
Customizing Your Google Sheets Dashboard Template
Customizing your Google Sheets dashboard template involves tailoring it to meet your specific business needs. Start by adding your company’s branding elements, such as logos and color schemes, to the template. Adjust the charts and graphs to display the most relevant data for your sales team. You can also include additional metrics and KPIs that are crucial for your sales operations. Using Google Sheets’ customization features, you can create a dashboard that not only looks professional but also provides valuable insights into your sales performance. This customization ensures that the dashboard aligns with your sales strategies and goals.
Maximizing Performance with Google Sheets Sales Dashboards
Tracking Sales Performance
Tracking sales performance is essential for understanding how well your sales team is doing. A sales performance dashboard in Google Sheets helps monitor key metrics such as monthly sales, win rates, and pipeline progress. By visualizing these metrics, sales managers can quickly identify trends and areas that need improvement. Google Sheets’ real-time data updating capabilities ensure that the information is always current, providing an accurate picture of sales performance. This allows for timely interventions and strategic adjustments, ultimately leading to improved sales outcomes and more effective sales management.
Using the Dashboard for Sales and Marketing Integration
Integrating sales and marketing data into a single dashboard provides a holistic view of business performance. A Google Sheets dashboard can combine data from sales and marketing campaigns, offering insights into how marketing efforts impact sales results. This integration helps in tracking the effectiveness of marketing campaigns and their contribution to sales pipeline growth. By using a combined sales and marketing dashboard, teams can align their strategies and work towards common goals. This approach ensures that marketing activities are effectively supporting sales objectives, leading to increased sales and better overall performance.
Advanced Analytics and Automation
Advanced analytics and automation features in Google Sheets can take your sales dashboard to the next level. Using tools like Google Data Studio, you can enhance the visualization of your data and create more detailed reports. Automation scripts in Google Sheets can be set up to refresh data regularly, ensuring that your dashboard always reflects the latest information. These advanced features help in uncovering deeper insights and trends, allowing for more informed decision-making. By leveraging these capabilities, sales teams can focus on strategic activities rather than manual data updates, leading to improved efficiency and productivity.
Tips and Best Practices for Sales Dashboard in Google Sheets
Best Practices for Using Google Sheets Dashboard Templates
Using Google Sheets dashboard templates effectively requires following best practices. Start by choosing a template that closely matches your needs and customize it to fit your business requirements. Ensure that the data is well-organized and that the dashboard layout highlights key metrics. Regularly update the dashboard to keep the information current and relevant. Involve your sales team in the process, ensuring they understand how to use the dashboard and interpret the data. By following these best practices, you can maximize the value of your Google Sheets dashboard and drive better sales performance.
Maximizing the Use of Free Google Sheets Templates
Free Google Sheets templates can be a valuable resource for setting up your sales dashboard. To make the most of these templates, start by selecting ones that align with your specific needs. Customize the templates to include the most relevant metrics and KPIs for your sales team. Take advantage of the pre-built charts and formulas to save time and ensure accuracy. Regularly review and update the templates to keep them relevant to your current sales strategies. By effectively using free templates, you can create a powerful sales dashboard without investing significant time or resources.
Case Studies and Examples – Sales Dashboard Template
Real-World Applications of Sales Team Dashboards
Sales team dashboards have been successfully implemented across various industries to improve performance and drive sales growth. For example, a retail company used a Google Sheets sales dashboard to track daily sales and monitor inventory levels, leading to better stock management and increased sales. A SaaS company utilized a sales performance dashboard to analyze lead conversion rates and optimize their sales process. These real-world examples demonstrate the versatility and effectiveness of sales dashboards in different business contexts. By learning from these applications, you can implement similar strategies to enhance your own sales operations.
Learning from Successful Sales Dashboards
Successful sales dashboards provide valuable lessons on how to track and analyze sales performance effectively. For instance, a well-designed dashboard will highlight the most critical metrics, such as monthly sales and win rates, making it easy to identify trends and areas for improvement. Companies that have successfully implemented sales dashboards often share common practices, such as regular data updates and involving the sales team in the dashboard setup process. By studying these successful examples, you can adopt best practices and avoid common pitfalls, ensuring that your sales dashboard is both effective and impactful.