Introduction to Sales Team Dashboards in Power BI
What is a Sales Team Dashboard in Power BI?
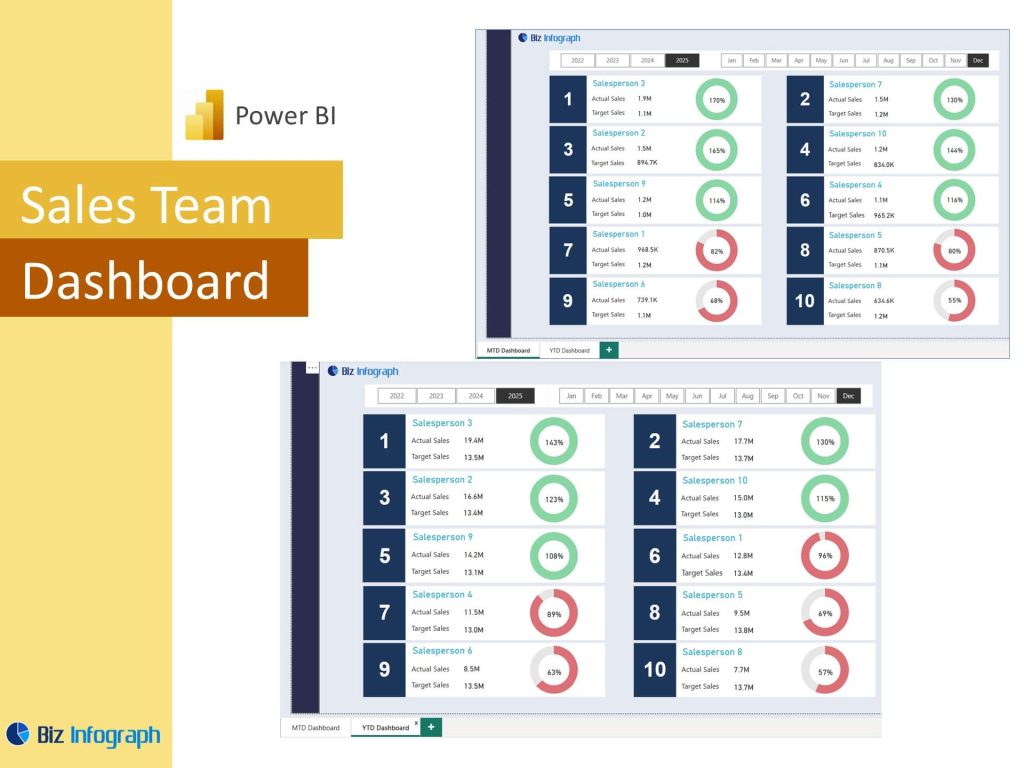
A Sales Team Dashboard in Power BI is a dynamic tool designed to visualize sales data and track team performance against targets. It consolidates key sales metrics such as revenue growth, sales by region, and sales pipeline health into an easily digestible format. The purpose of the dashboard is to help sales reps and managers monitor progress, business intelligence, identify trends, and make adjustments in real-time. Using Microsoft Power BI offers the flexibility to pull data from various systems, connect it to dashboards, and display meaningful insights with just a few clicks. A well-designed dashboard is critical for maintaining sales momentum.
Importance of Sales Dashboards for Team Performance
Tracking sales team dashboard performance is crucial for achieving strategic goals. A sales performance dashboard helps managers assess individual and team contributions, pipeline status, and lead conversions. It removes the need for manual data analysis by automating updates and insights. A robust sales dashboard for your business also promotes transparency, keeping every sales representative aware of their contributions toward sales goals. Dashboards that are interactive and dynamic encourage collaboration, healthy competition, and accountability within teams. Whether tracking overall sales or sales to date, a Power BI dashboard ensures all efforts are aligned with broader sales strategies.
Key Benefits of Using Power BI for Sales Analytics
Power BI provides a superior platform for sales teams by offering advanced data visualization, real-time updates, and scalability across departments. Power BI sales analysis dashboards support deep-dive reporting into sales conversion cycles, customer segmentation dashboards, and spend analysis dashboards. With its seamless integration of data source to Power BI, teams can easily view revenue trends, top-performing regions, and key customer profiles. Furthermore, Power BI supports automated refreshes and publishing through Power BI Service, ensuring data is always current. These capabilities help optimize your sales activities and support data-driven strategic planning.
Core Components of a Sales Team Performance Dashboard
Essential Sales Metrics and KPIs to Track
To effectively manage sales operations, tracking the right sales metrics is essential. Metrics like sales to date, pipeline coverage, average deal size, and product sales help evaluate the overall sales performance. By using Power Query Editor to transform raw data, Power BI users can create calculated fields for advanced metrics such as win rates or deal cycle lengths. A sales analytics dashboard should highlight these key performance indicators clearly, making it easier for teams to understand where they stand and what actions are needed to improve your sales.
Visualizing Team and Sales Pipeline Performance
An effective sales pipeline visualization offers a snapshot of leads at various stages, helping sales managers optimize your sales processes. An interactive dashboard allows users to drill down by opportunity size, region, or representative. Power BI templates come equipped with these views, minimizing setup time. Using data with Power BI, companies can easily monitor deal progression, analyze bottlenecks, and forecast revenue more accurately. Dashboard provides an overview that helps sales teams identify the health of their pipeline and prioritize high-value opportunities, which is key to driving sustained growth.
Integrating Customer Analysis and Marketing Campaign Data
A winning sales strategy integrates insights from both customer behavior and marketing efforts. By connecting data from sources like a google ads dashboard, facebook ads dashboard, or social media dashboard, companies gain full visibility into campaign effectiveness and lead quality. Combining these marketing insights with a customer analysis dashboard provides a 360-degree view of customer acquisition and retention. With Power BI dashboard examples including cross-functional datasets, teams can evaluate how different marketing strategies impact pipeline growth and customer conversions, enhancing the alignment between marketing and sales operations.
Designing and Building an Interactive Power BI Dashboard
How to Create a Power BI Dashboard for Sales Teams
To create a Power BI dashboard, begin by identifying the KPIs critical to your sales organization. Then, connect your data using Power Query and model it appropriately. Once your power bi data is cleaned and structured, use built-in visuals like clustered column charts, KPI cards, and funnel charts to present the insights. Remember, the dashboard is designed to help users quickly interpret data and act. Consider using bookmarks, slicers, and drill-through features to make the experience interactive. Following a basic Power BI course can significantly speed up the learning curve for those new to the platform.
Power BI Templates and Examples for Sales Analysis Dashboards
Starting with Power BI templates can dramatically accelerate your dashboard development. Many sales dashboard templates include prebuilt pages for revenue tracking, sales analysis, and lead scoring. Some of the best Power BI dashboard examples come with dynamic filters, trend analyses, and scenario modeling capabilities. These templates allow users to simply plug in their own data from various systems and customize visuals accordingly. For instance, examples of Power BI dashboards often include lead pipeline analysis, revenue comparisons by product, and regional breakdowns, all of which can be repurposed for different industries or team structures.
Best Practices for Interactive and Insightful Dashboard Design
Effective dashboards are clean, intuitive, and focused. Prioritize essential KPIs and use consistent color schemes to enhance readability. Group related information together—for example, group pipeline data separately from closed-won revenue. Use hierarchy drilldowns and dynamic tooltips to provide depth without clutter. Always keep the purpose of the dashboard in mind: to drive faster, smarter decisions. Power BI offers great tools for creating interactive dashboards, but always test usability and load times before rollout. Good bi reporting requires dashboards to be responsive across devices—desktop, tablet, and mobile—through Power BI Service.
Examples and Use Cases of Sales Dashboards in Power BI
Great Power BI Dashboard Examples for Sales Teams
Some of the great Power BI dashboard examples include dashboards that track overall sales, monthly pipeline growth, and win/loss ratios. A Power BI sales analysis dashboard might also highlight team performance by individual sales representatives, offering both a micro and macro perspective. These examples showcase not only raw numbers but also actionable insights that sales managers can use for coaching and territory planning. Reviewing best power BI dashboard examples provides inspiration and proven frameworks for designing impactful dashboards that enhance operational efficiency.
Comparing Sales, Finance, and HR Dashboards
While a sales dashboard focuses on revenue generation and pipeline management, a power bi finance dashboard prioritizes margins, profitability, and cash flow, and an HR dashboard tracks recruitment, retention, and employee performance. Each dashboard serves different audiences but can share consistent design principles for clarity and actionability. In organizations where cross-departmental collaboration is key, linking dashboards—such as pulling data from a finance dashboard into a sales dashboard—can provide strategic business insights. Power BI dashboard examples include multi-department frameworks that unify finance, HR, and sales KPIs for executive review.
Using BI Reporting to Drive Data-Driven Decisions
BI reporting through Power BI is a transformative step for organizations aiming to make data-driven decisions. By utilizing sales dashboards, companies can move from reactive management to proactive strategy planning. Utilizing Power BI allows for customized reporting schedules, real-time collaboration, and interactive visual exploration of trends. Sales teams can spot gaps early, marketing can optimize spend, and finance can adjust forecasts—all thanks to fast, accurate, and insightful reporting. As businesses scale, next Power BI report iterations become easier, thanks to the robust architecture and reusable templates built into the platform.
Leveraging Power BI Service for Ongoing Sales Success
Using Power BI Data and Reports for Continuous Improvement
One of the biggest advantages of using Power BI Service is the ability to schedule automatic data refreshes and share insights securely across teams. With live dashboards, managers can monitor sales team performance continuously and adjust tactics as needed. Power BI data can be used to establish historical benchmarks, setting smarter goals for the future. Whether tracking sales to date, regional growth, or pipeline aging, ongoing access to updated metrics ensures that decisions are based on data, not assumptions.
Enhancing Collaboration and Accessibility with Power BI Service
Collaboration is a major strength of Power BI Service. Dashboards can be published to workspaces, shared via Teams, and even embedded into other applications for seamless access. Mobile access ensures sales managers and representatives can track sales analytics on the go. Scheduled alerts and user-specific filters allow individuals to focus only on their relevant data. Whether it’s the VP of Sales monitoring sales performance or a sales representative checking their monthly quota, dashboard allows easy, personalized access for improved collaboration across the sales organization.
Future Trends: Advanced Sales Analytics Dashboards
As sales analytics evolves, dashboards will increasingly incorporate predictive modeling, AI-powered insights, and automated recommendations. Future sales analysis dashboards will not just reflect past performance—they’ll suggest actions to optimize deals in progress. Integrations with social media dashboards, CRM platforms, and customer segmentation dashboards will deepen insights into buyer behavior. Power BI supports AI features like natural language queries and machine learning models, which will redefine how companies use data to drive sales strategies. Investing today in a strong dashboard framework ensures readiness for tomorrow’s analytic advancements.
For ready-to-use Dashboard Templates: