Introduction to Sales Dashboard Template in Google Sheets
What is a Sales Dashboard?
A sales dashboard is a powerful tool used to visualize and track the performance of a sales team. By integrating key metrics (KPIs) such as total deals, win ratio, and conversion rate per country, businesses can make data-driven decisions. Sales performance dashboards in Google Sheets offer real-time updates, allowing teams to monitor their progress and adjust strategies as needed. This is especially useful for sales management and operations, as it provides a comprehensive view of the sales pipeline. The use of Google Sheets for creating dashboards is advantageous due to its accessibility and ease of use, making it a popular choice for businesses of all sizes.
Benefits of Using a Sales Dashboard Template
Using a sales dashboard template in Google Sheets provides several benefits. Firstly, it saves time by offering a pre-built structure that can be customized to meet specific needs. Secondly, it enhances data visualization, allowing teams to quickly interpret sales data through interactive charts and graphs. Thirdly, a Google Sheets sales dashboard can be easily shared across the team, ensuring everyone has access to up-to-date information. Additionally, these templates often come with automation features that streamline data updates, reducing the manual effort required to maintain the dashboard. This makes it easier to track sales performance and make informed business decisions.
Features of the Sales Dashboard Google Sheets Template
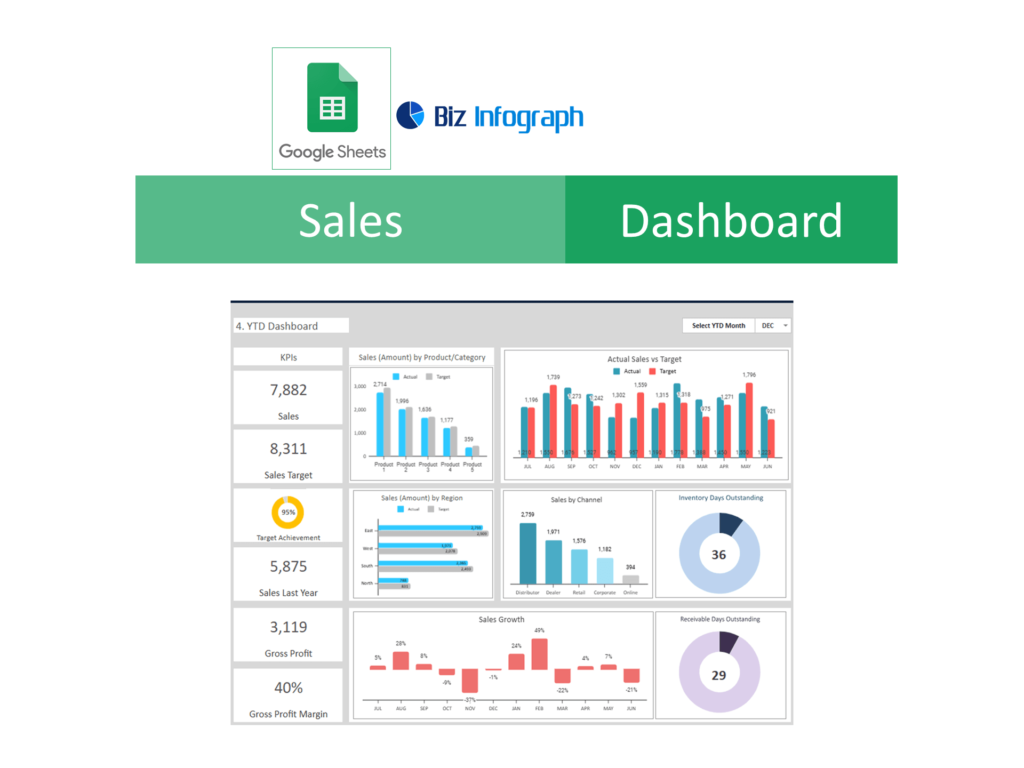
Key Performance Indicators (KPIs) Tracked
A robust sales dashboard template tracks several key performance indicators (KPIs) essential for evaluating sales performance. These include metrics like monthly sales, number of deals, customer lifetime value, and conversion rates. By focusing on these KPIs, sales teams can identify trends and areas needing improvement. The template allows for the inclusion of custom KPIs tailored to specific business needs, ensuring comprehensive performance tracking. Google Sheets dashboards enable users to visualize these KPIs through various chart types, providing clear insights into sales data. This facilitates better sales pipeline management and helps in achieving sales targets.
Interactive and Customizable Charts
The sales dashboard template in Google Sheets offers interactive and customizable charts like bar chart, pie chart, Gantt chart that make data visualization intuitive. Users can create custom graphs to represent sales data, making it easier to identify trends and patterns. These charts can be customized to match the branding and specific needs of the business. Google Sheets also allows for the creation of interactive elements, such as dropdown menus and slicers, which enhance the user experience. This level of customization ensures that the dashboard meets the unique requirements of each sales team, providing actionable insights that drive performance.
Setting Up Your Sales Dashboard in Google Sheets Spreadsheet
Step-by-Step Guide to Building a Sales Dashboard
Building a sales dashboard in Google Sheets involves several steps. First, gather the required sales data from multiple sources and import it into Google Sheets. Next, organize the data into structured formats, using formulas to calculate key metrics. Create charts and graphs to visualize the data, ensuring they are interactive and user-friendly. Customize the dashboard layout to include filters and slicers for easy data manipulation. Finally, set up automation for data updates to keep the dashboard current. This guide ensures that even those new to Google Sheets can create a functional and insightful sales dashboard.
Importing Your Data into Google Sheets
Importing data into Google Sheets can be done manually or through automated processes. Manual data entry involves copying and pasting data from various sources, while automated methods use add-ons or scripts to pull data directly from CRM systems. Google Sheets supports various data import formats, making it versatile for different data sources. Using Google Workspace Marketplace, users can find tools like Coefficient to facilitate data import. This ensures that the sales dashboard is populated with accurate and up-to-date information, providing a solid foundation for analysis and decision-making.
Maximizing Your Sales Performance with Google Sheets
Analyzing Sales Metrics and Trends
Analyzing sales metrics and trends is crucial for improving sales performance. A sales dashboard in Google Sheets allows teams to track key metrics such as monthly sales, win ratios, and conversion rates. By visualizing these metrics through interactive charts, sales teams can identify trends and patterns that inform strategic decisions. For example, tracking the conversion rate per country can highlight high-performing regions, enabling targeted marketing efforts. Additionally, forecasting future sales based on historical data helps in setting realistic sales goals. This data-driven approach ensures that sales strategies are aligned with performance insights.
Using Google Sheets for CRM and Marketing Dashboards
Google Sheets is not just for sales dashboards; it can also be used to create comprehensive CRM and marketing dashboards. By integrating CRM data, teams can track customer interactions, manage sales pipelines, and analyze customer lifetime value. Marketing dashboards can track campaign performance, measuring key metrics such as click-through rates and conversion rates. The flexibility of Google Sheets allows for the customization of these dashboards to meet specific business needs. This unified approach to data management ensures that all aspects of sales and marketing are aligned, providing a holistic view of business performance.
Free Google Sheets Dashboard Templates
Overview of Available Templates
Google Sheets offers a variety of free dashboard templates designed to meet different business needs. These templates range from sales dashboards to marketing and project management dashboards. Each template comes with pre-built charts and formulas, making it easy to get started. The templates can be customized to suit specific requirements, providing flexibility and ease of use. By using these free templates, businesses can save time and resources while still benefiting from powerful data visualization and analysis tools. This makes Google Sheets an ideal choice for businesses looking to implement dashboards quickly and efficiently.
How to Use Pre-Built Sales Dashboard Templates
Using pre-built sales dashboard templates in Google Sheets is straightforward. Start by making a copy of the template to your Google account. Next, import your sales data into the template, ensuring it matches the required format. Customize the template by adjusting the charts and metrics to reflect your business needs. Set up automation for data updates to keep the dashboard current. Finally, share the dashboard with your team to ensure everyone has access to the latest information. These templates provide a quick and easy way to create a professional sales dashboard without the need for extensive customization. Users can download suitable Excel dashboard templates and convert to Google Sheets.
Advanced Analytics and Automation
Automating Data Updates and Reports
Automating data updates and reports in Google Sheets can significantly enhance productivity. By using tools like Google Apps Script or add-ons available in the Google Workspace Marketplace, teams can set up scheduled data refreshes. This ensures that the sales dashboard always reflects the most current data. Automation also extends to generating reports, where scripts can be written to create and distribute reports at regular intervals. This reduces the manual effort required to maintain the dashboard and ensures that the sales team always has access to up-to-date information, enabling more timely and informed decision-making.
Creating Interactive Sales Dashboards with Google Sheets
Creating interactive dashboards in Google Sheets involves adding elements like dropdown menus, slicers, and interactive charts. These features enhance the user experience by allowing users to filter and manipulate data directly within the dashboard. For example, a sales dashboard can include slicers to filter data by date range, product category, or sales region. Interactive charts can be created to dynamically update based on user selections. This level of interactivity makes it easier for sales teams to explore data and gain insights. Google Sheets’ flexibility in customization ensures that the dashboard meets the specific needs of the business.
Case Studies and Examples
Real-World Applications of Sales Dashboards
Sales dashboards have been successfully implemented across various industries to track performance and improve sales strategies. For example, a small business might use a Google Sheets sales dashboard to track daily sales and identify top-selling products. An e-commerce store could use the dashboard to analyze customer purchase behavior and optimize marketing campaigns. These real-world applications demonstrate the versatility and effectiveness of sales dashboards in driving business growth. By providing actionable insights, these dashboards help businesses make informed decisions, optimize sales processes, and achieve better results.
Success Stories from Businesses Using Google Sheets
Many businesses have reported significant improvements in sales performance after implementing Google Sheets dashboards. For instance, a retail company increased its sales by 20% by using a sales dashboard to track key metrics and identify underperforming areas. A tech startup used a Google Sheets CRM dashboard to manage its sales pipeline, resulting in a 30% reduction in lead response time. These success stories highlight the impact of using Google Sheets for sales tracking and analysis. By leveraging the power of data visualization and automation, businesses can streamline their sales operations and achieve their goals more efficiently.
Tips and Best Practices for Sales KPI Dashboard Template
Best Practices for Building a Sales Dashboard
Building an effective sales dashboard involves following several best practices. Start by clearly defining the key metrics you want to track, ensuring they align with your business goals. Use consistent data formats and structures to facilitate accurate analysis. Customize the dashboard to reflect your brand and specific needs, but avoid overcomplicating the design. Ensure the dashboard is user-friendly, with interactive elements that make it easy to explore data. Regularly review and update the dashboard to keep it relevant. Following these best practices will help you create a sales dashboard that provides valuable insights and drives performance.
Tips for Effective Sales Performance Tracking
Effective sales performance tracking requires a systematic approach. Begin by setting realistic sales targets and KPIs that are measurable and achievable. Use a sales dashboard to monitor these metrics regularly, identifying trends and patterns. Leverage automation to keep the dashboard up-to-date and reduce manual data entry. Use the insights gained from the dashboard to adjust your sales strategies and address any issues. Engage your sales team in the process, ensuring they understand the metrics and how they impact performance. By consistently tracking and analyzing sales performance, you can make informed decisions and drive continuous improvement.