Introduction to Sales KPI Dashboards in Power BI
What is a Sales KPI Dashboard?
A Sales KPI Dashboard is a visual tool that consolidates and displays key performance indicators related to sales metrics, activities, and outcomes. Built using Power BI, this dashboard is designed to offer actionable insights into sales revenue, sales opportunities, and team activities. Unlike traditional reports, a Power BI KPI dashboard offers dynamic updates, real-time filtering, and drill-down capabilities that make it easier to track performance trends. The dashboard provides a visual snapshot of important data points like total revenue, conversion rates, and pipeline health, allowing sales managers and sales reps to make informed strategic decisions quickly.
Importance of Tracking Sales KPIs in Power BI
Tracking KPIs like sales growth, deal closure rates, and the number of sales opportunities is essential for understanding the health of a business’s sales operations. A kpi dashboard in power bi enables teams to not only monitor these metrics but also identify bottlenecks and areas for improvement. Power BI’s visualization capabilities ensure that these KPIs are easy to interpret, making it simple for managers to track their sales team’s progress against targets. In a competitive market, consistent monitoring ensures that any deviations in performance are caught early, and strategic adjustments can be made swiftly to boost results.
Benefits of Using Microsoft Power BI for KPI Dashboards
Power BI is a dynamic and flexible tool that simplifies the creation of highly interactive and insightful dashboards. Using Power BI templates and dashboard examples, users can rapidly develop comprehensive KPI dashboards without needing extensive coding expertise. Power BI dashboard examples also offer templates tailored for sales operations, finance, marketing, and more. With features like Power BI reports, scheduled refresh, and integration into Power BI Service, organizations gain the ability to share live dashboards securely across teams. This collaborative environment enhances decision-making and allows sales managers to track their sales initiatives in real-time across devices.
Core Components of a Sales KPI Dashboard
Key Sales Metrics and KPIs to Monitor
An effective sales dashboard must monitor KPIs such as overall sales, sales leads generated, revenue achieved, conversion rates, product sales, and average deal size. These sales kpis form the foundation for understanding and improving sales performance. Dashboard contains real-time figures that showcase pipeline health, and allows managers to monitor how close the team is to achieving its sales goals. Tracking these metrics over time also reveals sales trends across different products, regions, or customer segments, providing critical input for adjusting sales strategies. Dashboard provides a comprehensive view of all critical metrics necessary for effective decision-making.
Essential Elements of a KPI Dashboard in Power BI
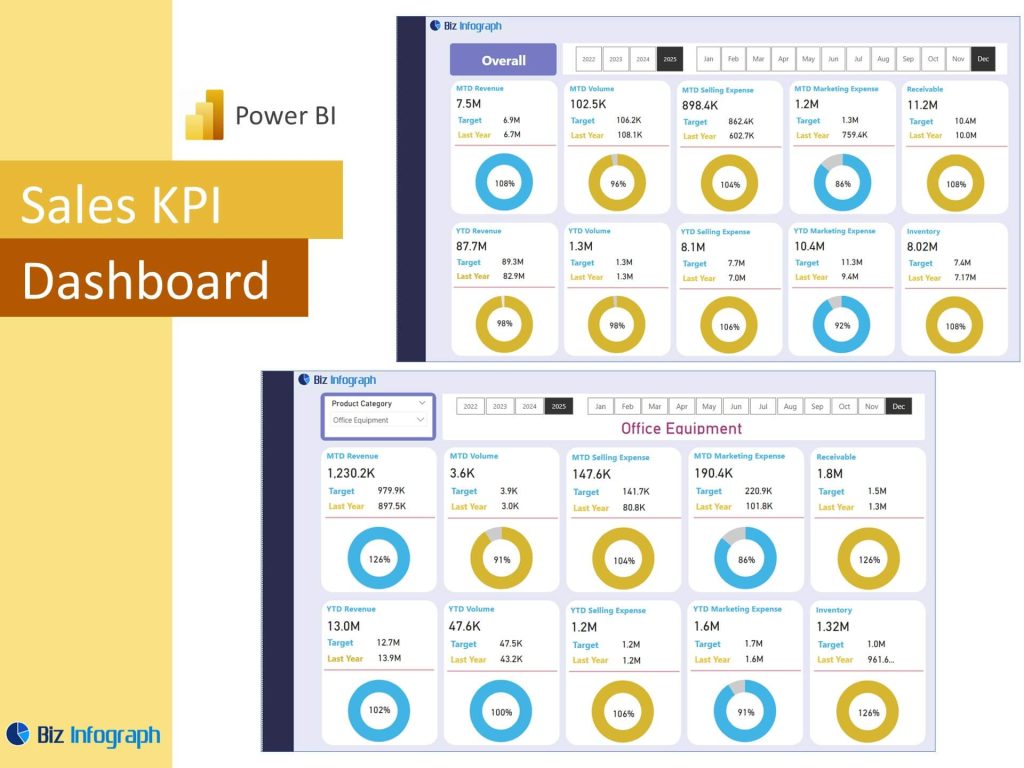
Key elements that make a power bi kpi dashboard effective include KPI cards, trend lines, gauge visuals, dynamic filters, and drill-down capabilities. Each component contributes to a rich user experience that is focused on clarity and usability. A good dashboard design ensures that high-priority KPIs are prominent, and dashboard features like tooltips and slicers enhance interactivity. Dashboard offers flexibility in customizing layouts and visual hierarchies, allowing each user to view information most relevant to their role. Incorporating kpi definitions within tooltips or side panels further helps users understand what each KPI measures and why it matters.
Visualizing Sales Pipelines and Team Performance
The sales pipeline is one of the most critical aspects of any sales operation. A sales performance dashboard should visualize sales data from prospecting to closure, showing win rates, average sales cycles, and potential revenue at each stage. A well-structured dashboard displays this flow visually—whether through funnel charts, segmented bar charts, or opportunity matrices—giving managers instant clarity on where deals are stalling or succeeding. The dashboard should also break down performance by sales representatives, allowing you to track individual contribution to sales efforts and highlight top performers. This supports both coaching and resource allocation.
Building a Sales KPI Dashboard in Power BI
Choosing the Right Power BI Template for KPI Tracking
Selecting the right Power BI template can dramatically speed up the dashboard development process. Templates for Power BI typically include ready-to-use visualizations tailored for sales analytics, sales trends across periods, and customer segmentation. Great templates prioritize user experience, presenting KPIs clearly and logically. Whether you’re tracking sales opportunities or overall pipeline velocity, dashboard examples from the Power BI community offer a wealth of inspiration. Using a pre-built template reduces the technical burden and ensures alignment with best practices for data visualization, allowing Power BI users to focus more on insight generation.
How to Create a KPI Dashboard in Power BI
To create a KPI dashboard in Power BI, start by connecting your sales data using Power Query. Cleanse and transform the data using the Power Query Editor to transform tables into an efficient data model. Select visuals that match your KPIs—such as card visuals for sales revenue, funnel charts for opportunities, and line graphs for sales trends. Layout should prioritize the most important KPIs at the top for quick executive viewing. Filters, slicers, and bookmarks should enhance interactivity. Finally, publish the dashboard to Power BI Service for real-time sharing and collaboration across your sales team.
Best Practices for Effective KPI and Performance Dashboards
Following best practices ensures that your kpi dashboard in power bi is both useful and impactful. Key tips include:
- Keep the dashboard clean and uncluttered.
- Focus on 5-7 core KPIs at a time.
- Use consistent color schemes for easy recognition.
- Add trend indicators to show performance changes over time.
- Include historical benchmarks where possible.
- Design for mobile compatibility if needed.
A good performance dashboard should highlight actionable insights, not overwhelm users with unnecessary data. Ensuring dashboard reflects the latest data with auto-refresh settings improves reliability and user trust.
Examples and Use Cases of Sales KPI Dashboards
Real-World Examples of Power BI Sales KPI Dashboards
Examples of Power BI KPI dashboards in the real world include dashboards that track sales representatives by region, win/loss ratio dashboards, sales pipeline efficiency dashboards, and sales growth over time. Many organizations also combine sales with financial dashboards to align revenue projections with cash flow forecasts. These real-world dashboard examples showcase the diversity and flexibility of Power BI sales dashboards. By reviewing how top organizations structure their dashboards, you can find valuable insights into layout, KPI selection, and storytelling techniques that resonate with decision-makers.
Using KPI Dashboards to Drive Sales Insights and Analytics
A strong KPI dashboard doesn’t just track numbers—it unlocks actionable sales insights. For example, if the dashboard shows a sudden drop in conversion rates for a product line, sales teams can pivot their strategy quickly. KPI dashboards also help refine sales strategies by spotlighting trends such as peak lead generation periods or underperforming territories. Sales analytics tools like Power BI enable deeper drilling into these trends, allowing businesses to optimize not just team performance, but also product offerings, pricing strategies, and go-to-market plans.
Comparing KPI Dashboards with Other Management Dashboards
While a sales KPI dashboard focuses on metrics tied to selling activities, other dashboards—such as an insights dashboard, financial dashboard, or management dashboard—cover broader organizational health indicators. In contrast to HR dashboards or marketing-focused dashboards (like social media dashboards and facebook ads dashboards), a sales KPI dashboard is narrower but deeper. It offers targeted insights into sales figures, pipeline health, lead generation, and sales efforts. Dashboard provides an overview for sales, but when combined with broader business metrics, it delivers a holistic view of company performance.
Advanced Tips for Optimizing KPI Dashboards in Power BI
Leveraging Power Platform for Enhanced KPI Reporting
The Power Platform, consisting of Power BI, Power Apps, and Power Automate, allows businesses to go beyond visualization. For example, you can integrate alerts that trigger emails when sales revenue drops below a threshold or automate KPI refreshes from your CRM system. Power BI’s visualization and automation capabilities provide unmatched flexibility. Leveraging the full Power Platform ecosystem helps dashboard allows immediate reactions based on KPI changes, improving agility and responsiveness in dynamic markets.
Improving Sales Team Management Through KPI Analysis Dashboards
KPI dashboards empower sales managers to monitor sales team’s performance effectively. With drill-through analysis available in Power BI reports, managers can compare regions, territories, and individuals side by side. Visual breakdowns of product sales, sales figures, and closed/won ratios can pinpoint training needs or recognize high performers. Dashboards help in setting realistic sales targets and driving accountability across teams, reinforcing a culture of performance and continuous improvement based on real data.
Future Trends: Smarter KPI Dashboards with Power BI Innovations
As Power BI evolves, we’re seeing the rise of AI-driven recommendations, natural language query capabilities, and predictive forecasting embedded directly within KPI dashboards. Future sales KPI dashboards will not just show current status, but predict future outcomes—offering suggested actions to close deals faster. Expect to see smarter integrations with bi tools, better support for sales analytics, and even more seamless connectivity to third-party data platforms. Organizations embracing these innovations today will be better positioned for long-term growth.
Use Power BI to build a management dashboard that offers powerful business intelligence, analyze sales, identify trends with a line chart, follow best practices, conduct data analysis, and increase sales efficiently.
For ready-to-use Dashboard Templates: