Introduction to the Intersection of Row and Column in Excel
Overview of Rows and Columns in a Spreadsheet
In Microsoft Excel, a spreadsheet is made up of rows and columns. A row runs horizontally across the screen, while a column runs vertically. Each row and column has a unique identifier: rows are numbered (e.g., 1, 2, 3) and columns are labeled alphabetically (e.g., A, B, C). Understanding how these elements interact is essential for navigating and using Excel efficiently. The intersection of a row and column forms a cell, which is where data is entered. The location of a cell in a worksheet is referred to as a cell reference, such as A1, which indicates the cell at the intersection of column A and row 1.
Importance of Understanding the Intersection in Excel
Understanding the intersection of rows and columns is fundamental when working with data in Excel. Each intersection forms a rectangular box, or cell, that holds data like numbers, text, or formulas. Knowing how to efficiently navigate these intersections allows you to work with large datasets, create formulas, and automate tasks. This skill is essential for data entry, calculations, and analysis. Whether you’re tracking finances, managing projects, or analyzing data, mastering how to use the intersections of rows and columns will help you get more done in less time and improve productivity in Excel.
What is the Intersection of a Row and Column?
Defining the Intersection: The Cell
The intersection of a row and a column in Excel is called a cell. This is the most basic unit of a worksheet where data is stored. Each cell is identified by its cell reference, such as A1 or B2, which refers to the intersection of column A and row 1, or column B and row 2. This rectangular box can contain text, numbers, or formulas. Cells in Excel can also be used to create tables, where each column in a table represents a different type of data. The value at the intersection of these rows and columns is what users work with in most tasks.
The Role of a Cell in a Worksheet
A cell in an Excel worksheet is the foundational element for storing and manipulating data. The intersection of a columns and a row provides the structure that allows for data organization, calculations, and analysis. Each cell in a worksheet can contain static data, such as text or numbers, or dynamic data, such as a formula that calculates values based on other cells. For example, a formula in A1 can reference data in A2, creating interconnections across the worksheet. Cells are essential for tracking and analyzing data in Excel, and understanding how to navigate them will help you use the platform more effectively.
H3: The Rectangular Box at the Intersection
The rectangular box at the intersection of row and column is called a cell. It is where data is entered, and its location is identified using a cell reference. The cell reference consists of the column letter and row number, such as B5 (where B is the column and 5 is the row). Excel uses this system to help you organize and manipulate data. For example, you can input a formula that adds the values in cells A1 and B1, and Excel will return the result in another cell. Understanding how this box functions is crucial for working efficiently in Excel.
Working with the Intersection of Rows and Columns
Using Formulas and Functions with Cells
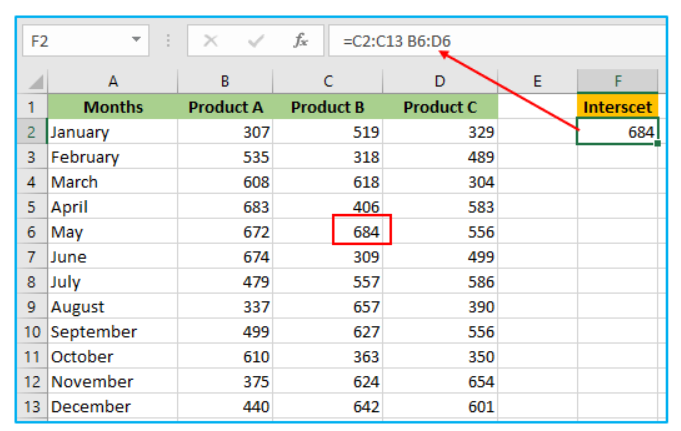
In Excel, you can use formulas and functions to manipulate the data within a cell or across multiple cells. For example, you might use a formula to identify the intersection of two datasets by calculating the sum, average, or count of the values at the intersection of specific rows and columns. Excel’s built-in functions like SUM, AVERAGE, and VLOOKUP rely on cell references to operate. For example, if you have data in cells A1 through A5, using the formula =SUM(A1:A5) will return the total of the values in these cells. Mastering formulas allows you to automate calculations and get more done in less time.
How to Reference a Cell in Excel
In Excel, referencing a cell involves identifying the intersection of a row and column using a cell reference. The column letter and row number are combined to reference a specific cell. For instance, A1 refers to the cell where column A and row 1 intersect. This method of referencing cells is crucial when writing formulas or functions that involve multiple cells. You can also reference ranges of cells, such as A1
, which includes all the cells from A1 to A5. Excel allows for more complex cell referencing, such as referencing cells across worksheets, improving your ability to manage and analyze data.
Navigating the Spreadsheet Using Rows and Columns
Navigating a spreadsheet effectively in Excel involves understanding how to move between rows, columns, and cells. You can use your mouse to select individual cells or ranges by clicking on the rectangular box formed at the intersection of a row and column. Alternatively, you can use keyboard shortcuts like the arrow keys to move from one cell to another. Knowing how to quickly navigate through columns and rows is essential for working with large datasets, as it allows you to jump between data points without losing your place. Excel also offers the ability to freeze rows or columns, which makes managing large spreadsheets easier.
Practical Applications of Cell Intersections in Excel
Data Entry and Organization
The intersection of a row and column forms the basic unit where data is entered and stored in Excel. Each cell can hold various types of data, such as numbers, text, or formulas, which allows you to organize your spreadsheet efficiently. For instance, you can create an Excel table where each column in the table represents a category, and each row contains related data points. This structure ensures that your data is easy to understand and manipulate. Organizing data by using these intersections makes it easier to sort, filter, and analyze, improving the overall usability of your spreadsheet.
Analyzing Data Using the Intersection of Rows and Columns
Analyzing data in Excel often involves working with points the intersection of rows and columns to extract insights. For example, you might use a worksheet function like VLOOKUP or INDEX to return the value at a specific intersection. These functions allow you to retrieve data based on the relationship between different rows and columns. If you’re working with large datasets, using Excel’s powerful formulas and functions to find, compare, and analyze data across cells can significantly streamline your analysis process. This capability is especially useful for financial analysis, sales tracking, or any task requiring precise data comparison.
Formatting the Intersection of Rows and Columns for Better Clarity
Formatting the intersection of rows and columns in Excel can make your data more readable and visually appealing. You can adjust the formatting of individual cells or entire rows and columns to highlight important data. For instance, using bold fonts, background colors, or borders around cells at key intersections can draw attention to important values or calculations. Conditional formatting allows you to automatically apply styles based on the data within a cell, such as highlighting cells that contain numbers higher than a certain value. Proper formatting not only makes your worksheet easier to understand but also helps you get more done in less time by making key data points more accessible.
Conclusion: Mastering Cell Intersections for Better Efficiency
Summary of Key Concepts About Cells in Excel
Understanding the intersection of a row and column in Excel is essential for efficient data management and analysis. The cell is the fundamental building block of any Excel worksheet, and mastering how to reference, manipulate, and format cells can significantly enhance your productivity. From using formulas and functions to automate calculations, to organizing and formatting your data, learning how to effectively work with cells and ranges is crucial for making the most of Excel’s capabilities. Knowing how to work with these intersections is key to becoming proficient in MS Excel.
Enhancing Productivity by Understanding Rows, Columns, and Their Intersection
By mastering how to navigate and use the intersection of the rows and columns, you can significantly improve your workflow in Excel. Whether you’re entering data, running complex analyses, or automating repetitive tasks, understanding the relationship between rows, columns, and cells allows you to work faster and with greater accuracy. This knowledge also enhances your ability to troubleshoot and solve issues in your spreadsheets, such as formula errors or misaligned data. Ultimately, knowing how to efficiently use Excel’s rows, columns, and cells will allow you to get more done in less time, making you a more effective user of this powerful tool.
For ready-to-use Dashboard Templates: