Introduction to HR Training Dashboards
What is an HR Training Dashboard?
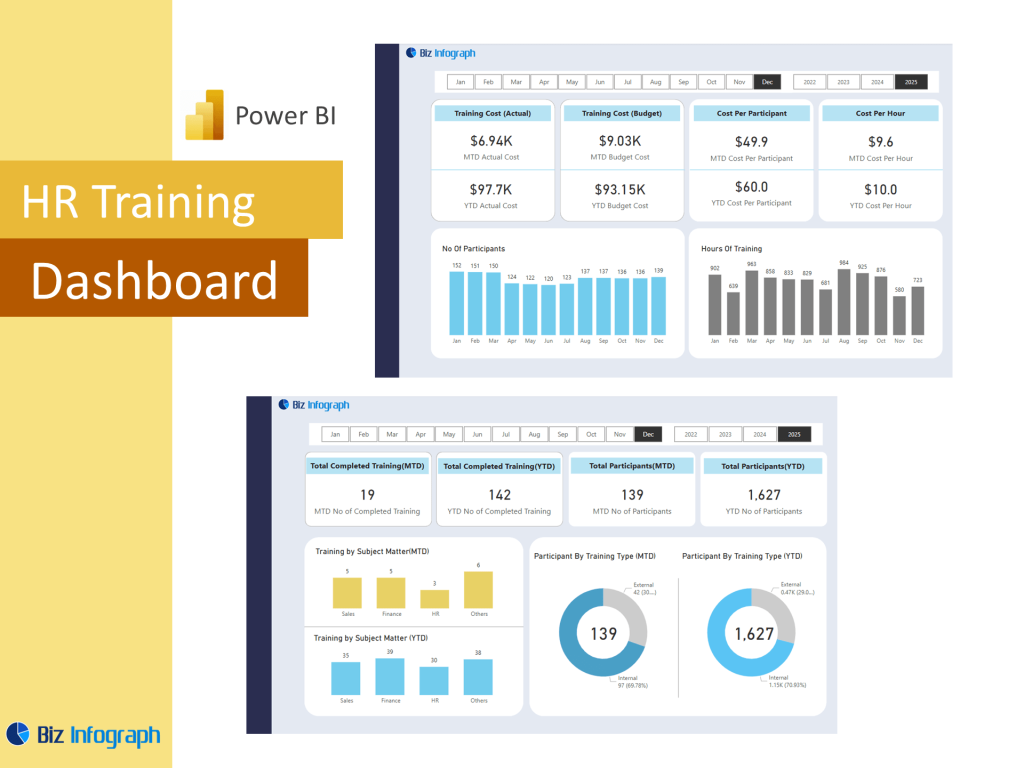
An HR Training Dashboard is a specialized dashboard in Power BI designed for the HR department to track, analyze, and optimize employee training and development programs. This dashboard provides a comprehensive overview of metrics like training completion, costs, hours per employee, and course effectiveness. Whether part of a broader HR dashboard template or a standalone HR Power BI Dashboard, it helps HR professionals and learning teams visualize participation rates, gaps, and ROI. When using Power BI, HR teams can create real-time reports and dashboards from multiple data sources, integrating employee records, LMS data, and performance systems to improve HR processes and workforce development initiatives.
Benefits of Using Power BI for HR Training Analytics
Power BI’s flexibility, scalability, and ease of use make it ideal for training analytics. It allows HR professionals to make data-driven decisions by turning complex data into actionable insights through intuitive dashboard features and interactive visuals. By using Power BI, organizations can monitor training trends, forecast future needs through predictive analytics, and align training and development initiatives with business outcomes. Integrated with the HR system, a Power BI HR dashboard offers role-based access and auto-refresh options through Power BI service, enabling secure and timely access to key training KPIs. This dashboard helps link learning to performance, supporting long-term HR strategies.
How HR Dashboards Provide Actionable Insights
HR Training dashboard power BI provide actionable insights by consolidating disparate employee data, learning metrics, and engagement figures into one centralized dashboard using Power BI. When connected with an organization’s HR system, it extracts data using Power Query, cleanses it, and applies data modeling to visualize participation, outcomes, and skill progression. These dashboards and reports enable HR managers to pinpoint gaps in training, track high performers, and ensure compliance with industry standards. Power BI can transform raw data into real-time data insights, highlighting not only who completed the training but also its impact on employee performance, helping to optimize programs and transform your HR approach.
Building an HR Training Dashboard in Power BI
Key Features of an Effective HR Power BI Dashboard
A high-impact HR Power BI dashboard for training incorporates a range of dashboard features that allow HR leaders to drill down into key HR metrics like training cost, completion rates, training by department, and employee progress. A truly effective dynamic HR dashboard is interactive and customizable, letting users filter data by department, job role, date range, or learning module. The best HR dashboard examples also include charts comparing training hours vs. performance reviews, and indicators for overdue or incomplete training. Dashboard creation in Power BI supports customization and self-service options, making it easier for HR professionals to explore trends and use data more effectively.
Data Modeling and Integration from HR Systems
Data modeling is essential for transforming employee data from your HR system into a usable, reliable training dashboard. Power BI connects to multiple data sources, from learning management systems (LMS) to ERP and payroll platforms. Using Power Query, raw data is prepared and modeled to build relationships between courses, users, completion dates, and performance outcomes. This integration enables data analysis at scale while preserving data accuracy and timeliness. For example, linking training completions with HR KPIs like employee turnover or satisfaction scores can help HR teams evaluate the impact of training on retention. With proper data modeling, the dashboard becomes a strategic tool rather than just a report.
How to Create an HR Dashboard Using Power BI
To create an HR dashboard for training in Microsoft Power BI, first define your objectives and the important HR metrics that align with them. Collect training-related data from LMS and HR employee systems, then use Power Query for cleaning and transformation. Apply data analytics logic with data modeling to organize relationships between training courses, completion dates, departments, and feedback scores. Use visuals like bar charts, interactive data cards, and drill-through reports to show completion by age group, department, and tenure. Publish the dashboard using Power BI service for sharing and collaboration. The process not only enhances visibility but also helps HR professionals track learning ROI and provide insights to leadership.
Metrics and Insights for Training Effectiveness
Essential Metrics for HR Training Reporting
A strong HR analytics dashboard for training focuses on key data points that measure reach, impact, and effectiveness. Common HR KPIs include training attendance, completion percentage, time to complete, training cost, and post-training evaluation scores. Including metrics tied to employee performance dashboards helps HR assess the correlation between training and productivity. These KPIs also support HR reporting to stakeholders, offering visibility into the success of internal development initiatives. With Power BI dashboard examples, companies can analyze by demographics, data visualization, tenure, or department to tailor training. These insights help refine delivery methods and allocate budgets based on what’s working across the human resources function.
Using HR Data for Training Analysis and People Analytics
People analytics plays a pivotal role in assessing how training affects outcomes like engagement, retention, and promotion rates. By combining HR data and training metrics in Power BI, organizations can analyze employee learning behaviors across tenure, role, and location. These insights support HR management efforts such as succession planning and leadership development. A well-designed Power BI HR dashboard uses data to show how training reduces employee turnover, enhances skills, employee satisfaction, and drives internal mobility. Advanced analytics tools allow HR to detect trends in completion across groups and tie training to workforce data like promotions, performance ratings, or even sales data, strengthening talent development plans.
Dashboard Examples and Insights from HR Analytics
There are many HR dashboard examples that showcase how training analytics are used in the real world. For example, a Power BI HR dashboard used by a human resources department might display course completion trends across business units alongside budget utilization for each learning program. Another dashboard example may correlate training sessions with a drop in employee turnover or an increase in internal promotions. These dashboards and reports offer valuable insights that support evidence-based HR strategies, allowing HR leaders to adjust programs and scale learning initiatives effectively. They also demonstrate how using data can uncover trends and patterns in employee engagement, learning gaps, and performance.
For ready-to-use Dashboard Templates: