Introduction to HR Termination Dashboards
What is an HR Termination Dashboard?
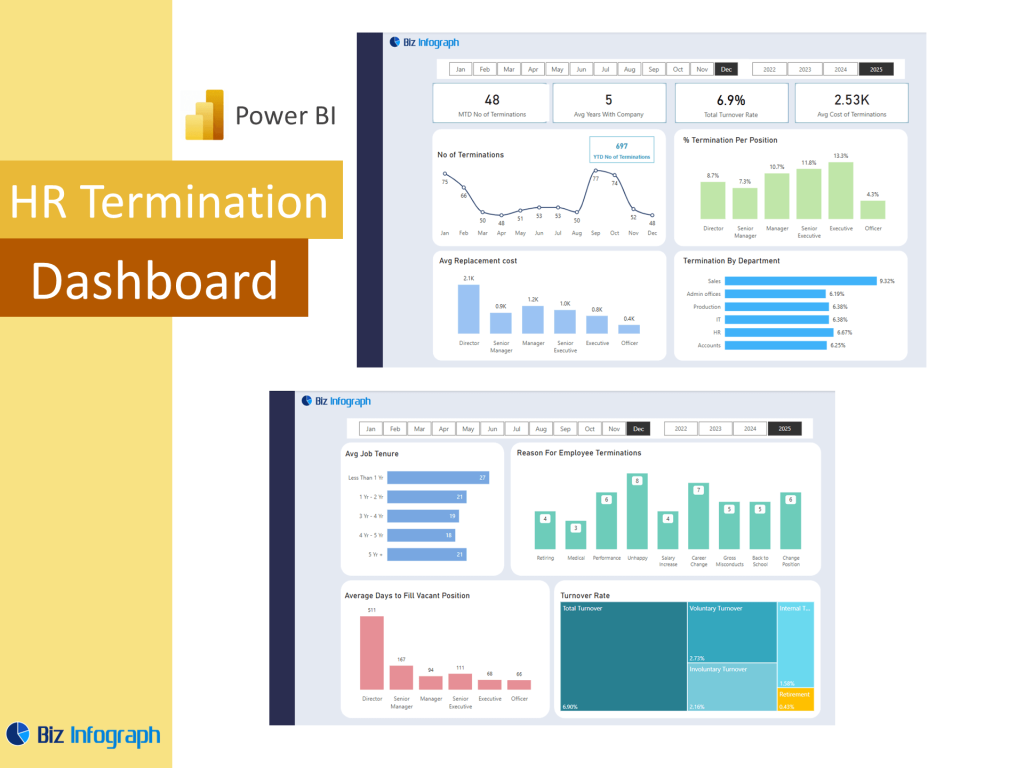
An HR Termination Dashboard Template is a specialized HR analytics dashboard designed to track and analyze employee turnover, resignation trends, and termination analysis across an organization. Built with Power BI HR analytics capabilities, this dashboard provides a centralized view of exit-related data, such as employee tenure, termination reason, attrition rate, and department-specific turnover. A robust Power BI HR dashboard enables HR leaders to spot trends, visualize your data, and make informed decisions to reduce unwanted attrition. These dashboards act as vital tools in HR reporting, giving a real-time snapshot of workforce exits and highlighting areas for improvement in retention and engagement strategies.
Importance of Termination Analysis in HR Management
Understanding why employees leave is a key element of effective HR management. Termination analysis helps HR managers evaluate the effectiveness of HR processes and identify systemic challenges impacting employee satisfaction and retention. By using a dashboard template in Power BI, teams can track voluntary and involuntary turnover, exits by department or manager, and correlate terminations with employee performance metrics or employee attendance. These insights help refine hiring strategies, onboarding experiences, and management training programs. In short, analyzing termination trends using data analytics ensures that the human resources function plays a more strategic, proactive role in shaping organizational culture and reducing unnecessary turnover.
Benefits of Using Power BI for Workforce Analytics
Power BI HR dashboards empower organizations to perform detailed workforce analytics with real-time, visual insights. By leveraging Power BI HR, companies can connect employee details with metrics like employee tenure, job role, and employee productivity, providing context behind each departure. Dashboards created with Power BI HR analytics can uncover the root causes behind employee departures, whether it’s low engagement, mismatched expectations, or management issues. These dashboards visualize data intuitively, enabling HR professionals to see trends at a glance. The integration with Power Query and the ability to work with advanced analytics makes Power BI one of the top business intelligence tools for analyzing employee exit behavior.
Building an Effective Termination Dashboard in Power BI
Key Metrics and KPIs to Track Employee Turnover
An HR termination dashboard must be built around key performance indicators (KPIs) that track turnover and attrition. These HR KPIs include attrition rate, average employee tenure at exit, reason for termination, and rehire eligibility status. A comprehensive dashboard helps HR professionals correlate these KPIs with other important HR dimensions such as department, location, and employee performance dashboard ratings. These metrics allow HR teams to identify trends across roles and units, enabling more targeted retention strategies. Additionally, combining exit data with employee satisfaction scores gives HR leaders a clearer picture of what’s driving turnover and how to improve employee engagement moving forward.
Using Power BI for Data Visualization and Termination Reporting
With its robust data visualization capabilities, Power BI transforms raw exit data into meaningful, easy-to-understand visuals. Whether through pie charts showing terminations by reason or line graphs tracking monthly turnover trends, Power BI HR dashboards enable HR to visualize your data in dynamic ways. The dashboard offers filters by job role, manager, or location, giving HR managers the ability to analyze issues from multiple perspectives. When combined with performance metrics, dashboards created using Power BI for HR can reveal whether underperformers or high-potential employees are leaving, further informing strategic decisions. These analytics dashboards offer powerful, automated termination analysis that’s accessible in real-time.
How to Create an HR Dashboard Using Power BI and Power Query
To create an HR dashboard for terminations, start by collecting relevant data from your HR system, including employee details, reasons for separation, dates of employment, and performance ratings. Use Power Query to clean, merge, and prepare this data for data modeling in Power BI. This step ensures your HR analytics using Power BI is accurate, consistent, and scalable. Once modeled, use interactive visuals like heatmaps or stacked bar charts to highlight departments or time periods with spikes in turnover. Dashboards should also include filters and slicers that allow HR to focus on specific workforce segments or analyze historical trends, offering greater control and depth in analysis.
Insights and Use Cases for HR Leaders
Actionable Insights Through Advanced HR Analytics
The value of a Power BI dashboard lies in its ability to convert raw termination data into actionable insights. Through advanced analytics, HR teams can detect patterns like short-tenured exits, high churn in specific teams, or seasonal spikes in turnover. These insights enable HR professionals to revisit recruitment quality, onboarding processes, and manager effectiveness. Dashboards that include employee satisfaction, performance, and people analytics data provide an integrated view of HR management, driving better strategic planning. With such tools, HR professionals can align termination trends with broader HR strategies, focusing efforts on policies that support employee retention and long-term success.
Leveraging Predictive Analytics for Turnover Prevention
Integrating predictive analytics into your HR termination dashboard allows HR leaders to anticipate risk areas before they result in actual attrition. By analyzing patterns in employee performance, satisfaction surveys, and previous termination trends, HR can build models that flag at-risk employees based on behavior or feedback. This data-driven approach enhances HR reporting and helps HR professionals proactively intervene with coaching, engagement activities, or development opportunities. Leveraging the analytics for HR built into Power BI gives organizations the ability to move from reactive exit tracking to proactive employee retention planning, further embedding modern HR practices into the business strategy.
Dashboard Examples and Templates for Termination Analysis
There are numerous HR dashboard examples that illustrate how companies are using Power BI HR dashboards to manage HR data, turnover and turnover rate more effectively. For instance, a dashboard template might display a combination of KPIs such as average tenure at exit, resignation trends, and a forecast of likely departures. Other examples include dashboards designed for HR reporting, where high-level summaries for executives are paired with drill-down views for HR teams and HR department. These dashboard examples not only track key HR metrics, but they also provide HR insightschro dashboards that align with business goals. Such templates offer a fast and flexible way to deploy scalable analytics for HR initiatives across organizations of any size.
For ready-to-use Dashboard Templates: