Introduction to HR Payroll Dashboards in Power BI
What is an HR Payroll Dashboard?
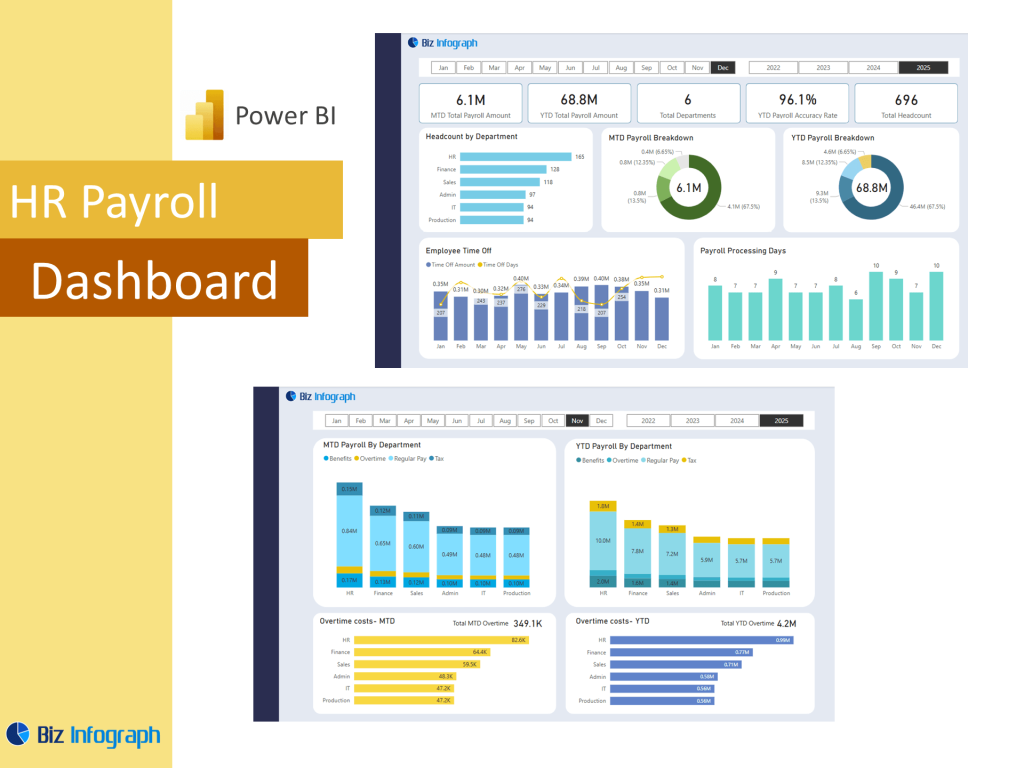
An HR payroll dashboard is a centralized Power BI dashboard Template that enables organizations to visualize and manage salary-related, workforce, and employee data in real-time. Built as part of a broader HR analytics dashboard, it provides detailed insights into total payroll, compensation distribution, employee demographics, and job-level salaries. This dashboard provides HR teams with a high-level overview of costs, salary trends, and departmental spending. Human Resources professionals use this tool to evaluate pay structures, compare across job roles, and manage budgets more effectively. By combining data integration and interactive dashboards, businesses can align payroll strategies with performance goals and workforce planning.
Benefits of Using Power BI for HR and Payroll Analytics
Power BI HR dashboards offer several advantages, including automation, scalability, and ease of access. By leveraging Power BI, HR teams can turn complex, siloed HR data into data-driven, actionable insights. Power BI service enables secure sharing of dashboards with stakeholders across departments, ensuring everyone can access and interpret the data. Payroll dashboards provide a comprehensive view of employee details, compensation, and benefits, supporting strategic decisions around employee satisfaction, retention, and cost optimization. With built-in business intelligence and automation features, Power BI allows users to automate data collection and streamline reporting workflows, freeing up time for analysis and strategic planning.
Key Features of an Effective HR Dashboard in Microsoft Power BI
An effective HR Payroll dashboard in Power BI integrates salary and HR datasets to highlight key payroll trends through intuitive visualization elements such as line charts, bar graphs, and slicers. It allows users to segment by age group, job role, location, or department. Dynamic filters let users drill down into specific employee data—such as average pay per role or turnover rates by team. These dashboards are user-friendly, making them accessible to both HR professionals and non-technical managers. The dashboard allows for real-time data refresh and can adapt to evolving business needs, ensuring ongoing alignment with workforce and financial planning.
Building a Payroll Dashboard in Power BI
How to Create an HR Payroll Dashboard in Power BI
To create an HR payroll dashboard in Power BI, start by identifying the key HR metrics and salary-related data you want to analyze, such as average salary, payroll costs by department, and pay equity. Use Power Query to clean, transform, and combine HR data from sources like HRIS systems or Excel spreadsheets. From there, build data visualizations using slicers, tables, data source, and KPI. Incorporating employee tenure, headcount, employee performance, and employee turnover into the dashboard can provide added context. Finally, publish your dashboard through the Power BI service to share it securely with executives and the HR team, enabling data-driven planning and transparency.
Using Filters and Visualization Techniques for Deeper Insights
Power BI’s strength lies in its powerful data analytics and filtering capabilities. Use filters and slicers to narrow down by employee demographics, age group, department, or pay grade. This makes it easier to identify trends and patterns in compensation, such as whether pay increases are aligned with tenure or which departments have the highest payroll. Visualization tools like line charts or column charts show payroll evolution over time, while KPIs highlight variances in total payroll. Combining workforce data with demographics provides clarity around diversity and inclusion, helping HR better meet DEI goals while ensuring equitable pay structures.
Examples of HR and Payroll Power BI Dashboards
There are many Power BI dashboard template examples that illustrate how businesses can manage payroll more effectively. For instance, a manufacturing company might use a pbix file template to track workforce costs by production unit, highlighting trends in overtime pay and workload distribution. Other dashboard examples include dashboards for salary benchmarking across job roles or performance-linked bonuses. Integrating a Power BI sales dashboard alongside HR payroll dashboards can provide cross-functional insights into revenue per employee or cost-per-sales-rep. These dashboard examples show how customizable Power BI is, making it easy to build dashboards based on your organization’s structure, data, and planning cycles.
Metrics, KPIs, and Data for Payroll Analytics
Key Performance Indicators to Track in an HR Payroll Dashboard
A great payroll dashboard tracks multiple key performance indicators (KPIs) including average salary, payroll cost as a percentage of revenue, employee turnover costs, and overtime expenses. These HR KPIs give a real-time snapshot of financial health and workforce productivity. Dashboards can also track compliance-related KPIs such as timely payroll processing and tax reporting accuracy. These indicators help HR and finance departments ensure that payroll aligns with broader business strategy. Including HR employee status (e.g., full-time, part-time, contract) also enhances clarity and ensures payroll is tailored to different employee types, contributing to a more detailed and compliant payroll dashboard.
Using HR Data and Metrics to Analyze Workload and Turnover
Combining payroll metrics with workload data enables HR to determine whether teams are under-resourced or overworked. This analysis can reveal if compensation levels correlate with attrition or employee satisfaction. For example, high turnover rates in certain departments may coincide with low average pay or excessive hours. By examining employee tenure and job role alongside salary, HR can assess how long top performers stay and what incentives might improve employee retention. These insights are crucial for refining your hiring process, designing retention strategies, and understanding the relationship between compensation and employee engagement across various demographics and functions.
Interactive Dashboards for Payroll and Workforce Management
Interactive dashboards in Power BI elevate payroll reporting by enabling real-time exploration and visualization of HR data. Users can filter data by any metric—department, salary band, or employee turnover—and see instant updates to all visuals. This flexibility supports agile workforce and financial planning. These dashboards allow for quick reviews during stakeholder meetings and can be shared via Power BI service for collaborative use. HR can analyze employee costs against productivity and performance trends, aligning payroll spending with organizational priorities. With built-in automation and integration with existing systems, Power BI dashboards provide scalable, intelligent solutions for HR management with Power BI.
For ready-to-use Dashboard Templates: