Introduction to HR Headcount Dashboard Power BI
What is an HR Headcount Dashboard?
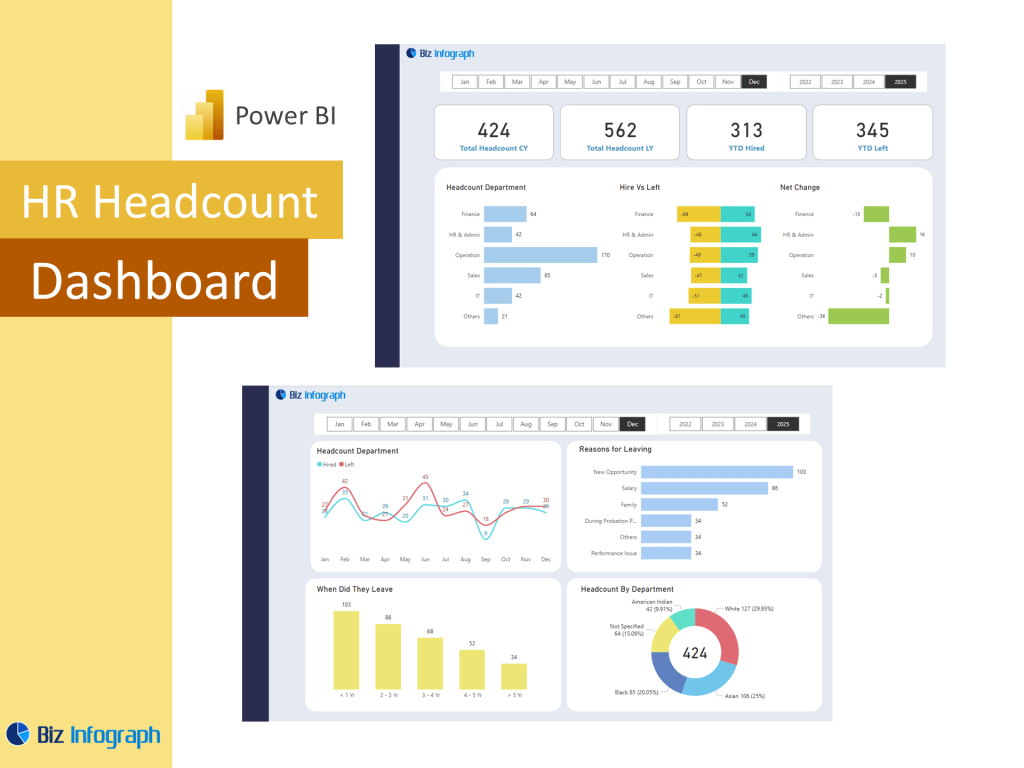
An HR headcount dashboard is a dashboard using Power BI that helps organizations monitor, visualize, and manage the total number of employees across departments, locations, or job roles. This type of dashboard is a powerful tool used by the human resources department to track active employees, opening headcount, closing headcount, and employee distribution metrics. By integrating HR data with business intelligence capabilities in Microsoft Power BI, teams can visualize data and perform deep data analysis with real-time updates. This provides actionable insights into workforce trends and supports HR processes like recruitment, onboarding, and capacity planning in a structured, data-driven way.
Benefits of Using Power BI for HR Dashboards
Using Power BI for headcount analytics transforms raw data into engaging dashboards that deliver fast and accurate data insights. With data visualization tools like bar charts, pie charts, and filters, HR teams can segment the employee count by gender, department, tenure, or location. The ability to use data across multiple sources enables HR professionals to track key trends and answer critical workforce questions quickly. Power BI dashboards also integrate with Power Query to cleanse and transform data efficiently, helping organizations analyze the data with less manual effort. These features help HR teams manage headcount, improve employee retention, and optimize staffing levels based on historical trends.
Role of HR Headcount Analytics in Strategic HR Processes
HR analytics related to headcount and attrition plays a crucial role in shaping effective HR policies. With a Power BI dashboard, the HR team can track employee turnover, monitor attrition rates, and analyze employee performance to inform workforce planning. These dashboards also help visualize patterns in employee satisfaction and job satisfaction using internal survey results or engagement scores. The integration of predictive analytics within Power BI enables teams to identify high-risk turnover segments and proactively intervene. By applying data analytics, HR professionals can support strategic workforce decisions, reduce attrition, and improve the employee experience across the organization.
Building a Headcount Dashboard Using Power BI
Setting Up a Power BI Dashboard for HR Headcount Tracking
To build an effective HR headcount dashboard in Power BI, you start by gathering data sources such as payroll systems, employee databases, and sales data if applicable for cross-functional analysis. Using Power Query, this data is cleaned and modeled to reflect key HR metrics like number of employees, turnover, new hires, and terminations. The dashboard layout should include slicers to filter data across different departments, time periods, and job levels. This setup enables HR insights that are both interactive and informative. Leveraging Microsoft Power BI makes it easier to manage large amounts of data while maintaining accuracy and flexibility in reporting.
Key Dashboard Features and Visualizations for HR Analysis
A comprehensive dashboard using Power BI includes features that allow users to interact with the data and discover trends with ease. Common dashboard features include bar charts to display employee movement trends, pie charts to visualize employee distribution, and KPI cards that highlight key stats such as total headcount, attrition rate, and new hires. The dashboard provides insights into workforce changes and identifies potential bottlenecks in hiring or retention processes. These analytics tools empower HR professionals to visualize employee data in a way that’s easy to understand and act on—improving both employee management and long-term planning.
Best Practices for a Power BI Headcount Project
When launching an HR headcount Power BI project, it’s critical to define the goals and key performance indicators at the outset. Focus on building a data model that supports scalable analysis, whether you’re reporting on 500 or 50,000 employees. Always integrate real-time or regularly refreshed data sources for accurate reporting. Grouping data by relevant categories such as department, tenure, and region will help HR teams make better workforce decisions. Avoid overloading visuals—make the data intuitive and focused on trends in data rather than isolated numbers. Using these best practices ensures that your Power BI dashboard becomes a valuable asset for organizational decision-making.
Key Metrics and KPIs to Track
Essential KPIs for HR Headcount Monitoring
Tracking key performance indicators on an HR headcount dashboard allows HR to understand how the workforce is evolving. Common HR KPIs include total number of employees, opening and closing headcount, new hire rate, employee turnover, and internal transfers. These metrics provide insights into hiring success and organizational growth. The dashboard also helps measure diversity, tenure distribution, and employee demographics. By consolidating these data points into one dashboard using Power BI, HR leaders can detect workforce shifts early and align resource planning with business goals. These data-driven views ensure that your HR analytics dashboard remains both operational and strategic.
Using Headcount Data for Turnover and Workforce Analysis
Analyzing employee turnover and attrition rate is key to understanding retention challenges and employee sentiment. With Power BI, headcount and attrition can be mapped across departments and time periods, enabling HR to pinpoint high-risk areas. This analysis can also correlate employee satisfaction data to highlight root causes of attrition. By integrating employee performance metrics, HR can see how engagement and satisfaction influence retention. This comprehensive data analysis approach helps HR not only monitor but also predict turnover, creating opportunities for intervention. Dashboard features like trendlines, filters, and drill-downs make it easier to use data to improve overall workforce stability.
How Power BI Enhances HR Data Analysis and Decision-Making
Power BI enables HR professionals to move from reactive reporting to proactive strategy. Through advanced data visualization and data analytics, HR can uncover patterns that influence talent decisions. Whether identifying declining satisfaction levels, predicting turnover, or optimizing department size, using Power BI supports quicker, data-driven decisions. The ability to analyze the data in-depth provides HR with a competitive edge, aligning workforce planning with business needs. In today’s landscape, where talent is key, a dashboard using Power BI is more than a report—it’s a strategic compass for the human resources department, enabling smarter investments in people and process.
For ready-to-use Dashboard Templates: