Introduction to HR Analytics in Power BI
What is an HR Analytics Dashboard?
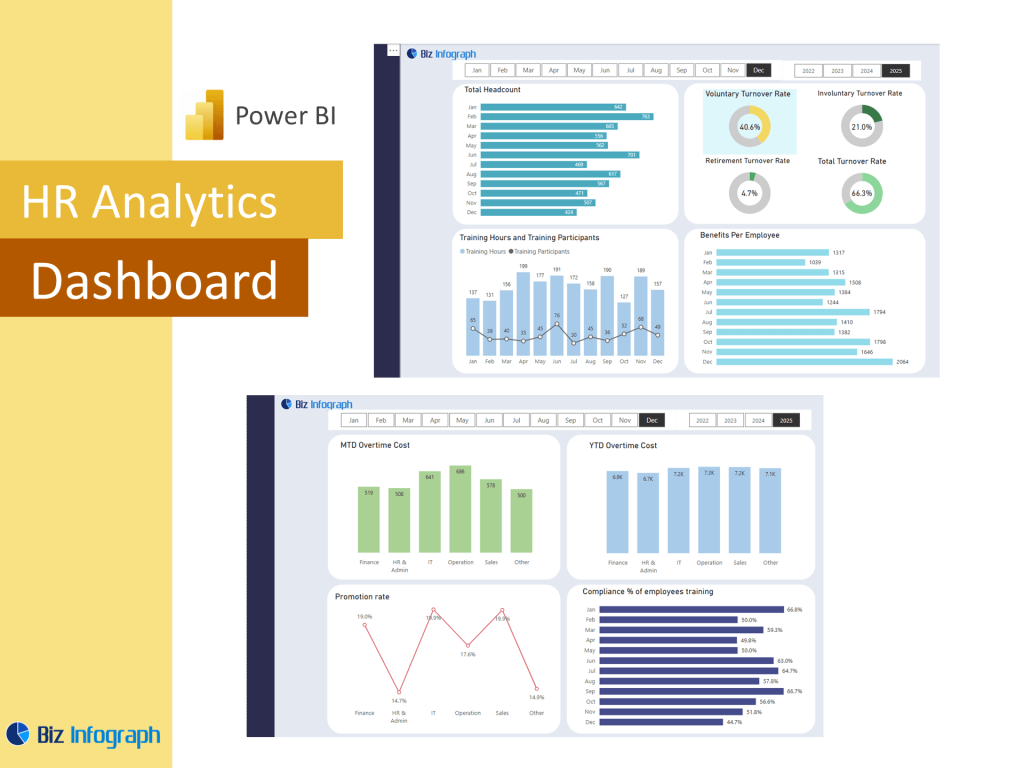
An HR analytics dashboard is a centralized analytics platform that helps HR teams visualize, track, and interpret employee-related data for informed decision-making. Built in Power BI, this type of dashboard provides a comprehensive, real-time overview of key HR metrics such as turnover rates, employee engagement, and retention. HR analytics with Power BI empowers HR managers and strategic HR leaders to move beyond basic reporting and embrace data-driven insights that drive organizational success. By consolidating employee data, job roles, and demographics into one dynamic report, the dashboard enables HR professionals to make better, faster, and more data-driven decisions.
Benefits of Using Power BI for HR Analytics
Power BI is a powerful and flexible business intelligence tool that allows HR departments to transform raw data into interactive visual reports. Using Power BI, organizations can build scalable and customizable dashboards that update automatically with real-time data. A well-designed Power BI HR dashboard not only supports operational efficiency but also facilitates strategic decisions by highlighting trends in employee turnover, employee satisfaction, and performance. HR analytics data in Power BI allows you to uncover relationships between factors like job satisfaction levels, performance, and attrition—ultimately helping to boost employee performance and enhance employee engagement organization-wide.
Key Use Cases for HR Leaders and Strategic HR
For HR leaders, a robust Power BI solution offers the ability to gain insights into key workforce trends and identify areas for improvement. Common use cases include analyzing employee retention, tracking employee turnover rates, measuring engagement by department, and assessing the impact of development programs. Through HR analytics dashboards, decision-makers can apply predictive analytics to anticipate staffing needs or uncover trends across diverse job roles and demographics. These dashboards also help HR professionals to make informed budget allocations and create effective retention strategies. Overall, Power BI for HR analytics empowers human resources management to become a more data-driven and strategic function.
Building an HR Dashboard with Power BI
Setting Up Your HR Data Model in Power BI
Before creating any visualizations, it’s essential to build a strong data model in Power BI. This involves connecting multiple data types like payroll, attendance, benefits, and engagement surveys into a unified format. The data model should be structured to reflect your HR analytics goals—whether tracking workforce demographics, employee data, or performance outcomes. Integrating Microsoft data from Excel or other HR systems allows for seamless imports into Power BI. A solid data foundation enables cross-tabulation and drill-down functionality within your dashboard, providing a full view of the workforce with Power BI and allowing for more robust data analysis.
Using Power Query for Clean HR Data Preparation
Power Query is a powerful tool within Power BI that helps HR analysts cleanse and transform their employee data before visualization. From removing duplicate records to standardizing formats and merging multiple data sources, Power Query simplifies the task of preparing complex data sets for analysis. This step is especially useful when dealing with HR analytics data from multiple platforms. Clean and structured input ensures accurate reporting and minimizes errors on your HR analytics dashboard. By using Power Query, HR managers can maintain data integrity and spend more time focusing on analysis rather than manual data wrangling.
Creating Effective Visualizations for HR Metrics
Data visualization is at the heart of a great HR dashboard. Power BI makes it easy to build dynamic charts, heatmaps, and tables that display key performance indicators like hiring trends, training participation, and employee turnover rates. An analysis dashboard should present information intuitively, allowing users to compare current figures with historical data and organizational benchmarks. Using Power BI, HR can gain actionable insights from visuals that illustrate correlations between engagement and performance or reveal seasonal attrition patterns. An effective dashboard using Power BI doesn’t just report numbers—it tells a story that supports smarter people analytics strategies.
Key Metrics and KPIs to Track
Essential HR KPIs for Workforce Analysis
A successful HR analytics dashboard Power BI project starts with identifying the key HR metrics that matter most. These often include employee turnover, absenteeism, time-to-hire, and headcount trends. Key performance indicators like cost-per-hire or internal promotion rate help HR teams understand talent pipeline efficiency. Dashboard offers a comprehensive view of these metrics, enabling decision-makers to track progress and identify gaps in recruitment, onboarding, or development efforts. Monitoring these HR KPIs in real-time allows organizations to adjust strategies quickly and ensures the workforce is aligned with business goals.
People Analytics Metrics for Talent Management
People analytics goes deeper than basic reporting—it provides the context and connections behind workforce behaviors. Metrics like employee engagement, team performance distribution, and employee retention drivers are all vital to understanding organizational health. By integrating these with predictive analytics, HR can forecast workforce risks, such as who might be likely to leave. These insights help HR managers implement personalized interventions and professional growth opportunities. A Power BI-based analytics dashboard enables leadership to analyze gender diversity, pay equity, and employee movement by job roles or departments. These insights are critical to fostering inclusive and high-performing teams.
Turning Data into Actionable Insights with Power BI
One of the biggest strengths of HR analytics with Power BI is the ability to gain actionable insights that go beyond surface-level metrics. Through intelligent data visualization and drill-down capabilities, HR professionals can understand not just what is happening, but why. This deeper analysis helps teams identify areas for improvement—whether it’s high turnover in a specific location or a dip in employee satisfaction. A well-configured Power BI HR dashboard makes it easy to convert HR insights into initiatives that boost morale, improve performance, and drive measurable ROI. Using Power BI, HR moves from reactive reporting to strategic decision-making.
Advancing HR Analytics Capabilities
How Power BI Dashboards Support Data-Driven Decisions
A core value of Power BI for HR analytics is its ability to support truly data-driven decisions. By giving HR leaders instant access to real-time trends and KPIs, Power BI HR dashboards help steer organizational strategy with precision. From employee turnover hotspots to promotion pipeline bottlenecks, dashboards uncover patterns not visible in traditional reports. These insights enable human resources to proactively adjust staffing plans, improve team structure, and align HR policies with business growth. The dashboard helps translate raw numbers into context, ensuring leaders aren’t just reacting—they’re planning ahead with data.
Best Practices for HR Analytics Dashboards
To ensure your HR analytics dashboard is impactful, follow best practices such as keeping visualizations clear, aligning KPIs with business objectives, and updating regularly with real-time data. Segment your visuals by demographics, job levels, or departments to uncover key insights. Avoid clutter by focusing on specific HR goals like diversity, productivity, or engagement. Use Power BI bookmarks and filters to allow interactivity, helping users drill into trends with ease. A successful Power BI project should evolve as your workforce needs change, providing agile support for strategic and operational goals across the company.
Real-World Power BI Projects for HR Teams
Implementing a Power BI project in HR could involve automating quarterly talent reviews, developing a workforce with Power BI succession planning dashboard, or building a real-time employee engagement tracker. These projects not only improve reporting efficiency but also help HR professionals to make evidence-based improvements across the talent lifecycle. For example, a powerful Power BI dashboard focused on onboarding can monitor satisfaction and ramp-up rates, while one for attrition can integrate predictive analytics to flag early warning signs. These real-world applications of Power BI HR dashboards are transforming how organizations understand and support their people.
For ready-to-use Dashboard Templates: