Introduction to Health and Safety Dashboard
What is a Health and Safety Dashboard?
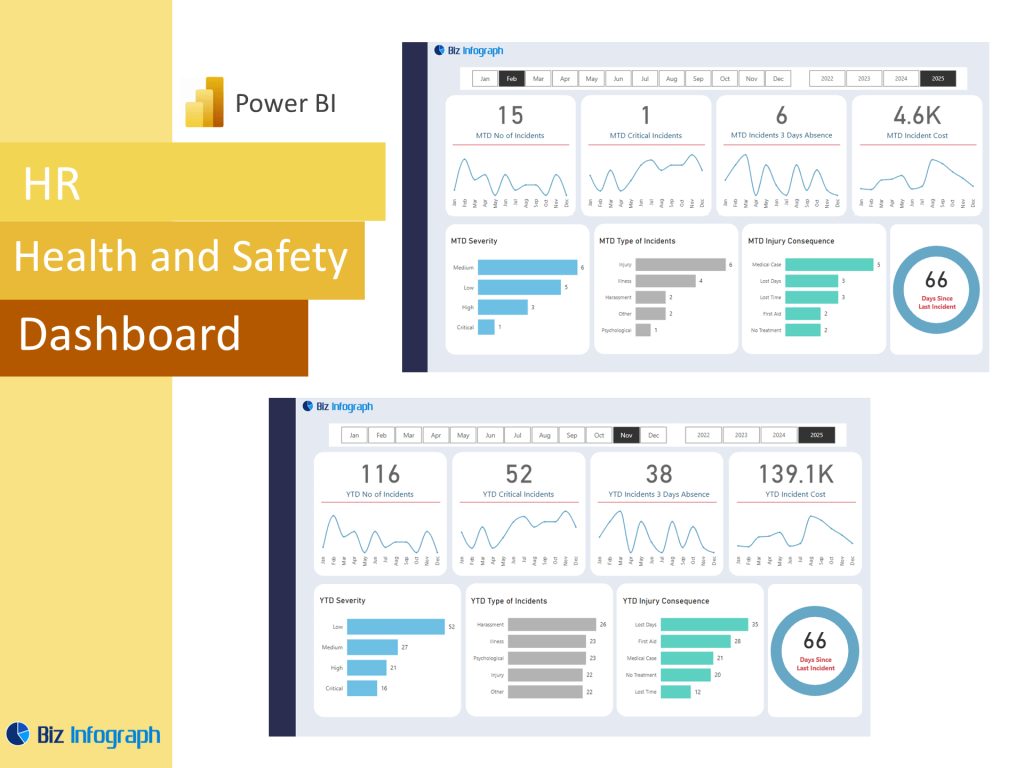
A Health and Safety Dashboard Template is a visual reporting tool that centralizes and displays safety data in a dynamic, interactive format. Built as a dashboard in Power BI, it empowers EHS professionals to track safety incidents, monitor risk levels, and assess the effectiveness of safety programs in real time. This dashboard helps organizations stay compliant with regulations and supports proactive safety management through early identification of safety risks. By integrating various data sources such as audit logs, incident reports, and equipment records, a safety dashboard provides a consolidated view of EHS data for improved decision-making and safety culture development.
Benefits of Using Power BI for EHS Analytics
Microsoft Power BI has become one of the best platforms for EHS analytics due to its powerful data modeling, seamless integration capabilities, and interactive visualization tools. With Power BI for EHS, companies can convert raw data into actionable insights, offering in-depth analysis of incident reporting, near-misses, and hazard observations. Unlike traditional EHS software, Power BI dashboards are fully customizable and user-friendly. Whether you’re a safety manager or a data analyst, the platform helps improve safety outcomes through timely and data-informed actions. Power BI helps bridge the gap between compliance tracking and operational strategy by delivering clear, engaging views of complex safety data.
Business Intelligence in Health and Safety Reporting
Modern safety reporting relies heavily on business intelligence (BI) tools like Power BI. Through advanced reporting and analytics, companies can move beyond reactive safety practices and toward predictive, proactive risk mitigation. Power BI for safety provides dynamic performance dashboards that highlight patterns in injuries, unsafe behavior, and inspection results. The interactive dashboard format not only facilitates real-time exploration but also promotes collaboration among EHS stakeholders. Power BI enables the organization to visualize safety trends over time, pinpoint high-risk departments, and prioritize intervention. This strategic application of BI tools ensures safety efforts are aligned with business objectives and resource efficiency.
Building an EHS Dashboard Using Power BI
Key Features of an Effective EHS Power BI Dashboard
An effective Health And Safety Power BI dashboard includes features such as filters for location, department, and incident type; real-time updates; and intuitive visual components like heat maps and KPIs. It must also display key metrics like incident rates, safety measures, safety performance, and corrective actions. One of the most powerful elements is the ability to connect directly with EHS data from internal systems or EHS software using Power Query Editor. These dashboards make it easy to transform safety data into actionable insights, helping companies drive safety improvement initiatives and stay ahead of compliance requirements. Ultimately, the dashboard provides a single source of truth for safety monitoring.
How to Use Power BI for Health and Safety Data
To use Power BI effectively for health and safety reporting, start by connecting datasets from your incident logs, audit results, and observation records. Use Power Query Editor to clean and structure this safety data, then create relationships between tables through data modeling. From there, you can develop visual reports with slicers, graphs, and KPIs. Power BI helps you turn disconnected data into a powerful EHS analytics platform that adapts to your organization’s specific needs. By leveraging Power BI dashboard templates or building custom reports from scratch, you ensure that your dashboard tracks relevant insights, empowering better oversight and faster response to emerging safety issues.
Real-Time Monitoring and Visualization for EHS Teams
Power BI enables EHS professionals to work with real-time data—a crucial component in maintaining high safety standards. With the ability to pull live updates from cloud-connected systems via the Power BI Service, teams gain continuous access to the latest safety incidents, audits, and compliance metrics. Real-time dashboards allow HR and operations to respond instantly to spikes in risk or breaches in policy. This feature is especially useful in high-risk industries like manufacturing or healthcare, where incident data changes rapidly. With a dashboard using Power BI, you can visualize trends, data visualization, and harness data and transform it into insights that drive continuous safety enhancements.
Power BI Tools and Techniques for EHS Analytics
Leverage Power BI for Advanced Safety Analysis
Organizations that leverage Power BI for EHS analytics benefit from the platform’s built-in capabilities for advanced data analysis and visualization. You can apply conditional formatting, drill-through filters, and forecasting features to explore historical data and anticipate future incidents. Power BI for safety also allows integration with predictive analytics tools, enabling teams to identify potential hazards before they materialize. These capabilities transform the dashboard into more than just a visual tool—it becomes a strategic asset for data-driven planning. Whether you’re an analyst or safety officer, you can master Power BI to build robust reports tailored to your operational environment.
Using Power BI with Microsoft 365 for EHS Dashboards
Integrating Power BI with Microsoft 365 enhances the reach and usability of your health and safety dashboard. You can embed dashboards into Teams or SharePoint, automate alerts with Power Automate, and collaborate on analysis through Excel and Outlook. This seamless integration supports a broader ecosystem where EHS data is not siloed but shared across departments. Combined with tools like Forms for data collection and OneDrive for dataset storage, Microsoft 365 enables organizations to build a truly agile and accessible Power BI project. With this setup, it becomes easy to publish your EHS insights and democratize access to safety intelligence company-wide.
Learn How to Use Power BI for EHS Projects
To learn how to use Power BI Template effectively for EHS, start with understanding your data needs. Whether you’re focused on safety improvement, reducing employee attrition, or ensuring regulatory compliance, identifying your dashboard features is critical. From there, you can explore tutorials, Microsoft documentation, and real-world Power BI healthcare dashboard examples to build your skills. As you grow more confident, start experimenting with customized Power BI visualizations and integrating your EH&S data for deeper insights. Learning Power BI doesn’t just improve your technical capabilities—it empowers EHS professionals to become strategic drivers of workplace safety and compliance.
For ready-to-use Dashboard Templates: