Overview of a CFO Dashboard
What is a CFO KPIs Dashboard in Excel?
A CFO KPIs dashboard is a centralized visual tool that provides finance leaders with real-time access to a company’s financial data. This dashboard provides a high-level overview of key metrics like cash flow, revenue, expenses, and profitability. A CFO would rely on this interface to monitor and track performance metrics essential for maintaining the company’s financial health. A well-designed CFO KPI dashboard aggregates data from various sources and translates it into actionable insights, enabling better financial decisions. By using a CFO dashboard example, finance teams can understand how CFO dashboards come together to support strategic objectives and long-term financial sustainability. Monitoring working capital, cost of goods sold, quick ratio, and cash conversion cycle through a cash flow dashboard helps visualize key financial metrics, enhance revenue growth strategies, and ensure the finance team maintains a strong and agile overall financial position.
Importance of CFO Dashboards for Finance Leaders
CFO dashboards are indispensable tools for today’s finance leaders. They offer a streamlined approach to viewing complex financial data, helping to make informed decisions faster. A robust CFO dashboard metric can help spot cash flow issues, identify overspending, and assess the time it takes a company to pay its suppliers—metrics like days payables outstanding fall into this category. When CFO dashboards provide centralized data, finance executives can align strategy with execution. Using CFO dashboards, the finance team can visualize trends over time, enhancing the company’s ability to react swiftly to market conditions and optimize resource allocation effectively.
Benefits of a Chief Financial Officer Dashboard for Strategic Planning
The benefits of a CFO dashboard go beyond tracking numbers; they support strategic business growth. By offering dashboard examples rich in CFO KPIs and dashboards, such platforms help CFOs tie financial decisions directly to business goals. These dashboards help CFOS by offering CFO key performance indicators in one place, from forecast dashboards to expense management dashboards. The dashboard gives clear insights into where resources should be deployed, enabling smarter resource allocation. With dashboards tracked using CFO dashboard software, businesses gain a real-time understanding of their financial performance—crucial for long-term planning, capital investment, and steering the company’s financial direction.
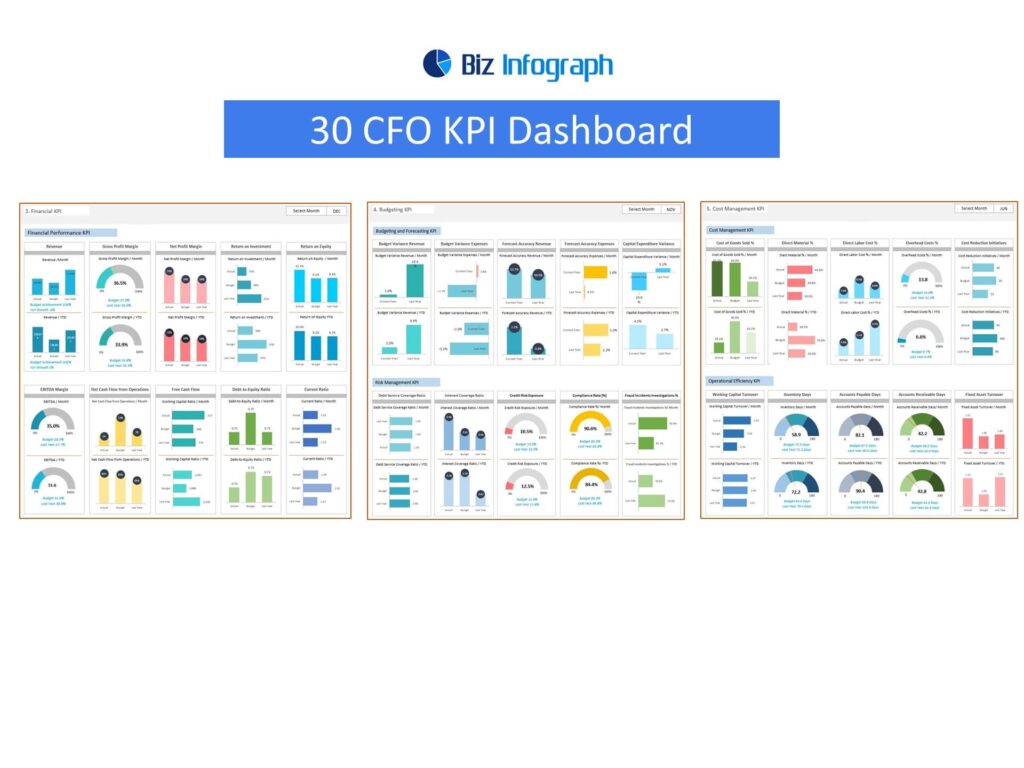
Key CFO KPIs and Metrics to Track
Top CFO KPIs Every CFO Should Track
There are at least 20 key CFO metrics that the best CFO should regularly monitor to ensure robust financial control. Some of the important KPIs include Net Profit Margin, Operating Cash Flow, and Return on Equity. These CFO KPIs serve as the backbone of any CFO KPI dashboard, providing real-time insights into the company’s financial health. These KPIs are used by the CFO to assess both short-term liquidity and long-term sustainability. Monitoring these CFO metrics allows finance leaders to spot inefficiencies and adjust strategies promptly. Every top CFO relies on these KPIs to measure and drive corporate performance effectively.
Financial KPIs to Measure Profitability and Performance
Understanding and tracking CFO performance depends heavily on specific financial KPIs that give a full picture of the company’s financial performance. Profitability ratios such as Gross Margin, EBITDA, and Net Income are commonly included in any CFO KPI dashboard. These KPIs to measure operational efficiency are vital in identifying whether the business model is scalable and sustainable. A performance metric like Return on Assets measures how much profit is generated from company assets, which helps in assessing the effective use of resources. KPIs that give profitability insights help CFOs evaluate market performance and align business units toward revenue goals.
Accounts Receivable and Other Important KPIs
Among the important KPIs that every CFO should track, accounts receivable days or Days Sales Outstanding (DSO) is vital. This metric tells the time it takes a company to collect cash after a sale. High DSO could signal cash flow issues, making it one of the most useful CFO dashboard KPIs. A customer ledger dashboard often displays detailed insights into receivables, including overdue accounts, average collection periods, and customer credit utilization. These KPIs that CFOs monitor not only affect liquidity but also impact decisions related to credit policy and sales strategy. When tracked using CFO dashboard software, they become powerful tools for proactive financial management.
Forecast Metrics for Financial Planning
A forecast dashboard helps CFOs anticipate future trends based on historical and current financial data. Forecast metrics such as projected cash flow, revenue trends, and budget variances are CFO KPIs that support better forward-looking decisions. These dashboards typically display both best-case and worst-case scenarios, allowing the finance team to prepare for multiple outcomes. When combined with historical CFO reports, forecast metrics can help make informed decisions about hiring, investment, and expansion. These CFO key performance indicators are often integrated into dashboards that provide a broader view of the company’s financial direction, helping CFOS stay proactive instead of reactive.
Building a KPI Dashboard in Excel
Step-by-Step Guide to Creating a CFO Dashboard
Building a CFO KPI dashboard in Excel starts with identifying the right KPIs for your business. Begin by gathering relevant financial data—from revenue and expenses to receivables and payables. Use Excel’s built-in tools like PivotTables, conditional formatting, and charts to create visual representations of CFO KPIs and dashboards. Incorporate dynamic features such as slicers and drop-down filters for interactivity. A good dashboard provides clarity and should avoid data clutter. While Excel is not a full-blown CFO dashboard software, it remains a powerful, customizable option for early-stage businesses or those looking to prototype CFO dashboard examples.
Useful Dashboard Examples and Templates
To streamline the development process, leveraging pre-built dashboard examples in Excel can be very helpful. Templates like the expense management dashboard or customer ledger dashboard allow you to jumpstart your reporting by plugging in your financial data. A practical CFO dashboard example typically includes key visuals like trend graphs, ratio analysis, and warning indicators. Whether you’re designing a CFO KPI dashboard for internal reporting or investor updates, using templates ensures you include all the CFO metrics that matter. These dashboards offer real-world scenarios to demonstrate how KPIs that give deep insights should be presented to stakeholders.
Tips to Help CFOs Customize KPI Dashboards
Customizing dashboards allows CFOs to create tailored reports that meet specific business needs. To help CFOs make the most of their dashboards, it’s essential to choose KPIs that CFOS actually use to guide their decisions. Start by understanding your company’s priorities—whether it’s growth, cost-cutting, or capital optimization. Then select key metrics that align with these objectives. Excel allows users to create dynamic dashboards that update automatically with the latest CFO reports. Integrating external data sources through Power Query or macros further enhances your KPI dashboard capabilities. A customized dashboard ensures the CFO would get relevant insights without unnecessary complexity.
Enhancing Financial Performance with KPI Dashboards
How Dashboards Help CFOs Improve Decision-Making
A strong CFO KPI dashboard directly supports better decision-making by providing timely, accurate, and relevant information. With visuals that summarize performance metrics, CFOs are empowered to identify trends and make data-driven adjustments.
Using Performance Metrics to Drive Profitability
Monitoring CFO metrics tied to profitability helps ensure that the business remains financially sound and competitive. Metrics like Gross Profit Margin, EBIT, and Operating Leverage are core performance metrics within any CFO KPI dashboard. These metrics enable the finance team to assess the efficiency of operations and uncover areas where costs can be reduced or revenues increased. Incorporating a forecast dashboard helps the CFO model how different scenarios affect profitability, improving strategic clarity. By focusing on the KPIs to measure profitability, CFOs are better positioned to implement tactics that not only preserve but enhance the company’s financial performance.
Integrating Forecast Dashboards with KPI Analysis
The future-focused nature of a forecast dashboard makes it an essential component of any comprehensive CFO KPI dashboard. By integrating past trends and real-time financial data, these dashboards forecast potential outcomes, helping the best CFO prepare for growth or turbulence. When CFO dashboards come with embedded forecasts, they transform from static reports to predictive engines. This integration allows the CFO would identify potential bottlenecks, reassess resource allocation, and pivot strategies as needed. KPIs are used in tandem with forecast data to offer both context and clarity, allowing CFOs to keep their finger on the pulse of the company’s financial health.
For ready-to-use Dashboard Templates: