Introduction to Executive Dashboards
Overview of Executive Dashboards and Their Importance
An executive dashboard is a visual reporting tool designed to provide business leaders and CEOs with a high-level overview of key business metrics. These dashboards consolidate data from various sources, offering a snapshot of the company’s health and performance. Executive dashboards are essential for making data-driven decisions by presenting important metrics, such as financial performance, sales, and marketing efforts, in one place. These dashboards help executives track progress toward business goals, monitor the effectiveness of various departments, and make timely, informed decisions that drive the organization forward.
Role of CEO Dashboards in Strategic Decision-Making
A CEO dashboard serves as a strategic dashboard that helps top-level executives make better business decisions. By aggregating data from multiple sources, such as financial systems, sales platforms, and Google Analytics, the dashboard provides a comprehensive view of the organization’s performance. For CEOs, having access to data points related to financial health, sales trends, and operational efficiency is crucial for setting strategic goals and responding quickly to changes in the market. Dashboards help CEOs track KPI Dashboard in one place, saving time and enabling them to focus on critical issues that require immediate attention. This helps in making informed decisions that align with the company’s overall strategy.
Key Metrics and KPIs in Executive Dashboards
Essential KPIs for CEOs (Financial, Operational, Sales)
CEO dashboards typically include key performance indicators (KPIs) that cover several areas, including financial, operational, and sales performance. For financial insights, metrics such as total revenue, profit margins, and cash flow are commonly tracked. Operational dashboards focus on metrics like efficiency ratios and cost management, while sales dashboards visualize sales growth, lead generation, and conversion rates. These metrics give executive teams a clear picture of the company’s financial health and operational success, helping them make data-driven decisions and adjust strategies to meet business goals.
Sales and Marketing KPIs for Performance Tracking
A well-designed executive dashboard should include sales and marketing KPIs to measure the effectiveness of sales performance and marketing efforts. For the sales team, KPIs like the sales pipeline, revenue growth, and deal closure rates are key indicators of success. On the marketing side, digital marketing dashboards track performance metrics such as conversion rates, customer acquisition costs, and the effectiveness of marketing campaigns across different marketing channels. Monitoring these KPIs helps marketing teams optimize strategies and ensure that their efforts contribute to the overall business goals.
Using KPIs to Make Data-Driven Decisions
The integration of KPIs into executive dashboards empowers business leaders to make data-driven decisions based on real-time and historical data. These dashboards consolidate data from multiple sources, such as Google Analytics, sales platforms, and financial systems, into a single view, making it easier for executives to evaluate performance across the organization. With all relevant KPIs in one place, executives can quickly identify areas that need improvement, track progress, and optimize their decision-making process. This data-driven approach leads to more accurate forecasts and better long-term planning.
Examples of Executive Dashboard Templates
Financial Dashboard for Monitoring Key Financial Metrics
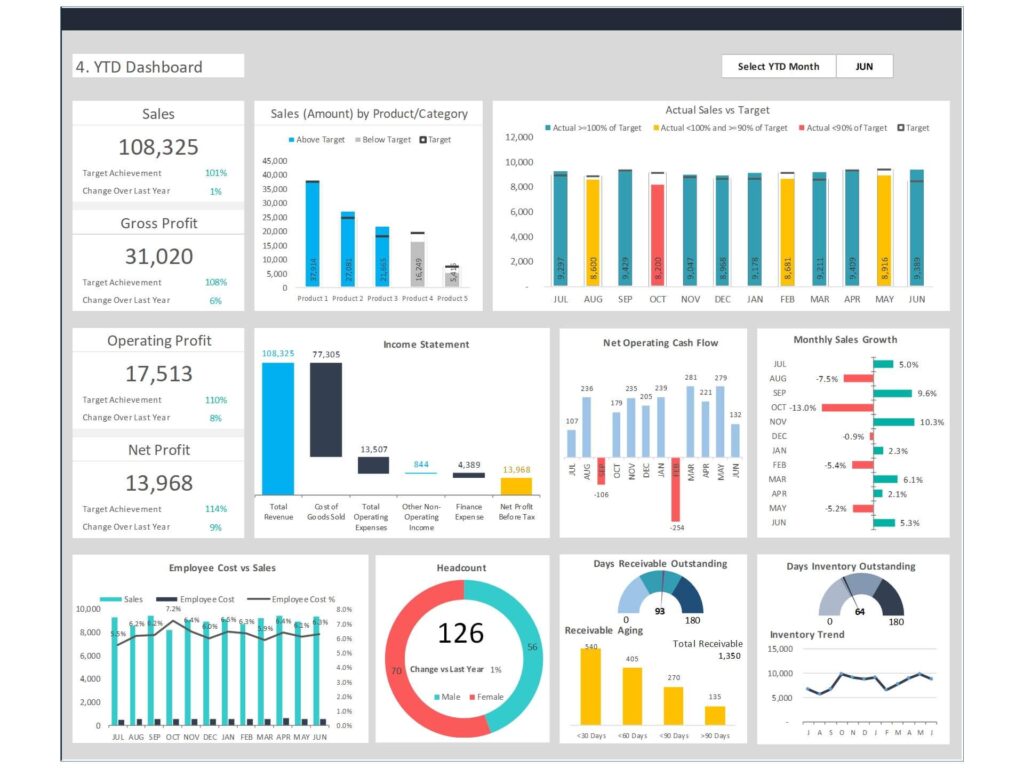
A financial dashboard is one of the most important executive dashboard examples, providing a comprehensive view of a company’s financial performance. Metrics such as total revenue, operating expenses, profit margins, and cash flow are visualized through charts and graphs. Financial dashboards help CEOs and CFOs monitor the financial health of the company, identify trends, and make adjustments to improve financial outcomes. This dashboard template is critical for tracking the company’s fiscal performance and ensuring that financial goals are being met.
Sales Performance Dashboard for Tracking Revenue and Growth
A sales dashboard provides real-time data on sales performance, helping executives track metrics like revenue, sales targets, and lead generation. This dashboard template often includes sales pipeline visuals, conversion rates, and sales growth trends over time. It is particularly useful for CEOs and sales managers who need to ensure that the sales team is meeting its goals and that sales strategies are aligned with the company’s growth objectives. By using sales performance dashboards, executives can make better decisions regarding sales strategies and market opportunities.
Marketing Dashboard for Measuring Digital Campaigns and Analytics
A marketing dashboard focuses on the performance of digital marketing campaigns and customer engagement. Executive dashboard templates in marketing typically include KPIs such as conversion rates, customer acquisition costs, and the return on investment (ROI) of different marketing efforts. This digital marketing dashboard is particularly useful for tracking the effectiveness of multi-channel campaigns across platforms like Google Analytics and social media. By visualizing these metrics, the marketing team and executives can adjust strategies to improve marketing performance and ensure that campaigns contribute to overall business success.
Customizing Your Executive Dashboard
Tailoring Dashboards to Fit Business Needs and Goals
Every organization has unique needs, and the executive dashboard should be customized to reflect specific business goals and industry requirements. For example, a tech company may focus on R&D efficiency and customer retention, while a retail business may prioritize sales growth and inventory management. Dashboard templates allow for customization, where you can add or remove KPIs and data sources based on what’s most relevant to the business. Customizing the dashboard ensures that it provides actionable insights that align with your strategic objectives, helping the executive team make more effective business decisions.
Integrating Multiple KPIs into One Dashboard
An effective executive dashboard should integrate multiple KPIs in one place to provide a holistic view of the company’s performance. Whether it’s financial metrics, operational efficiency, or marketing performance, having all these metrics consolidated into one overview dashboard makes it easier for executives to monitor progress across the board. Dashboards using this approach ensure that executives are not only focused on one aspect of the business but are also able to see how different departments contribute to the overall success. Integrating data from various sources and departments provides a clear picture for more strategic and comprehensive decision-making.
Best Practices for Dashboard Design and Visualization
When designing an executive dashboard, it’s important to follow best practices for clear and effective dashboard design. Focus on simplicity and clarity by avoiding cluttered layouts and ensuring that the most important metrics are prominently displayed. Data visualization techniques, such as charts, graphs, and heat maps, should be used to make complex data easy to understand. Additionally, the dashboard should offer customization options for different users, allowing the executive team to filter and view relevant data. Well-designed dashboards make it easier for executives to access real-time insights and make informed decisions.
Tools for Building Executive Dashboards
Using Google Sheets for Simple Executive Dashboards
For businesses looking for a cost-effective solution, Google Sheets is an excellent tool for building simple executive dashboards. By integrating Google Analytics and other data sources, Google Sheets can be used to create real-time dashboards with essential KPIs. Its collaborative features allow multiple team members to update and view data simultaneously, making it a great choice for smaller teams. Although not as advanced as dedicated dashboard software, Google Sheets offers customizable templates that can serve as a foundation for tracking performance across key areas like sales, marketing, and operations.
Leveraging Google Analytics for Digital Marketing Dashboards
For marketing-focused executives, integrating Google Analytics into a digital marketing dashboard can provide valuable insights into website traffic, user behavior, and campaign performance. Google Analytics dashboards are ideal for tracking KPIs such as bounce rates, conversion rates, and audience demographics. This data helps marketing teams and executives understand the effectiveness of digital marketing strategies and adjust campaigns accordingly. Using Google Analytics as part of an executive dashboard enables real-time tracking of online performance, which is essential for businesses heavily reliant on digital channels.
Advanced Executive Dashboard Templates in BI Tools
For more advanced tracking and analysis, businesses can use business intelligence (BI) tools like Power BI or Tableau to create fully customized executive dashboard. These tools allow users to integrate data from multiple sources such as financial systems, CRM software, and marketing platforms, and offer advanced data visualization options. BI tools provide more complex data analysis capabilities, making them ideal for larger enterprises or businesses with more sophisticated reporting needs. With BI tools, executives can access deep insights into performance metrics and make data-driven business decisions that are more accurate and impactful.
Conclusion: Leveraging Executive Dashboards for Better Decision-Making
How Executive Dashboards Help CEOs Make Data-Driven Decisions
An effective executive dashboard provides CEOs with the tools they need to make quick, data-driven decisions. By consolidating data from across the organization and displaying it in an easy-to-read format, dashboards ensure that CEOs have access to real-time insights into key business metrics. Whether tracking financial performance, sales growth, or marketing ROI, a well-designed dashboard helps executives respond to changes in the business environment quickly and effectively. With customizable templates and the ability to integrate data from various sources, executive dashboards streamline decision-making and improve overall business performance.
Future Trends in Executive Dashboards and Reporting
As dashboard software continues to evolve, future trends will focus on greater automation, AI-driven insights, and real time data processing. Executive dashboards will become more intuitive and customizable, allowing business leaders to tailor their reporting dashboards to fit their specific needs. AI tools will enhance the data analysis process, providing predictive insights that help executives anticipate business challenges before they arise. Additionally, the integration of more data sources—both internal and external—will give businesses a more comprehensive view of their financial health and operational performance. These advancements will make executive dashboards even more powerful tools for making informed and strategic business decisions.
You may be interested: