Purpose of the Accounts Payable Template in Google Sheets The Accounts Payable Metrics Tracker Template is designed to help big or small business owners, accountants, and bookkeepers manage their accounts payable processes efficiently. By using this Google Sheets template, users can streamline their workflow, reduce errors and omissions, and automate data entry. The template provides […]
Category: Financial Dashboard
Financial Dashboard
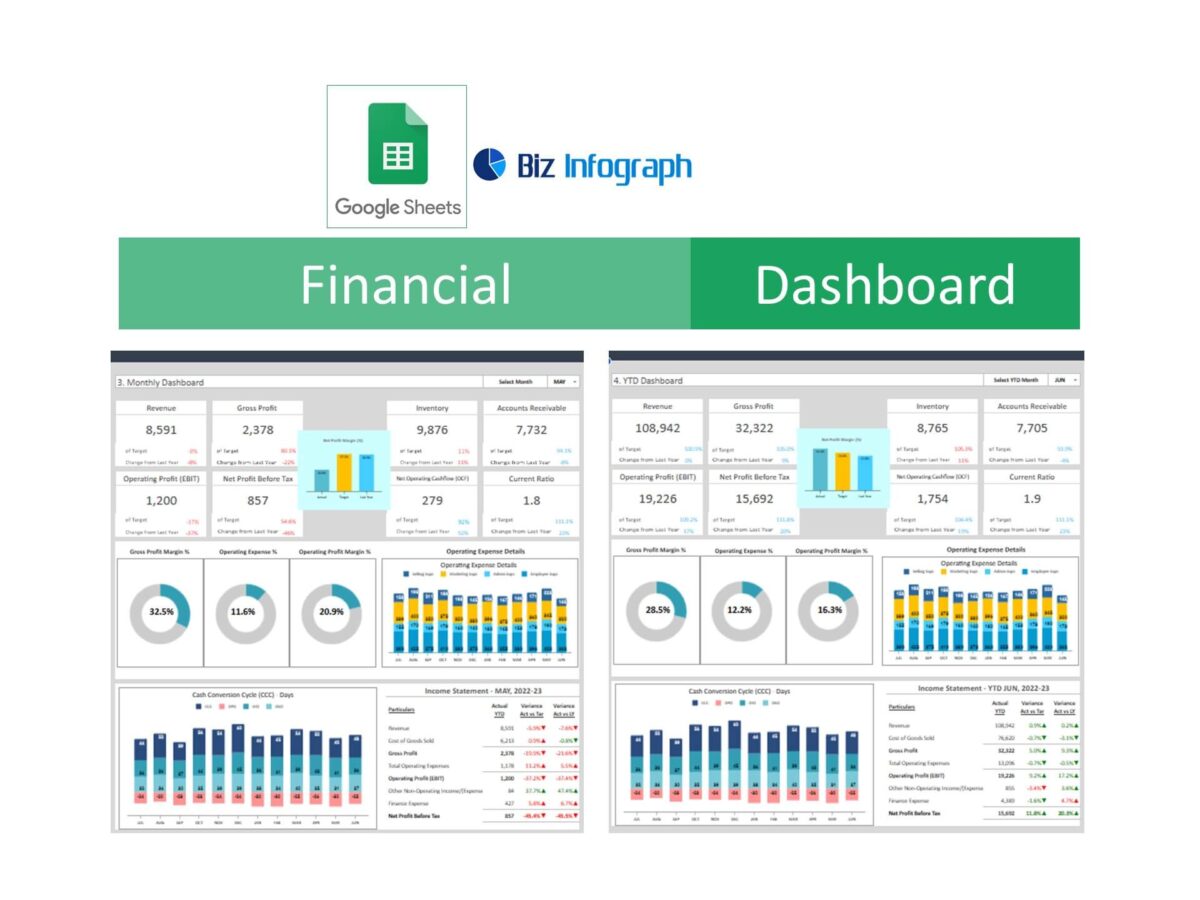
Introduction to the Financial Dashboard Template in Google Sheets Overview of the Financial Dashboard Template A Financial Dashboard Template in Google Sheets is a powerful tool designed to help businesses track, manage, and visualize their financial data. This template leverages the functionality of Google Sheets to provide a comprehensive solution for financial monitoring. It includes […]
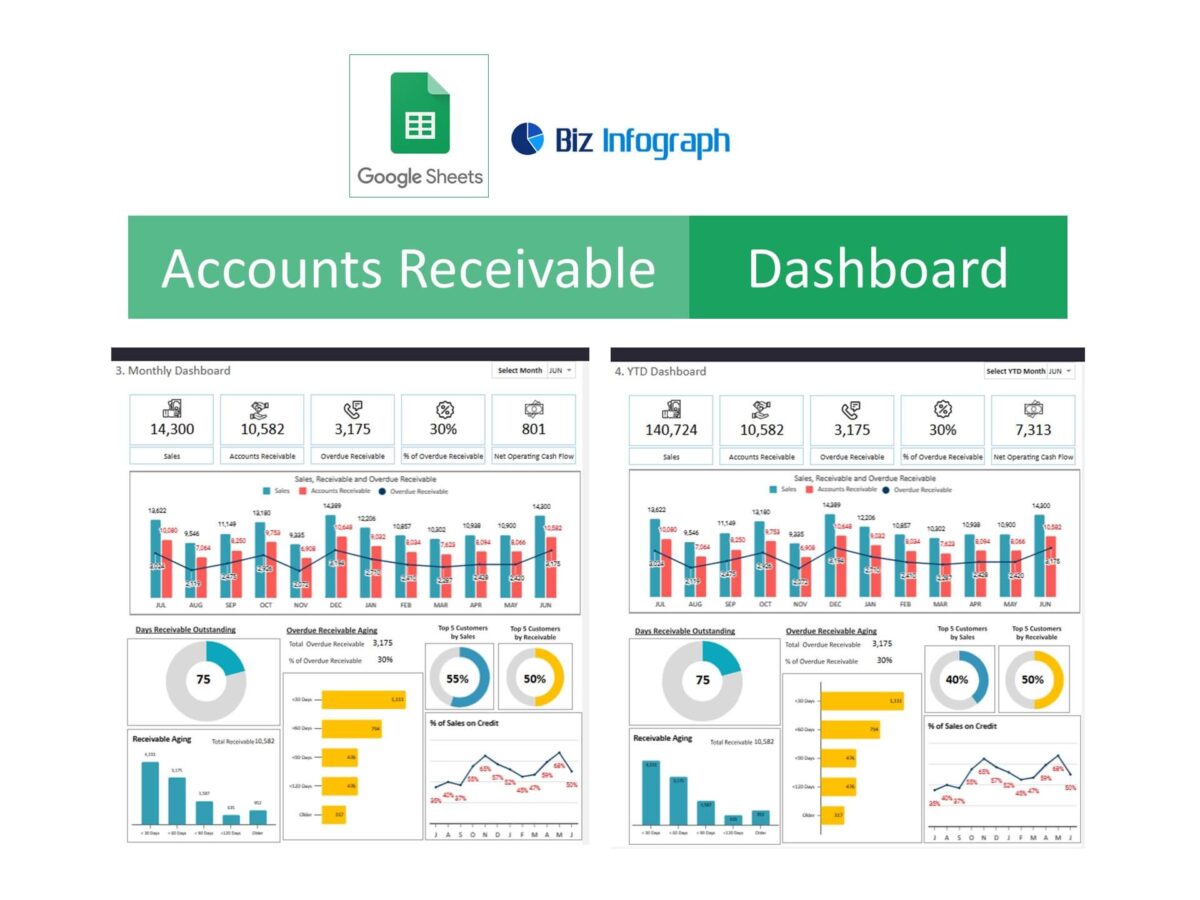
Understanding Accounts Receivable What is Accounts Receivable? Accounts receivable (AR) refers to the outstanding invoices a company has or the money it is owed from clients. These are legally enforceable claims for payment held by a business for goods supplied or services rendered that customers have ordered but not yet paid for. Effective management of […]
Importance of Effective Accounts Receivable Management Effective accounts receivable (AR) management is crucial for maintaining healthy cash flow and ensuring the financial stability of a business. Proper AR management helps in timely collection of receivables, which directly impacts the company’s ability to pay its own obligations and invest in growth opportunities. An efficient AR process […]
What is a CFO Dashboard? A CFO Dashboard is a powerful tool used by Chief Financial Officers to monitor and manage an organization’s financial health. It consolidates various financial metrics and key performance indicators (KPIs) into a single, interactive interface. This dashboard enables CFOs to make data-driven decisions, track financial performance, and quickly identify trends […]
Benefits of Using Google Sheets for Financial Management Google Sheets is a powerful tool for financial management due to its accessibility, ease of use, and integration capabilities. It allows CFOs to create dynamic dashboards that provide actionable insights. With Google Sheets, you can easily import data from various sources, including CSV files and Google Drive. […]
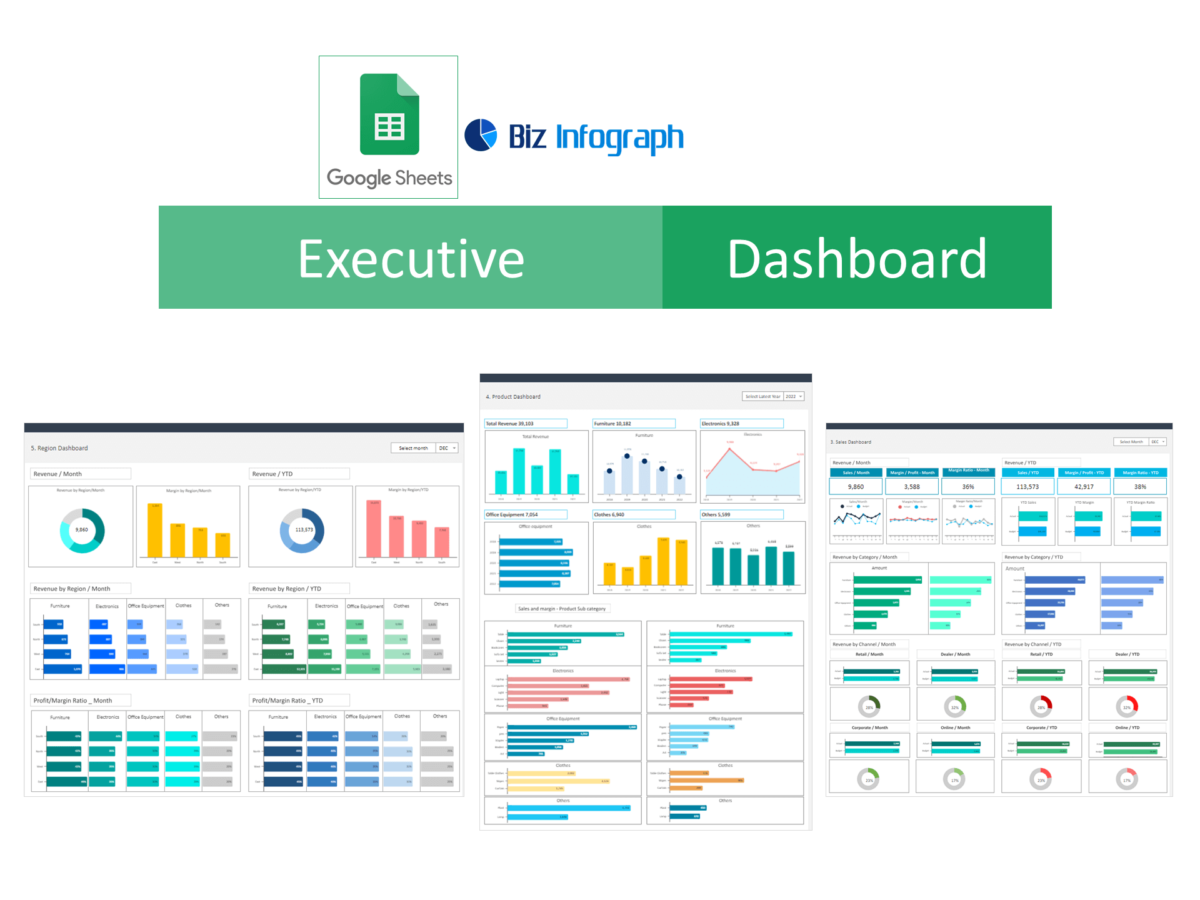
Introduction to Executive Dashboards in Google Sheets Understanding Executive Dashboards Executive dashboards are vital tools for high-level management, providing a visual snapshot of a company’s performance and key metrics. Dashboard template in Google Sheets consolidates data from various sheets, offering a centralized view of critical information. This facilitates informed decision-making by displaying trends, comparisons, and […]
Biz Infograph inventory dashboards Inventory management is the backbone of any business that deals with physical goods. It’s the art of finding that delicate balance between having enough stock to meet demand while avoiding overstocking, which ties up capital and increases carrying costs. In this dynamic world of supply chains, markets, and consumer preferences, strategic […]
Biz Infograph’s budget templates Budgeting, often considered a necessary yet daunting task, is the financial backbone of any organization. It’s the roadmap that guides us toward our financial goals. However, creating and managing budgets can be a cumbersome process, rife with challenges. That’s where Excel dashboards come into play, transforming how we approach budgeting. In […]
In the realm of financial well-being, few factors are as pivotal as understanding your cash flow. It’s the lifeblood of any financial endeavor, be it a thriving business, an investment portfolio, or your personal finances. But understanding cash flow isn’t just about knowing the numbers; it’s about gaining a clear and actionable insight into the […]