Understanding Compound Interest Basics
Key Components of the Compound Interest Formula
Compound interest is calculated using the formula:
A = P(1 + r/n)^(nt)
where:
- A = Future value (principal + accumulated interest)
- P = Principal amount
- r = Annual interest rate (e.g., 5% as 0.05)
- n = Number of compounding periods per year (monthly = 12, quarterly = 4)
- t = Time in years.
This formula for compound interest accounts for interest on interest, where accumulated interest from previous periods boosts growth exponentially. Understanding these variables helps model scenarios like investments or loans. For example, a 1,000principal∗∗witha∗∗51,000principal∗∗witha∗∗51,283.36. Microsoft Excel simplifies these compound interest calculations in Excel using built-in functions like FV.
Importance of Compounding Periods in Calculations
The number of compounding periods per year (n) directly impacts accumulated interest. More frequent compounding (e.g., monthly vs. annually) accelerates growth due to interest earned on interest more often. For instance, 10,000∗∗at∗∗510,000∗∗at∗∗512,834 after 10 years, whereas annual compounding yields $12,578. This power of compound interest highlights why savings accounts or investments with frequent compounding outperform those with simpler structures. Excel allows users to adjust n in formulas to compare outcomes, making it easier to visualize how compounded interest grows over time.
Real-World Applications of Compound Interest
Compound interest is crucial in savings, loans, and investments. For example, retirement accounts leverage interest on savings calculated through compounding to grow wealth. Conversely, loans with compounding inflate debt faster. Application of compound interest also appears in mortgages, where monthly payments include principal and accumulated interest. Excel helps model these scenarios: using the FV function, you can forecast savings growth or debt repayment. Understanding compound interest allows your money to work smarter, whether planning long-term goals or avoiding high-interest debt traps.
Using Excel Formulas for Compound Interest
Excel FV Function for Future Value Calculation
Excel’s FV function simplifies compound interest calculations in Excel. The syntax is:
=FV(rate, nper, pmt, [pv], [type])
- rate = Periodic interest rate (e.g., 5% annual rate / 12 for monthly compounding).
- nper = Total number of compounding periods (e.g., 5 years * 12 for monthly).
- pmt = Constant payments per period (optional).
- pv = Principal (present value).
For example, =FV(5%/12, 60, 0, -1000) calculates the future value of $1,000 at 5% annual interest compounded monthly over 5 years. This built-in function eliminates manual errors and saves time.
Step-by-Step Guide to Calculate Compound Interest Manually
To calculate the compound interest without the FV function:
- Divide the annual interest rate (e.g., 5%) by compounding periods per year.
- Multiply the adjusted rate by the principal.
- Add the result to the principal.
- Repeat for each period.
In Excel, use the formula =P(1 + r/n)^(nt)** directly. For instance, =1000(1+0.05/12)^(125)** yields $1,283.36. This formula in Excel mirrors the mathematical approach, ideal for customizing variables like monthly payments or irregular compounding.
Customizing the Compound Interest Formula in Excel
Excel formulas to calculate compound interest can be tailored for specific scenarios. For example, to include constant payments, combine FV with PMT. To model variable rates, use cell references for r, n, and t. The compound interest formula in Excel can also factor in fees or taxes by subtracting them from the accumulated interest. For instance, =FV((5%-0.5%)/12, 60, -100, -1000) calculates growth with a 0.5% annual fee. This flexibility makes Excel a powerful tool for dynamic financial planning.
Compound Interest vs. Simple Interest in Excel
Formula Differences Between Simple and Compound Interest
Simple interest is calculated as I = Prt, where interest is only on the principal. For example, 1,000∗∗at∗∗51,000∗∗at∗∗5250. Compound interest, however, uses A = P(1 + r/n)^(nt), generating $1,283.36 under monthly compounding. The key difference is interest on interest in compounding, absent in simple interest. Excel highlights this gap: the FV function automatically factors in compounding, while interest requires basic multiplication.
Practical Examples Comparing Both Methods in Excel
In Excel, compare both methods side-by-side:
- Simple Interest: =1000 + (1000 * 0.05 * 5) = $1,250.
- Compound Interest: =FV(5%/12, 60, 0, -1000) = 1,283.36∗∗.The∗∗1,283.36∗∗.The∗∗33.36 difference grows exponentially over time. Excel can help visualize this by plotting both results over 10-20 years, showing how compound interest formula excel outpaces simple interest.
When to Use Compound Interest Over Simple Interest
excel Compound interest formula applies to savings accounts, investments, or loans with reinvested interest. Use it for long-term goals like retirement. Simple interest suits short-term loans or bonds with fixed payouts. In Excel, use compound interest calculations for scenarios with constant interest rate per period reinvestment. For instance, a 30-year mortgage with monthly payments benefits from compound modeling, while a 1-year car loan aligns with simple interest. Interest is compounded quarterly, allowing savings to grow significantly over time.
Creating a Compound Interest Calculator in Excel
Building a Dynamic Calculator with the FV Function
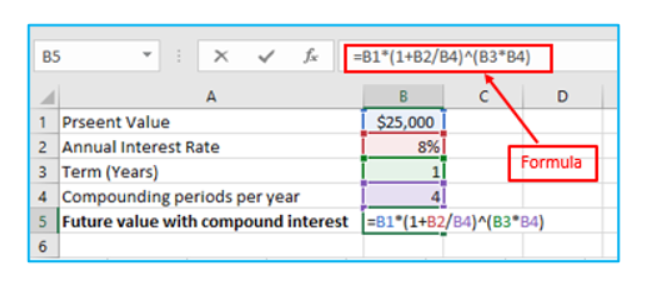
Create a compound interest in Excel using the FV and input cells for principal, rate, time, and compounding periods. For example:
- Label cells: Principal (B1), Annual Rate (B2), Years (B3), Periods/Year (B4).
- Use =FV(B2/B4, B3*B4, 0, -B1) in B5.
This updates results instantly when inputs change, ideal for testing scenarios like adjusting monthly payments or rate of interest.
Automating Inputs for Principal, Rate, Time, and Periods
Enhance the calculator by adding sliders or data validation for inputs. For example:
- Use Data Validation to restrict compounding periods to 1 (annual), 4 (quarterly), or 12 (monthly).
- Link cells to a rate slider (e.g., 1%–10%).
This automation lets users easily calculate interest without manual entry errors. Save the template as an Excel file for reuse.
Learn how to calculate compound interest in Excel using the FV function.
For ready-to-use Dashboard Templates: