Generation by Merging Excel Files by Power Automate
Why Automate Departmental Report Generation?
Challenges of Manual Excel File Merging
Manually merging Excel files is time-consuming and error-prone, especially when handling large datasets or inconsistent formatting across departments. For example, merging monthly sales reports from regional teams often leads to data duplication, mismatched columns (e.g., "Revenue" vs. "Sales"), or accidental overwrites. Version control becomes a nightmare when multiple users update the same Excel worksheet, and scalability is nearly impossible for organizations processing hundreds of files. Manual processes also lack real-time updates, forcing teams to copy and paste data repeatedly, increasing the risk of human error and inefficiency.
Benefits of Automating with Power Automate
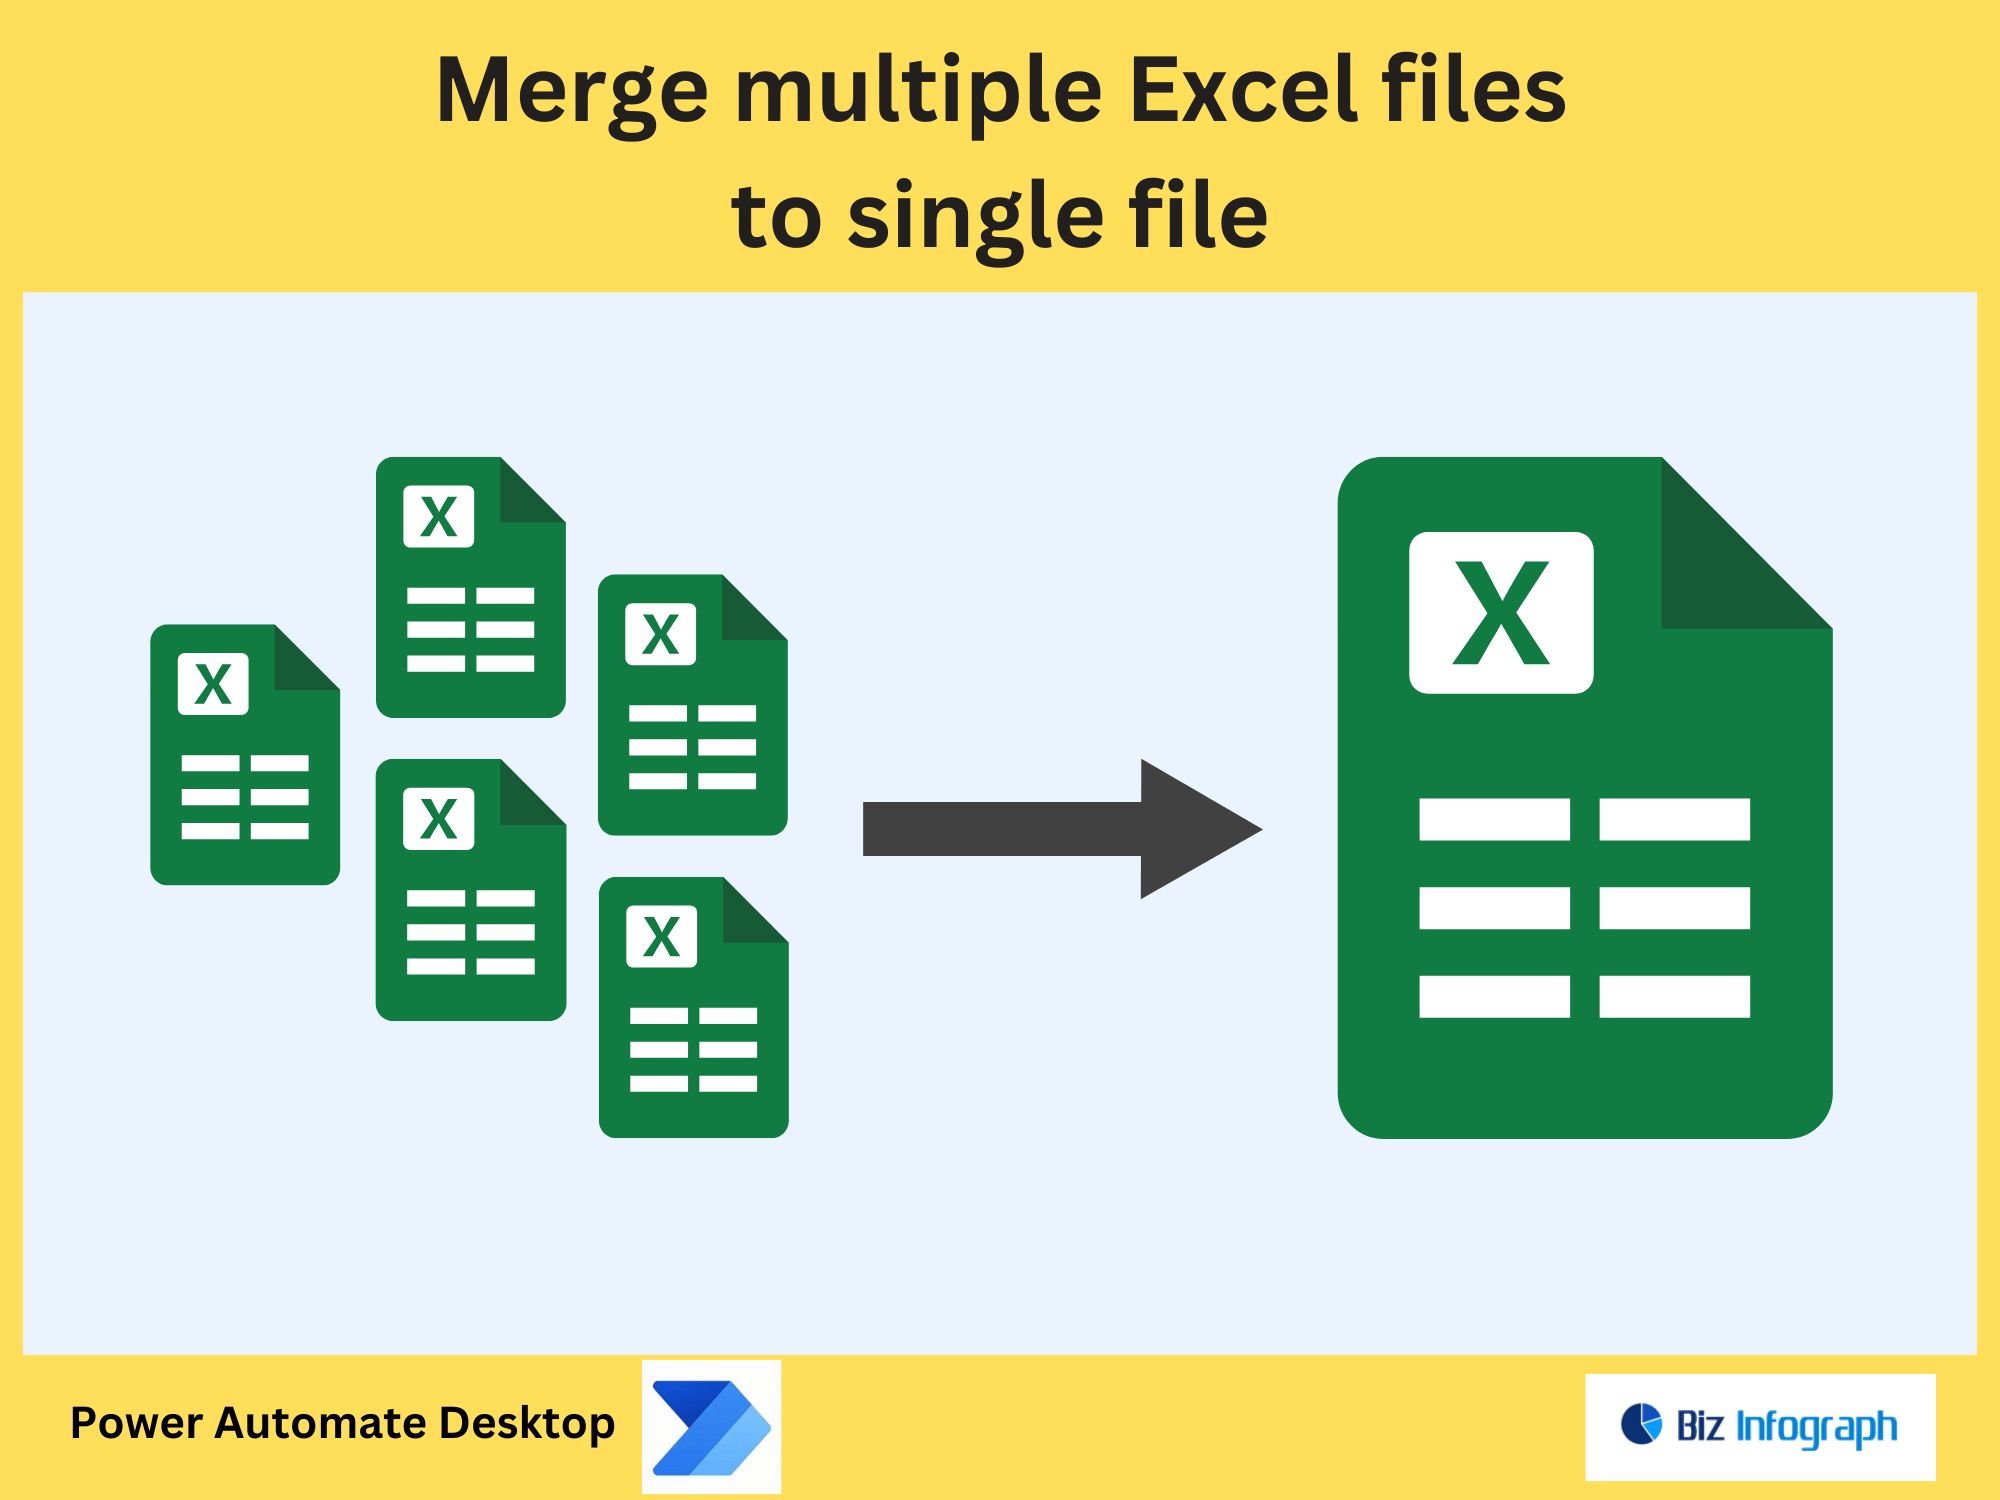
Power Automate solves manual challenges by automating report generation with precision and speed. It merges multiple Microsoft Excel files seamlessly, ensuring consistent formatting and eliminating data duplication. For instance, a workflow can pull sales data from SharePoint, clean it using Power Query, and merge it into a master Excel workbook that auto-updates a Power BI dashboard template. This integration reduces errors, saves hours of repetitive tasks, and enables real-time data updates. Automation also scales effortlessly, handling thousands of files while maintaining data accuracy and enabling scheduled refresh cycles for always up-to-date reports.
How to Merge Excel Files Using Power Automate
Configuring Power Query for Data Transformation
Power Query simplifies data preparation by cleaning and transforming data from multiple Excel files. For example, merge raw sales data from different departments into a unified dataset, removing duplicates or formatting inconsistencies during data cleanup. Use Power Query Editor to filter specific data, pivot columns, or split text, ensuring the combined data is ready for report generation. This transform data step is critical for creating accurate and up-to-date reports without copying and pasting data manually.
Setting Up Power Automate for Automated Merging
Power Automate streamlines automating report workflows by connecting to SharePoint or OneDrive folder to access Excel files. Configure a workflow with triggers like new data uploads, then use the Power Query connector to merge files. For instance, automate merging monthly financial Excel sheets into a master Excel workbook, eliminating repetitive tasks like manual importing data. The flow can simply replace the file in SharePoint, ensuring stakeholders always access the latest dynamic data.
Step-by-Step Guide to Automate Reports
Merging Data from Multiple Excel Files
Leverage Power Automate and Power Query to handle data from data from multiple sources (e.g., regional sales Excel spreadsheets). Use query and build actions to combine datasets into a single Excel worksheet, ensuring columns align. For example, merge raw data from HR, Finance, and Operations into a dashboard-ready format. Apply filter logic to exclude irrelevant rows or highlight critical data, then save the new file to SharePoint for report creation.
Validating and Distributing Reports
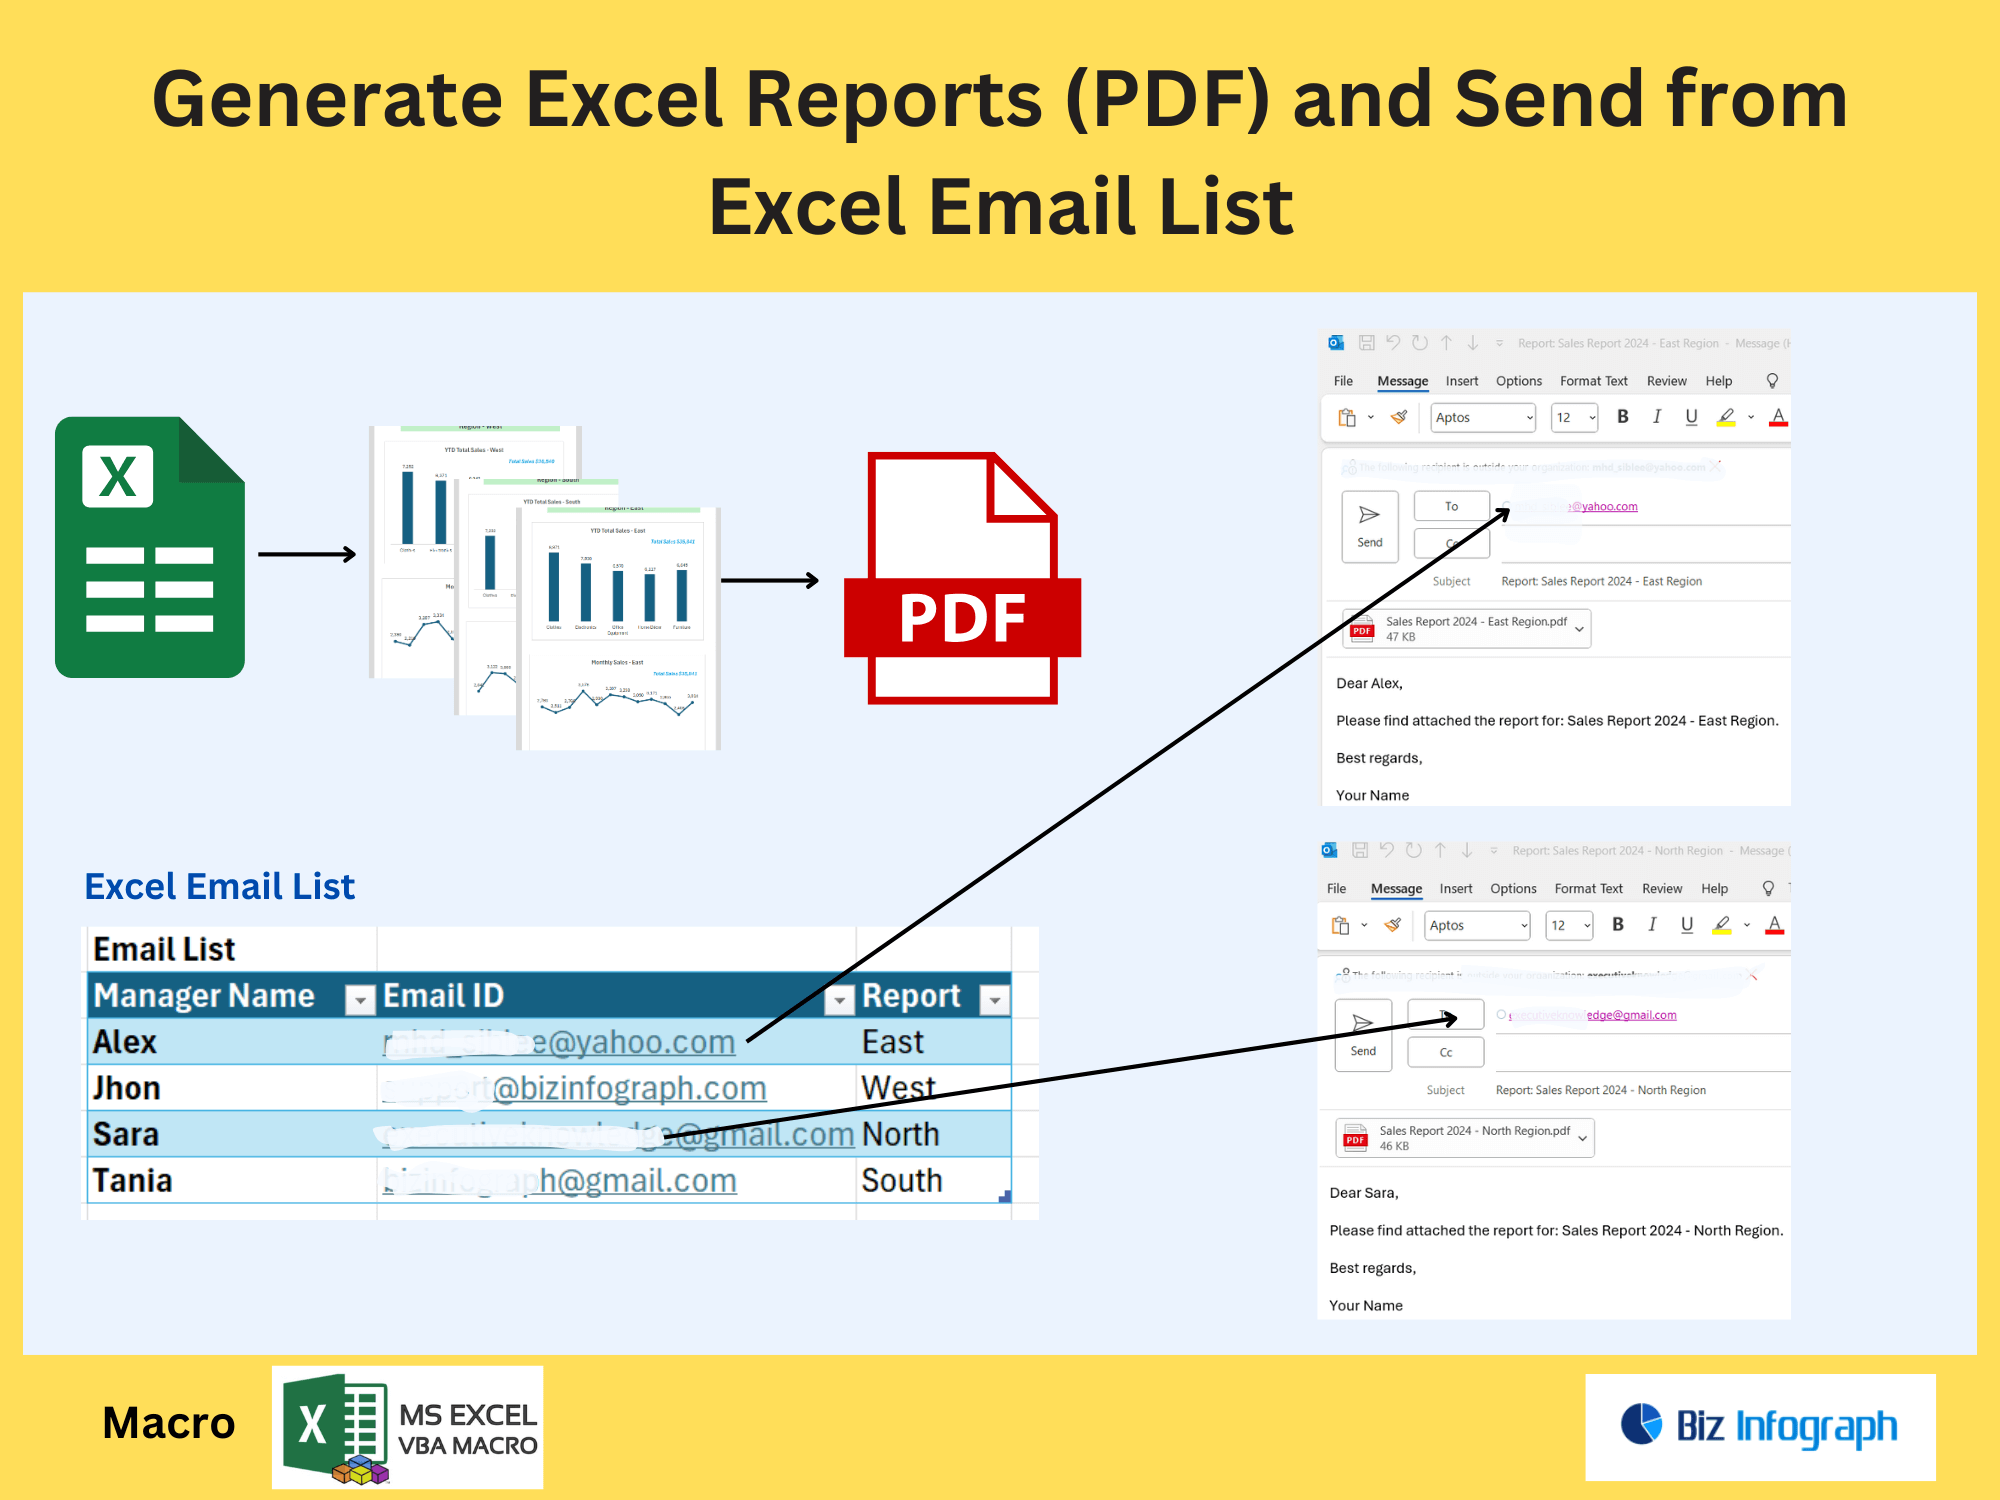
After merging, validate combined data using Power BI for data analysis or Excel’s built-in tools. Schedule data updates to keep reports up-to-date, then use Power Automate to share reports directly to Microsoft Teams channels or email. For example, send a dynamic content-rich sales report to executives via Microsoft 365 every Monday. This reporting automation eliminates the need to create and send reports manually.
Advanced Techniques and Integration
Integrating Power BI for Dynamic Dashboards
Connect merged Excel data to Power BI to create data-driven dashboards that update in real-time. Use within Power BI tools to visualize trends, such as regional sales performance or departmental budgets. Power Automate can trigger refresh cycles to ensure dashboards reflect the latest new data, while Dataverse integration centralizes critical data for cross-team access.
Handling Large-Scale Data Updates
For large datasets, optimize Power Automate workflows to handle data efficiently. Use Office 365 tools like Power Query to preprocess raw data, reducing load times. Schedule data updates during off-peak hours and use Dataverse to manage data lines securely. For example, automate nightly imports of dynamic data from Google Sheets into Excel, ensuring morning reports are always accurate and up-to-date.
For ready-to-use Dashboard Templates: